. 2023 Sep 6:14:1219250.
doi: 10.3389/fimmu.2023.1219250. eCollection 2023.

Aminobisphosphonates reactivate the latent reservoir in people living with HIV-1

Affiliations

Aminobisphosphonates reactivate the latent reservoir in people living with HIV-1

Marta Sanz et al. Front Immunol. .

Abstract

Antiretroviral therapy (ART) is not curative due to the existence of cellular reservoirs of latent HIV-1 that persist during therapy. Current research efforts to cure HIV-1 infection include "shock and kill" strategies to disrupt latency using small molecules or latency-reversing agents (LRAs) to induce expression of HIV-1 enabling cytotoxic immune cells to eliminate infected cells. The modest success of current LRAs urges the field to identify novel drugs with increased clinical efficacy. Aminobisphosphonates (N-BPs) that include pamidronate, zoledronate, or alendronate, are the first-line treatment of bone-related diseases including osteoporosis and bone malignancies. Here, we show the use of N-BPs as a novel class of LRA: we found in ex vivo assays using primary cells from ART-suppressed people living with HIV-1 that N-BPs induce HIV-1 from latency to levels that are comparable to the T cell activator phytohemagglutinin (PHA). RNA sequencing and mechanistic data suggested that reactivation may occur through activation of the activator protein 1 signaling pathway. Stored samples from a prior clinical trial aimed at analyzing the effect of alendronate on bone mineral density, provided further evidence of alendronate-mediated latency reversal and activation of immune effector cells. Decay of the reservoir measured by IPDA was however not detected. Our results demonstrate the novel use of N-BPs to reverse HIV-1 latency while inducing immune effector functions. This preliminary evidence merits further investigation in a controlled clinical setting possibly in combination with therapeutic vaccination.

Keywords: HIV cure; IPDA; aminobisphosphonates; gamma delta (γδ) T cells; latency reversing agents; shock and kill.


Conflict of interest statement

The authors declare that the research was conducted in the absence of any commercial or financial relationships that could be construed as a potential conflict of interest.

Figures

Figure 1
Figure 1
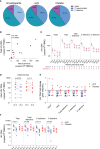
N-BPs induce reactivation of latent HIV ex vivo. (A) Inverse correlation between spontaneous HIV production and CD4 T cell nadir in 19 individuals with available CD4 T cell nadir data (Spearman’s rank correlation). (B) Comparison of HIV gag RNA production from ex vivo rCD4 T cells upon ex vivo treatment with PHA + IL-2 and PAM (N=14). Each symbol represents one individual for whom a mean of 6-15 replicates of 1x10⁶ million cells per condition were assayed. ( Supplementary Figure 1 ).(C) Fold change induction of HIV caRNA levels in PHA+IL-2 and PAM treated samples compared to the untreated control.(D) Infectious units per million (IUPM rCD4 T cells upon ex vivo treatment with PHA+IL-2 or PAM compared to the IL-2 (5U/mL) only control. (E) Fold change induction of IUPM rCD4 T cells upon ex vivo treatment with PHA+IL-2 or PAM. (F) Comparison of fold change IUPM rCD4 T cells according to treatment initiation in the acute or chronic phase of HIV-1 infection. Mean± standard error of the mean (SEM) is represented. Wilcoxon matched pairs signed-rank tests. Filled grey circles represent donors treated during the chronic phase of infection and opened circles are donors treated during the acute phase of infection.
Figure 2
Figure 2
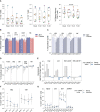
N-BP’s mechanism of action. Ex vivo isolated rCD4 T cells from ART-suppressed PLWH were treated with 2.5μg/mL PAM or left untreated for 6 hours, washed, and RNA extracted for RNA-seq analysis. (A) Representative western blotting of activated Ras (GTP-Ras) and Actin in isolated CD4+ T cells and integrated band density analysis (ImageJ) in 5 independent samples after overnight incubation with PHA, PAM, ALN or Zol (p-values generated by a Mann-Whiney U test). (B) Heatmap displaying the 1,799 differentially expressed (DE) genes (Wald statistic conditioned on donor, q-value < 0.05, and base mean >10) comparing ex vivo untreated samples versus PAM-treated samples; color represents relative expression. Columns and rows were organized by unsupervised hierarchical clustering. Pt, participants. (C) Heatmap displaying genes in the module “GO Response to bacterial lipoprotein”. Columns and rows are organized by unsupervised hierarchical clustering. (D) Modulation of TLR2 expression on ex vivo isolated CD4+ T cells upon treatment with ALN, PAM, Zol or PHA. Overlaid histograms from one representative donor showing mean fluorescence intensity (GMFI), and normalized data to the untreated control at each time point from four different donors (Friedman test). (E) STRING pathway analysis. Representative histograms from three different donors showing MFI expression of (F) c-Jun phosphorylation at Ser73 and mean expression of c-Jun phosphorylation (N=7) and (G) p-65 NFκB subunit phosphorylation at Ser529, and mean expression of p-65 (N=4), upon exposure to N-BPs or PMA.
Figure 3
Figure 3
Effect of in vivo ALN treatment on unspliced HIV gag caRNA. Baseline caRNA levels according to (A) treatment, ALN or placebo, and (B) biological sex, woman or man. (Mann-Whitney U test). The ALN group is represented in blue, and the placebo group is represented in pink. Longitudinal HIV caRNA levels according to (C) treatment, ALN or placebo (Holm-Bonferroni-adjusted p=1.0, at baseline, week 2, and week 24 for ALN and placebo; Mann-Whitney U test), and (D) biological sex, women and men (Holm-Bonferroni-adjusted p=0.01 at baseline, p=0.07 at week 2, p=0.07 at week 24. N=2 at week 48, precluding statistical analysis; Mann-Whitney U test). (N=3 and N=4 for ALN vs placebo; N=2 and N=5 for Women vs Men). Individual HIV caRNA copies/105 PBMCs in participants who took (E) ALN or (F) placebo. Box and whiskers plots represent the min to max values. 5-15 biological replicates of 1x10⁶ cells were performed per individual. Mann-Kendall trend test, *p<0.05, **p<0.01, ***p<0.001. (G) Paired caRNA levels and total HIV DNA levels was available in participants 101 and 105 (pol HIV DNA by ddPCR) and 107 (by IPDA). HIV DNA copies were “0” at weeks 2 and 24. Baseline values are presented in grey and post-intervention weeks in blue. P-values are calculated using a Mann-Kendall trend test.
Figure 4
Figure 4
Effect of ALN on the viral reservoir measured by IPDA. (A) Proportion of defective HIV DNA and intact proviruses. Numbers represent proportion of total. (B) Correlation between intact proviral and total HIV-1 DNA levels at study entry for ALN (blue) and placebo (red) participants (Spearman’s correlation). (C) Longitudinal HIV DNA levels in participants from the ALN and placebo groups. Mean ± standard error of the mean (SEM) is presented. p>0.05 for all comparisons for both ALN and placebo, Mann-kendall test. (D) Comparison of intact proviral levels between baseline and week 2 after intervention in the ALN and placebo groups, Wilcoxon signed-rank test. (E) HIV-1 DNA fold change at week 2 with respect to week 0 calculated as ((week-2–week-0)/week-0) is presented, p>0.05 for all comparisons, Mann Whitney U-test. (F) Changes in total, total defective, hypermutated/3’ defective and 5’ defective HIV-1 DNA from baseline to week 2 after intervention in ALN and placebo groups, Wilcoxon signed-rank test.
Figure 5
Figure 5
Impact of ALN treatment on circulating immune cells’ phenotype and functional markers. (A) Frequency of circulating Vδ2 T cells, Vδ1 T cells and Effector Memory CD8 T cells. Boxplots display first quartile, median, and third quartile with whiskers range from the minimum to maximum values. P-values are from a Wilcoxon-signed rank test and adjusted for multiple comparisons using Holm-Bonferroni. Intracellular production of Granzyme (Gzm) B according to (B) the intervention and (C) biological sex. Mean ± SEM in eight participants is represented. (D) Total and effector cell population’s intracellular production of GzmB according to the HIV caRNA trend (grey, participants in whom HIV-1 caRNA decay was observed (N=3), and blue, participants in whom HIV-1 caRNA induction was observed (N=3). (E) Percent change over time in GzmB, IFN-γ and TNF-α. Values below zero represent reduction from baseline and values above zero represent increase from baseline. Circulating frequencies of (F) γδ T cell populations G) CD8 T cell subpopulations. Mean ± SEM is presented. Mann-Whitney U test. Mass cytometry data on 8 participants treated with ALN and 7 from the placebo group. Mass cytometry data represents the frequency of alive events measured.

Update of

Similar articles

Cited by

References

    1. Chun TW, Carruth L, Finzi D, Shen X, DiGiuseppe JA, Taylor H, et al. . Quantification of latent tissue reservoirs and total body viral load in HIV-1 infection. Nature (1997) 387:183–8. doi: 10.1038/387183a0 - DOI - PubMed
    1. Archin NM, Sung JM, Garrido C, Soriano-Sarabia N, Margolis DM. Eradicating HIV-1 infection: seeking to clear a persistent pathogen. Nat Rev Microbiol (2014) 12:750–64. doi: 10.1038/nrmicro3352 - DOI - PMC - PubMed
    1. Ait-Ammar A, Kula A, Darcis G, Verdikt R, De Wit S, Gautier V, et al. . Current status of latency reversing agents facing the heterogeneity of HIV-1 cellular and tissue reservoirs. Front Microbiol (2019) 10:3060. doi: 10.3389/fmicb.2019.03060 - DOI - PMC - PubMed
    1. Board NL, Moskovljevic M, Wu F, Siliciano RF, Siliciano JD. Engaging innate immunity in HIV-1 cure strategies. Nat Rev Immunol (2022) 22:499–512. doi: 10.1038/s41577-021-00649-1 - DOI - PubMed
    1. Kavanagh KL, Guo K, Dunford JE, Wu X, Knapp S, Ebetino FH, et al. . The molecular mechanism of nitrogen-containing bisphosphonates as antiosteoporosis drugs. Proc Natl Acad Sci USA (2006) 103:7829–34. - PMC - PubMed

Publication types