Transcriptional landscape of Kaposi sarcoma tumors identifies unique immunologic signatures and key determinants of angiogenesis
- PMID: 37740179
- PMCID: PMC10517594
- DOI: 10.1186/s12967-023-04517-5
Transcriptional landscape of Kaposi sarcoma tumors identifies unique immunologic signatures and key determinants of angiogenesis
Abstract
Background: Kaposi sarcoma (KS) is a multicentric tumor caused by Kaposi sarcoma herpesvirus (KSHV) that leads to morbidity and mortality among people with HIV worldwide. KS commonly involves the skin but can occur in the gastrointestinal tract (GI) in severe cases.
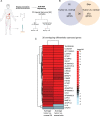
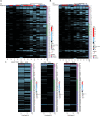
Methods: RNA sequencing was used to compare the cellular and KSHV gene expression signatures of skin and GI KS lesions in 44 paired samples from 19 participants with KS alone or with concurrent KSHV-associated diseases. Analyses of KSHV expression from KS lesions identified transcriptionally active areas of the viral genome.
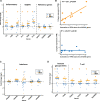
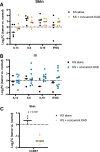
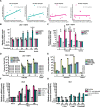
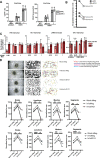
Results: The transcript of an essential viral lytic gene, ORF75, was detected in 91% of KS lesions. Analyses of host genes identified 370 differentially expressed genes (DEGs) unique to skin KS and 58 DEGs unique to GI KS lesions as compared to normal tissue. Interleukin (IL)-6 and IL-10 gene expression were higher in skin lesions as compared to normal skin but not in GI KS lesions. Twenty-six cellular genes were differentially expressed in both skin and GI KS tissues: these included Fms-related tyrosine kinase 4 (FLT4), encoding an angiogenic receptor, and Stanniocalcin 1 (STC1), a secreted glycoprotein. FLT4 and STC1 were further investigated in functional studies using primary lymphatic endothelial cells (LECs). In these models, KSHV infection of LECs led to increased tubule formation that was impaired upon knock-down of STC1 or FLT4.
Conclusions: This study of transcriptional profiling of KS tissue provides novel insights into the characteristics and pathogenesis of this unique virus-driven neoplasm.
Trial registration: ClinicalTrials.gov NCT00006518 NCT03300830.
© 2023. BioMed Central Ltd., part of Springer Nature.
Conflict of interest statement
R. Yarchoan reports receiving research support from Celgene (now Bristol Myers Squibb) through CRADAs with the NCI. Dr. Yarchoan also reports receiving drugs for clinical trials from Merck, EMD-Serano, Eli Lilly, and CTI BioPharma through CRADAs with the NCI, and he has received drug supply for laboratory research from Janssen Pharmaceuticals. R. Yarchoan is a co-inventor on US Patent 10,001,483 entitled "Methods for the treatment of Kaposi's sarcoma or KSHV-induced lymphoma using immunomodulatory compounds and uses of biomarkers." An immediate family member of R. Yarchoan is a co-inventor on patents or patent applications related to internalization of target receptors, epigenetic analysis, and ephrin tyrosine kinase inhibitors. All rights, title, and interest to these patents have been assigned to the U.S. Department of Health and Human Services; the government conveys a portion of the royalties it receives to its employee inventors under the Federal Technology Transfer Act of 1986 (P.L. 99-502). Other authors declare that they have no competing interests.
Figures
Similar articles
-
Kaposi's Sarcoma-Associated Herpesvirus Infection Induces the Expression of Neuroendocrine Genes in Endothelial Cells.J Virol. 2020 Mar 31;94(8):e01692-19. doi: 10.1128/JVI.01692-19. Print 2020 Mar 31. J Virol. 2020. PMID: 31969437 Free PMC article.
-
KSHV viral load and Interleukin-6 in HIV-associated pediatric Kaposi sarcoma-Exploring the role of lytic activation in driving the unique clinical features seen in endemic regions.Int J Cancer. 2019 Jan 1;144(1):110-116. doi: 10.1002/ijc.31863. Epub 2018 Oct 31. Int J Cancer. 2019. PMID: 30204240 Free PMC article.
-
Oncogenic Herpesvirus Engages Endothelial Transcription Factors SOX18 and PROX1 to Increase Viral Genome Copies and Virus Production.Cancer Res. 2020 Aug 1;80(15):3116-3129. doi: 10.1158/0008-5472.CAN-19-3103. Epub 2020 Jun 9. Cancer Res. 2020. PMID: 32518203 Free PMC article.
-
Endothelial cell- and lymphocyte-based in vitro systems for understanding KSHV biology.Curr Top Microbiol Immunol. 2007;312:211-44. doi: 10.1007/978-3-540-34344-8_8. Curr Top Microbiol Immunol. 2007. PMID: 17089799 Review.
-
The role of Kaposi sarcoma-associated herpesvirus in the pathogenesis of Kaposi sarcoma.J Pathol. 2015 Jan;235(2):368-80. doi: 10.1002/path.4441. J Pathol. 2015. PMID: 25212381 Review.
Cited by
-
Mapping herpesvirus-driven impacts on the cellular milieu and transcriptional profile of Kaposi sarcoma in patient-derived mouse models.bioRxiv [Preprint]. 2024 Sep 28:2024.09.27.615429. doi: 10.1101/2024.09.27.615429. bioRxiv. 2024. PMID: 39386738 Free PMC article. Preprint.
-
Kaposi sarcoma herpesvirus viral load in bronchoalveolar lavage as a diagnostic marker for pulmonary Kaposi sarcoma.AIDS. 2024 Jul 1;38(8):1172-1180. doi: 10.1097/QAD.0000000000003897. Epub 2024 Apr 1. AIDS. 2024. PMID: 38564482
-
HIV-associated cancers and lymphoproliferative disorders caused by Kaposi sarcoma herpesvirus and Epstein-Barr virus.Clin Microbiol Rev. 2024 Sep 12;37(3):e0002223. doi: 10.1128/cmr.00022-23. Epub 2024 Jun 20. Clin Microbiol Rev. 2024. PMID: 38899877 Review.
-
Analysis of tumor infiltrating immune cells in Kaposi sarcoma lesions discovers shifts in macrophage populations.Glob Health Med. 2024 Oct 31;6(5):310-315. doi: 10.35772/ghm.2024.01066. Glob Health Med. 2024. PMID: 39483448 Free PMC article.
References
-
- Chang Y, Cesarman E, Pessin MS, Lee F, Culpepper J, Knowles DM, et al. Identification of herpesvirus-like DNA sequences in AIDS-associated Kaposi’s sarcoma. Science. 1994;266(5192):1865. - PubMed
Publication types
MeSH terms
Substances
Associated data
Grants and funding
LinkOut - more resources
Full Text Sources
Medical
Molecular Biology Databases
Miscellaneous

