. 2023 Sep 21;14(1):5882.
doi: 10.1038/s41467-023-41614-x.

SRC and TKS5 mediated podosome formation in fibroblasts promotes extracellular matrix invasion and pulmonary fibrosis

Affiliations

SRC and TKS5 mediated podosome formation in fibroblasts promotes extracellular matrix invasion and pulmonary fibrosis

Ilianna Barbayianni et al. Nat Commun. .

Abstract

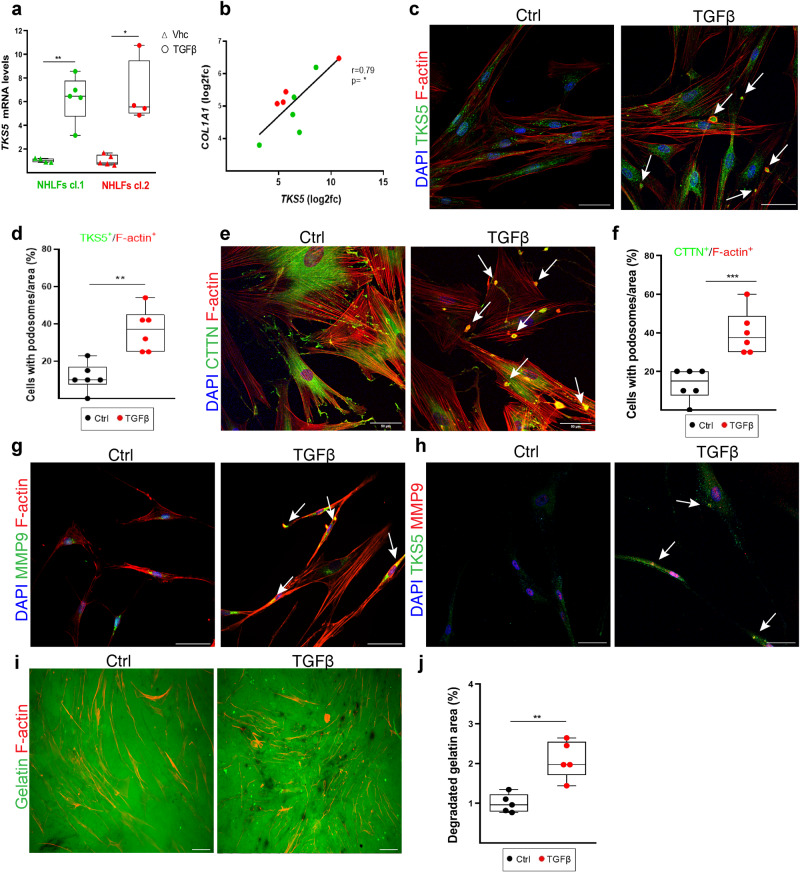
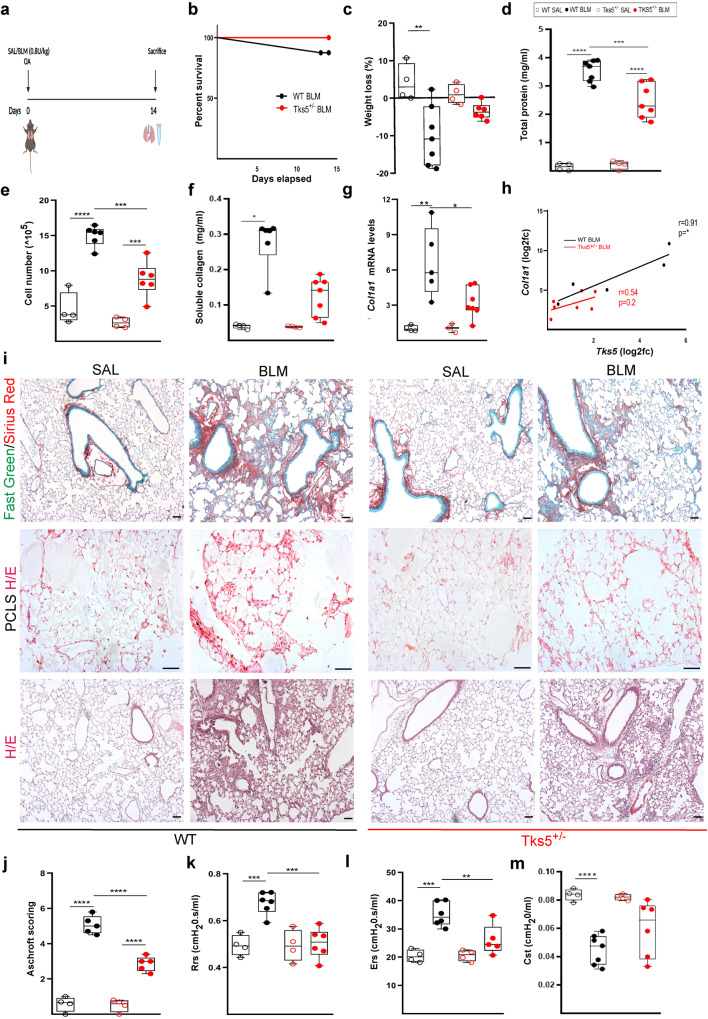
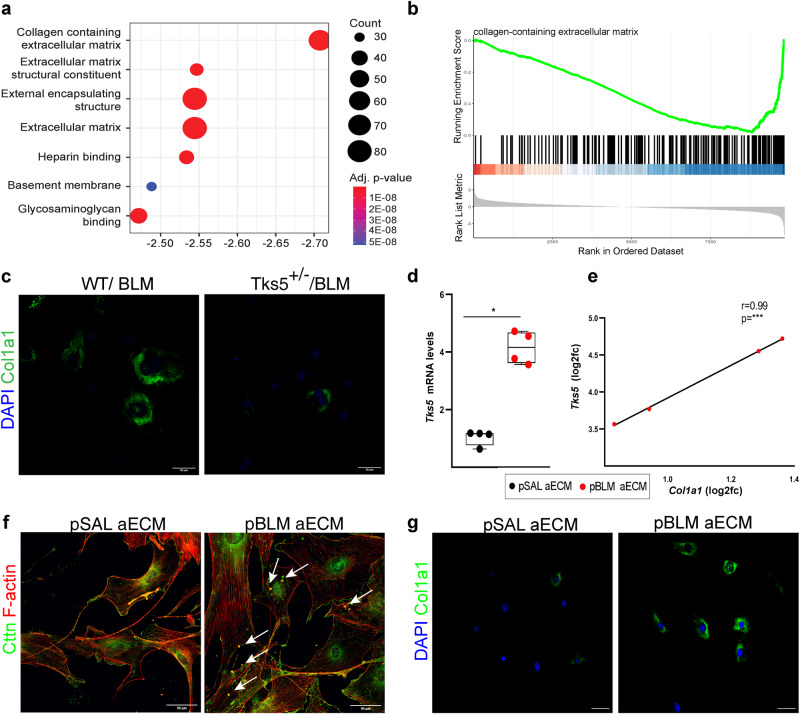
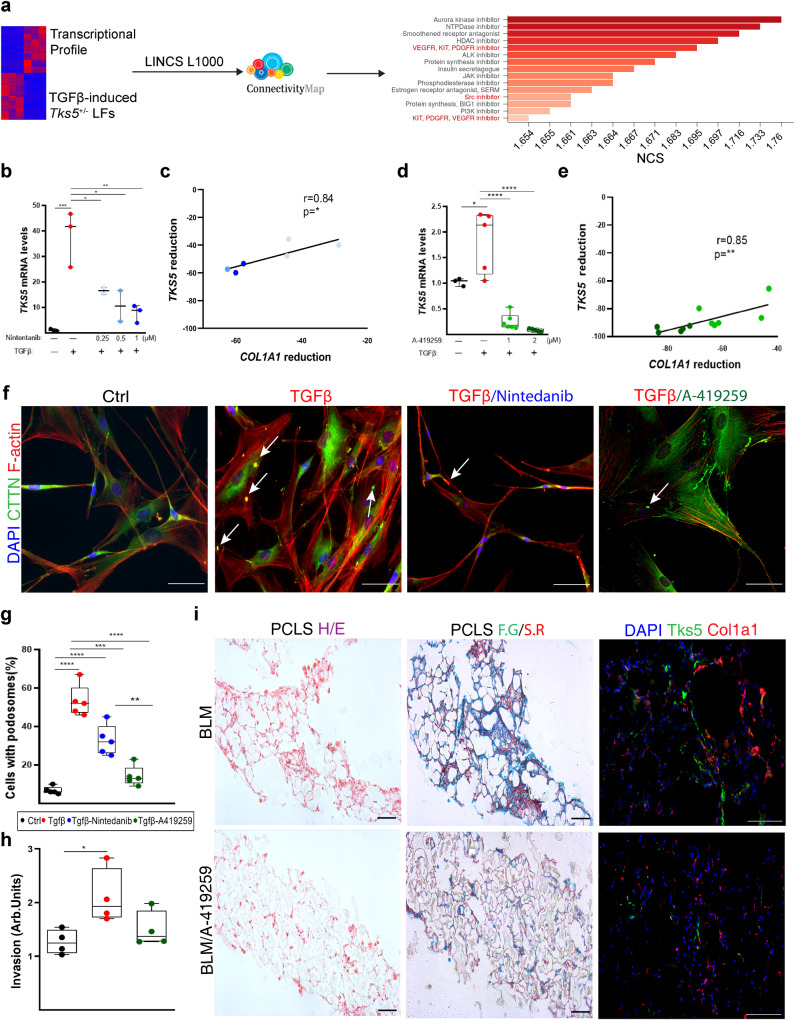
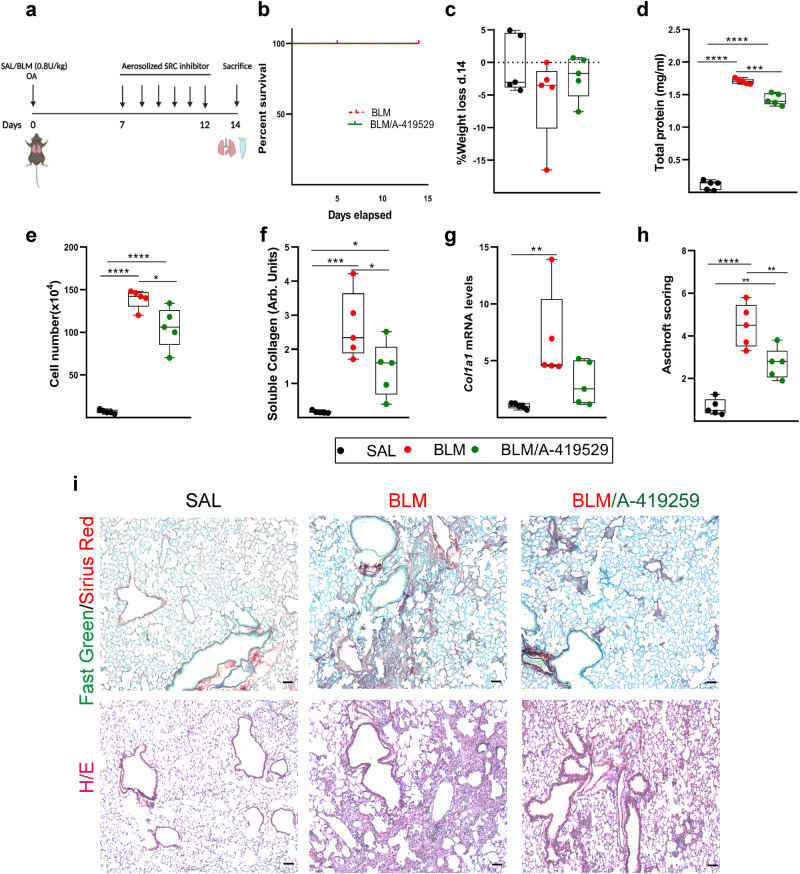
The activation and accumulation of lung fibroblasts resulting in aberrant deposition of extracellular matrix components, is a pathogenic hallmark of Idiopathic Pulmonary Fibrosis, a lethal and incurable disease. In this report, increased expression of TKS5, a scaffold protein essential for the formation of podosomes, was detected in the lung tissue of Idiopathic Pulmonary Fibrosis patients and bleomycin-treated mice. Τhe profibrotic milieu is found to induce TKS5 expression and the formation of prominent podosome rosettes in lung fibroblasts, that are retained ex vivo, culminating in increased extracellular matrix invasion. Tks5+/- mice are found resistant to bleomycin-induced pulmonary fibrosis, largely attributed to diminished podosome formation in fibroblasts and decreased extracellular matrix invasion. As computationally predicted, inhibition of src kinase is shown to potently attenuate podosome formation in lung fibroblasts and extracellular matrix invasion, and bleomycin-induced pulmonary fibrosis, suggesting pharmacological targeting of podosomes as a very promising therapeutic option in pulmonary fibrosis.


Conflict of interest statement

A.T. has received fees for speaking and/or organizing education from AstraZeneca, Menarini, Boehringer Ingelheim, Chiesi, Hoffmann-La Roche, Ltd., GlaxoSmithKline and Elpen, for consulting from Boehringer Ingelheim, Pfizer, Gilead, Hoffmann-La Roche, Ltd., GlaxoSmithKline, and has received research funding, including institutional funding, from Boehringer Ingelheim, Chiesi, Hoffmann-La Roche, Ltd., GlaxoSmithKline and Astra Zeneca, outside the submitted work. B.C. has received fees for speaking and/or organizing education from Apellis, Astra Zeneca, BMS, Boehringer Ingelheim, Novartis, Roche and Sanofi, for consulting fees from Apellis, BMS, Boehringer Ingelheim and Sanofi, and has received research funding from Boehringer Ingelheim, outside the submitted work. N.K. is a scientific founder at Thyron, served as a consultant to Biogen Idec, Boehringer Ingelheim, Third Rock, Pliant, Samumed, NuMedii, Theravance, LifeMax, Three Lake Partners, Optikira, Astra Zeneca, RohBar, Veracyte, Augmanity, CSL Behring, Galapagos and Thyron over the last 3 years, reports Equity in Pliant and Thyron, and grants from Veracyte, Boehringer Ingelheim, BMS and non-financial support from MiRagen and Astra Zeneca, outside the submitted work. Other authors declare that they have no conflict of interest.

Figures

Fig. 1
Fig. 1. Increased TKS5 expression in pulmonary fibrosis.
a TKS5 mRNA expression in lung tissue from Idiopathic Pulmonary Fibrosis (IPF) patients as compared (log2FC) to controls (CTRL) in different publicly available datasets (n = 9) (Supplementary Table 1) at Fibromine. b Volcano plot from a representative large dataset (FC > 1.2, FDR < 0.05). c Scatter plot of TKS5 and COL1A1 expression in the same dataset with a fitted linear model and 95% CI; correlation was assessed with two-tailed Spearman’s test (ρ > 0.6; p = 8.92E-08). d Increased TKS5 mRNA levels in the lung tissue of IPF (Usual Interstitial Pneumonitis; UIP) patients (n = 20) were detected with Q-RT-PCR (r2 = 0.98, E = 97%), as compared with lung tissue from COPD pa tients (n = 19) and control (CTRL) lung tissue isolated from lung cancer patients (n = 9) (Supplementary Table 2). Values were normalized to the expression values of the housekeeping gene B2M and presented as fold change to CTRL values. Statistical significance was assessed with two-tailed Kruskal-Wallis test (**p = 0.0076, *p = 0.0129). e Increased TKS5 immunostaining in fibrotic lungs. Representative images from immunohistochemistry for TKS5 (brown) in IPF and CTRL lung tissue (n = 3; Supplementary Fig. 2); scale bars = 50 μm. f TKS5 is expressed mainly by the COL1A1-expressing cluster/LF subpopulation. in a publicly available scRNAseq dataset (Reyfman, Walter et al. 2019). Statistical significance was assessed with Wilcoxon Rank Sum test (*FC > 1.2, Bonferroni corrected p = 8.9E-12 / 1.1E-10 / 2.1E-3 from left to right). g, h Tks5 and Col1a1 mRNA expression was interrogated with Q-RT-PCR (r2 = 0.89/0.93; E = 103%/96%); cumulative result from 3 different experiments. Values were normalized over the expression of B2m and presented as fold change (log2) over control (n = 8/12). Statistical significance was assessed with two-tailed Mann Witney test (****p < 0.0001). h Two tailed spearman correlation plot of Col1a1 expression in the same samples (*p = 0.0323; r = 0.63). i. Double immunostaining against Tks5 (green) and aSMA (Acta2) or Col1a1 (red); representative images are shown, followed by their respective quantification (n = 4) with Image J; scale bars=50 μm; a representative experiment out of 3 successful independent ones are shown. Statistical significance was assessed with two-tailed Welch’s test (*p = 0.0211, **p = 0.0013). In all panels all samples are biologically independent; boxplots visualize the median of each distribution; upper/lower hinges represent 1st/3rd quartiles; whiskers extend no further than 1.5 * IQR from the respective hinge. Source data for all panels are provided as a Source Data file.
Fig. 2
Fig. 2. TGFβ induces the formation of podosome rosettes in normal human lung fibroblasts (NHLFs).
Serum starved, sub-confluent (70–80%), primary NHLFs were stimulated with recombinant human TGFβ (10 ng/ml) for 24 h; a representative experiment out of 4 successful independent ones is shown. a, b TKS5 and COL1A1 mRNA expression was interrogated with Q-RT-PCR (r2 = 0,94/0,92; E = 98,3%/93% respectively) in two NHLF clones (cl.l, cl.2). Values were normalized to the expression values of the housekeeping gene B2M and presented as fold change over control; n = 4/5/4/4; statistical significance was assessed with two-tailed Welch’s test (a/cl.1) and two-tailed Mann Whitney test (a/l.2); **p = 0.0012, *p = 0.0159 respectively. b Two tailed pearson correlation plot of COL1A1 expression in the same samples (*p = 0.0116; r = 0.79). cj Representative composite images from double immunostaining, and respective quantifications, for: c F-actin/TKS5 (red/green), e F-actin/Cortactin (CTTN; red/green), g F-actin/MMP9 (red/green), h TKS5/MMP9 (green/red). Cells are counterstained with DAPI; scale bars 50 μm; arrows indicate representative podosomes; separate images and proof of colocalization of signals can be found at Supplementary Fig. 5. d, f. Quantification of the number of podosome-containing cells per optical field (n = 6); statistical significance was assessed with two-tailed t-test; **p = 0.0011, ***p = 0.0009. i Representative images of the TGFβ-induced degradation (black holes) of a fluorescein-conjugated gelatin substrate. j Quantification of gelatin degradation area, normalized to control (n = 5); statistical significance was assessed with two-tailed t-test; **p = 0.0016. Source data for all relative panels (a, b, d, f, j) are provided as a Source Data file.
Fig. 3
Fig. 3. The formation of extracellular matrix (ECM) degrading podosome rosettes is an inherent property of IPF human lung fibroblasts (HLFs).
Serum starved, sub-confluent (70-80%), primary IPF-HLFs and normal HLFs (NHLFs) were immunostained for F-actin (red) and (a) TKS5 (green) or (c) cortactin (CTTN; green) and counter stained with DAPI (blue); n = 5; scale bars = 50  μm. Representative images from representative clones are shown. b, d Cumulative quantification of the number of podosome-containing cells (%) and the number of podosomes per cell per optical field respectively. Statistical significance was assessed with two-tailed t-test (b) or two-tailed Welch’s test (d) (****p < 0.0001). e The same clones were cultured on a fluorescein-conjugated gelatin substrate (green) and were stained for F-actin (red) and counter stained with DAPI (blue); representative images are shown. f Quantification of the percentage of the degraded gelatin for all clones cumulatively, and the quantification of gelatin degradation area per cell, as quantified with ImageJ; statistical significance was assessed with two-tailed t-test; ***p = 0.0001/**p = 0.0020; additional clones and controls are shown at Supplementary Fig. 6. In all panels all samples are biologically independent; boxplots visualize the median of each distribution; upper/lower hinges represent 1st/3rd quartiles; whiskers extend no further than 1.5 *IQR from the respective hinge. Source data for all relative panels (b, d, f) are provided as a Source Data file.
Fig. 4
Fig. 4. Tks5 haploinsufficiency in mice attenuates bleomycin (BLM)-induced pulmonary fibrosis (PF).
a Schematic presentation of the BLM-induced PF model. b. Kaplan Meyer survival curve post BLM administration. c. Weight change post BLM administration; n = 4/7/4/6. Statistical significance was assessed with two-tailed one-way ANOVA; **p = 0.031. d Total protein concentration in bronchoalveolar lavage fluids (BALFs), as determined with the Bradford assay; n = 4/7/4/7. Statistical significance was assessed with two-tailed one-way ANOVA; ****p < 0.0001, ***p = 0.0009. e Inflammatory cell numbers in BALFs, as counted with a hematocytometer; n = 4/6/4/6. Statistical significance was assessed with two-tailed one-way ANOVA; ****p < 0.0001, ***p = 0.0002/0.0008. f Soluble collagen levels in the BALFs were detected with the direct red assay; n = 4/6/4/7. Statistical significance was assessed with two-tailed Kruskal Wallis; *p = 0.0124. g, h Tks5 and Col1a1 mRNA expression was interrogated with Q-RT-PCR; n = 4/5/3/7; values were normalized over the expression of the housekeeping gene B2m and presented as fold change over control. Statistical significance was assessed with two-tailed one-way ANOVA; **p = 0.0012, *p = 0.0207. h Two tailed pearson correlation plot of Col1a1 expression in the same samples; *p = 0.0342; r = 0.91/0.54. i Representative images from lung sections of murine lungs of the indicated genotypes, stained with Fast Green/Sirius Red (green/red; first row), from Hematoxylin & Eosin (H&E)-stained Precision cut lung slices (PCLS) (second row) and H&E-stained lung sections (third row); scale bars 50 μm. j. Quantification of fibrosis severity in H/E stained lung sections via Ashcroft scoring; n = 4/5/4/5. Statistical significance was assessed with two-tailed one-way ANOVA; ****p < 0.0001. k Rrs, mean respiratory system resistance as measured with Flexivent; n = 4/6/4/6. Statistical significance was assessed with two-tailed one-way ANOVA; ***p = 0.0008/0.0004. l Ers, mean respiratory system elastance as measured with Flexivent; n = 4/6/4/5. Statistical significance was assessed with two-tailed one-way ANOVA; ***p = 0.0002, **p = 0.0081. m Cst, mean static lung compliance as measured with Flexivent; n = 4/7/4/6. Statistical significance was assessed with two-tailed one-way ANOVA followed by Welch’s correction; ****p < 0.0001. In all panels cumulative results from 2 different experiments are shown; all samples are biologically independent; boxplots visualize the median of each distribution; upper/lower hinges represent 1st/3rd quartiles; whiskers extend no further than 1.5 *IQR from the respective hinge. Source data for all relative panels (ah, jm) are provided as a Source Data file.
Fig. 5
Fig. 5. Tks5 haploinsufficiency in mouse lung fibroblasts (LFs) decreases podosome formation and extracellular matrix (ECM) invasion.
Serum starved primary normal mouse LFs (NMLFs) from WT and Tks5+/- mice were stimulated with recombinant TGF-β1 (10 ng/ml for 24 h). a Tks5 mRNA expression was interrogated with Q-RT-PCR; n = 6/4/4/9. Values were normalized over the expression of the housekeeping gene B2m and presented as fold change over control. Statistical significance was assessed with two-tailed one-way ANOVA; *p = 0.0464, ****p < 0.0001. b Representative composite images from double immunostaining for F-actin (red) and Cortactin (Cttn; green) counter stained with DAPI (blue); arrows indicate representative podosomes. c Quantification of the number of podosome-containing cells per optical field; n = 5. Statistical significance was assessed with two-tailed one-way ANOVA followed by Welch’s correction; *p = 0.004/0.0053 *p = 0.0411. d TGFβ-induced NMLFs proliferation was assessed with the MTT assay; n = 6. Statistical significance was assessed with two-tailed one-way ANOVA; ****p < 0.0001. e Schematic presentation (biorender.com) of LFs invasion into aECM, upon TGFB stimulation. After 6 h, cells that had invaded into the lower surface of the upper chamber were stained, lysed and absorbance values were measured. f Invasion capacity of NMLFs, upon TGF-β stimulation (n = 4), as detected with the transwell invasion assay. Statistical significance was assessed with two-tailed one-way ANOVA; ****p < 0.0001, *p = 0.0266, ***p = 0.0005. g Representative composite images from double immunostaining for F-actin (red) and Tks5 (green) in NMLFs isolated from WT and Tks5+/- mice, post bleomycin (BLM) administration; arrows indicate representative podosomes; scale bars 50 μm. h Quantification of the number of podosome-containing cells per optical field (n = 5). Statistical significance was assessed with two-tailed t-test; **p = 0.009. i Invasion capacity of LFs post BLM, as detected with the transwell invasion assay; n = 4. Statistical significance was assessed with two-tailed one-way ANOVA; ***p = 0.0003 **p = 0.0099. In all panels, all samples are biologically independent; boxplots visualize the median of each distribution; upper/lower hinges represent 1st/3rd quartiles; whiskers extend no further than 1.5 *IQR from the respective hinge. Source data for all panels are provided as a Source Data file.
Fig. 6
Fig. 6. Tks5 haploinsufficiency in mouse lung fibroblasts (LFs) disrupts extracellular matric (ECM) homeostasis, that critically controls podosome formation and ECM invasion.
a ECM-related gene ontology components are enriched for genes down-regulated in TGFβ stimulated Tks5+/- LFs compared to their WT TGFβ treated counterparts. Gene-set enrichment analysis (GSEA) on expression data pre-ranked according to their fold change values. b Collagen containing extracellular matrix is the term most enriched in down-regulated genes according to gene-set enrichment analysis (GSEA). c Serum starved WT and Tks5+/- LFs were immunostained for Col1a1 (green) and counter stained with DAPI (blue). Representative images are shown; scale bars = 50 μm. d, e Serum starved WT primary LFs were cultured in post saline (pSAL) and post bleomycin (pBLM) aECM. Tks5 and Col1a1 mRNA expression was interrogated with Q-RT-PCR; n = 4; values were normalized over the expression of the housekeeping gene B2m and presented as fold change over control. Statistical significance was assessed with two-tailed Mann-Whitney test; *p = 0.0286. e Two tailed pearson correlation plot of Col1a1 expression in the same samples; ***p = 0.0004, r = 0.99. f, g Representative composite images from double immunostaining for F-actin (red) and Cortacin (Cttn; green; f) or Col1a1 (g; green) counter stained with DAPI (blue); arrows indicate representative podosomes; scale bars = 50 μm. In all panels, representative experiment out of 2 successful independent ones are shown; all samples are biologically independent; boxplots visualize the median of each distribution; upper/lower hinges represent 1st/3rd quartiles; whiskers extend no further than 1.5 *IQR from the respective hinge. Source data for all panels are provided as a Source Data file.
Fig. 7
Fig. 7. Src-inhibition potently reduces podosome formation, extracellular matrix (ECM) invasion and attenuates pulmonary fibrosis.
Serum starved, primary normal human lung fibroblasts (NHLFs) were pretreated for 1 h with A-419259 (SRC inhibitor) and Nintedanib, and then stimulated with recombinant human TGFβ (10 ng/ml) for 24 h. a Graphical representation of connectivity (CMap) analysis using LINCS1000 resource of the TGFβ-induced TKS5+/- expression profile. b, c TKS5 and COL1A1 mRNA expression was interrogated with Q-RT-PCR. Values were normalized to the expression values of the housekeeping gene B2M and presented as fold change over control; n = 3/3/3/3. Statistical significance was assessed with two-tailed one-way ANOVA; ***p = 0.0008, *p = 0.0397/0.0107 **p = 0.003. c Two tailed Pearson correlation plot of COL1A1 reduction in the same samples (*p = 0.0202, r = 0.84). d, e TKS5 and COL1A1 mRNA expression was interrogated with Q-RT-PCR. Values were normalized over the expression values of the housekeeping gene B2M and presented as fold change over control; n = 3/5/6/5. Statistical significance was assessed with two-tailed one-way ANOVA; *p = 0.0202, ****p < 0.0001. e Two tailed spearman correlation plot of COL1A1 reduction in the same samples; **p = 0.0018, r = 0.85. f Representative composite images from double immunostaining for F-actin (red) and Cortactin (cttn; green) counter stained with DAPI (blue); arrows indicate representative podosomes; scale bars = 50 μm. g Quantification of the number of podosome-containing cells per optical field; n = 5. Statistical significance was assessed with two-tailed one-way ANOVA; ****p < 0.0001, ***p = 0.0006, **p = 0.0014. h Invasion capacity of NHLFs (n = 4), upon A-419259 pretreatment and TGF-β stimulation, as detected with the transwell invasion assay; n = 4. Statistical significance was assessed with two-tailed one-way ANOVA; *p = 0.0294). i Src-inhibition attenuates pulmonary fibrosis in mouse precision cut lung slices (PCLS) generated post BLM (d11) administration. Treatment with A-419259, was administered in the first 24 h after slicing for 3 consecutive days. Representative images from PCLS stained with H&E, Fast green/Sirius red (F.G./S/R.; green/red) and from double immunostaining for Tks5 and Col1a1 (green/red) are shown; scale bars=50 μm. In all panels, representative experiment out of 2 successful independent ones are shown. In all panels, all samples are biologically independent; boxplots visualize the median of each distribution; upper/lower hinges represent 1st/3rd quartiles; whiskers extend no further than 1.5 *IQR from the respective hinge. Source data for all panels are provided as a Source Data file.
Fig. 8
Fig. 8. Src inhibition attenuates bleomycin (BLM)-induced pulmonary fibrosis.
a Schematic representation (biorender.com) of the BLM model and drug administration; n = 5. b Kaplan Meyer survival curve post BLM administration. c Weight change post BLM administration. d Total protein concentration in bronchoalveolar lavage fluids (BALFs), as determined with the Bradford assay. Statistical significance was assessed with two-tailed one-way ANOVA; ****p < 0.0001, ***p = 0.0001. e Inflammatory cell numbers in BALFs, as counted with a hematocytometer. Statistical significance was assessed with two-tailed one-way ANOVA; ****p < 0.0001, *p = 0.0115. f Soluble collagen levels in the BALFs were detected with the direct red assay. Statistical significance was assessed with two-tailed one-way ANOVA; ***p = 0.0004, *p = 0.0473. g Col1a1 mRNA expression was interrogated with Q-RT-PCR. Values were normalized over the expression of the housekeeping gene B2m and presented as fold change over control. Statistical significance was assessed with two-tailed Kruskal Wallis; **p = 0.0094. h Quantification of fibrosis severity in Hematoxylin & Eosin (H/E) stained lung sections via Ashcroft scoring. Statistical significance was assessed with two-tailed one-way ANOVA; ****p < 0.0001, **p = 0.0028/0.0074. i Representative images from lung sections of murine lungs of the indicated genotypes, stained with Fast Green/Sirius Red (F.G/S.R; green/red) and H&E; scale bars = 50 μm. In all panels, all samples are biologically independent; boxplots visualize the median of each distribution; upper/lower hinges represent 1st/3rd quartiles; whiskers extend no further than 1.5 *IQR from the respective hinge. Source data for all panels are provided as a Source Data file.

Similar articles

Cited by

References

    1. Rockey DC, Bell PD, Hill JA. Fibrosis — a common pathway to organ injury and failure. N. Engl. J. Med. 2015;372:1138–1149. - PubMed
    1. Raghu G, et al. Diagnosis of idiopathic pulmonary fibrosis. An Official ATS/ERS/JRS/ALAT Clinical Practice Guideline. Am. J. Respir. Crit. Care Med. 2018;198:e44–e68. - PubMed
    1. Martinez FJ, et al. Idiopathic pulmonary fibrosis. Nat. Rev. Dis. Prim. 2017;3:17074. - PubMed
    1. Plikus MV, et al. Fibroblasts: Origins, definitions, and functions in health and disease. Cell. 2021;184:3852–3872. - PMC - PubMed
    1. Tomasek JJ, Gabbiani G, Hinz B, Chaponnier C, Brown RA. Myofibroblasts and mechano-regulation of connective tissue remodelling. Nat. Rev. Mol. Cell Biol. 2002;3:349–363. - PubMed

Publication types

Substances