. 2024 Jan;70(1):63-77.
doi: 10.1165/rcmb.2023-0245OC.

Prenatal FGFR2 Signaling via PI3K/AKT Specifies the PDGFRA+ Myofibroblast

Affiliations

Prenatal FGFR2 Signaling via PI3K/AKT Specifies the PDGFRA+ Myofibroblast

Matthew R Riccetti et al. Am J Respir Cell Mol Biol. 2024 Jan.

Abstract

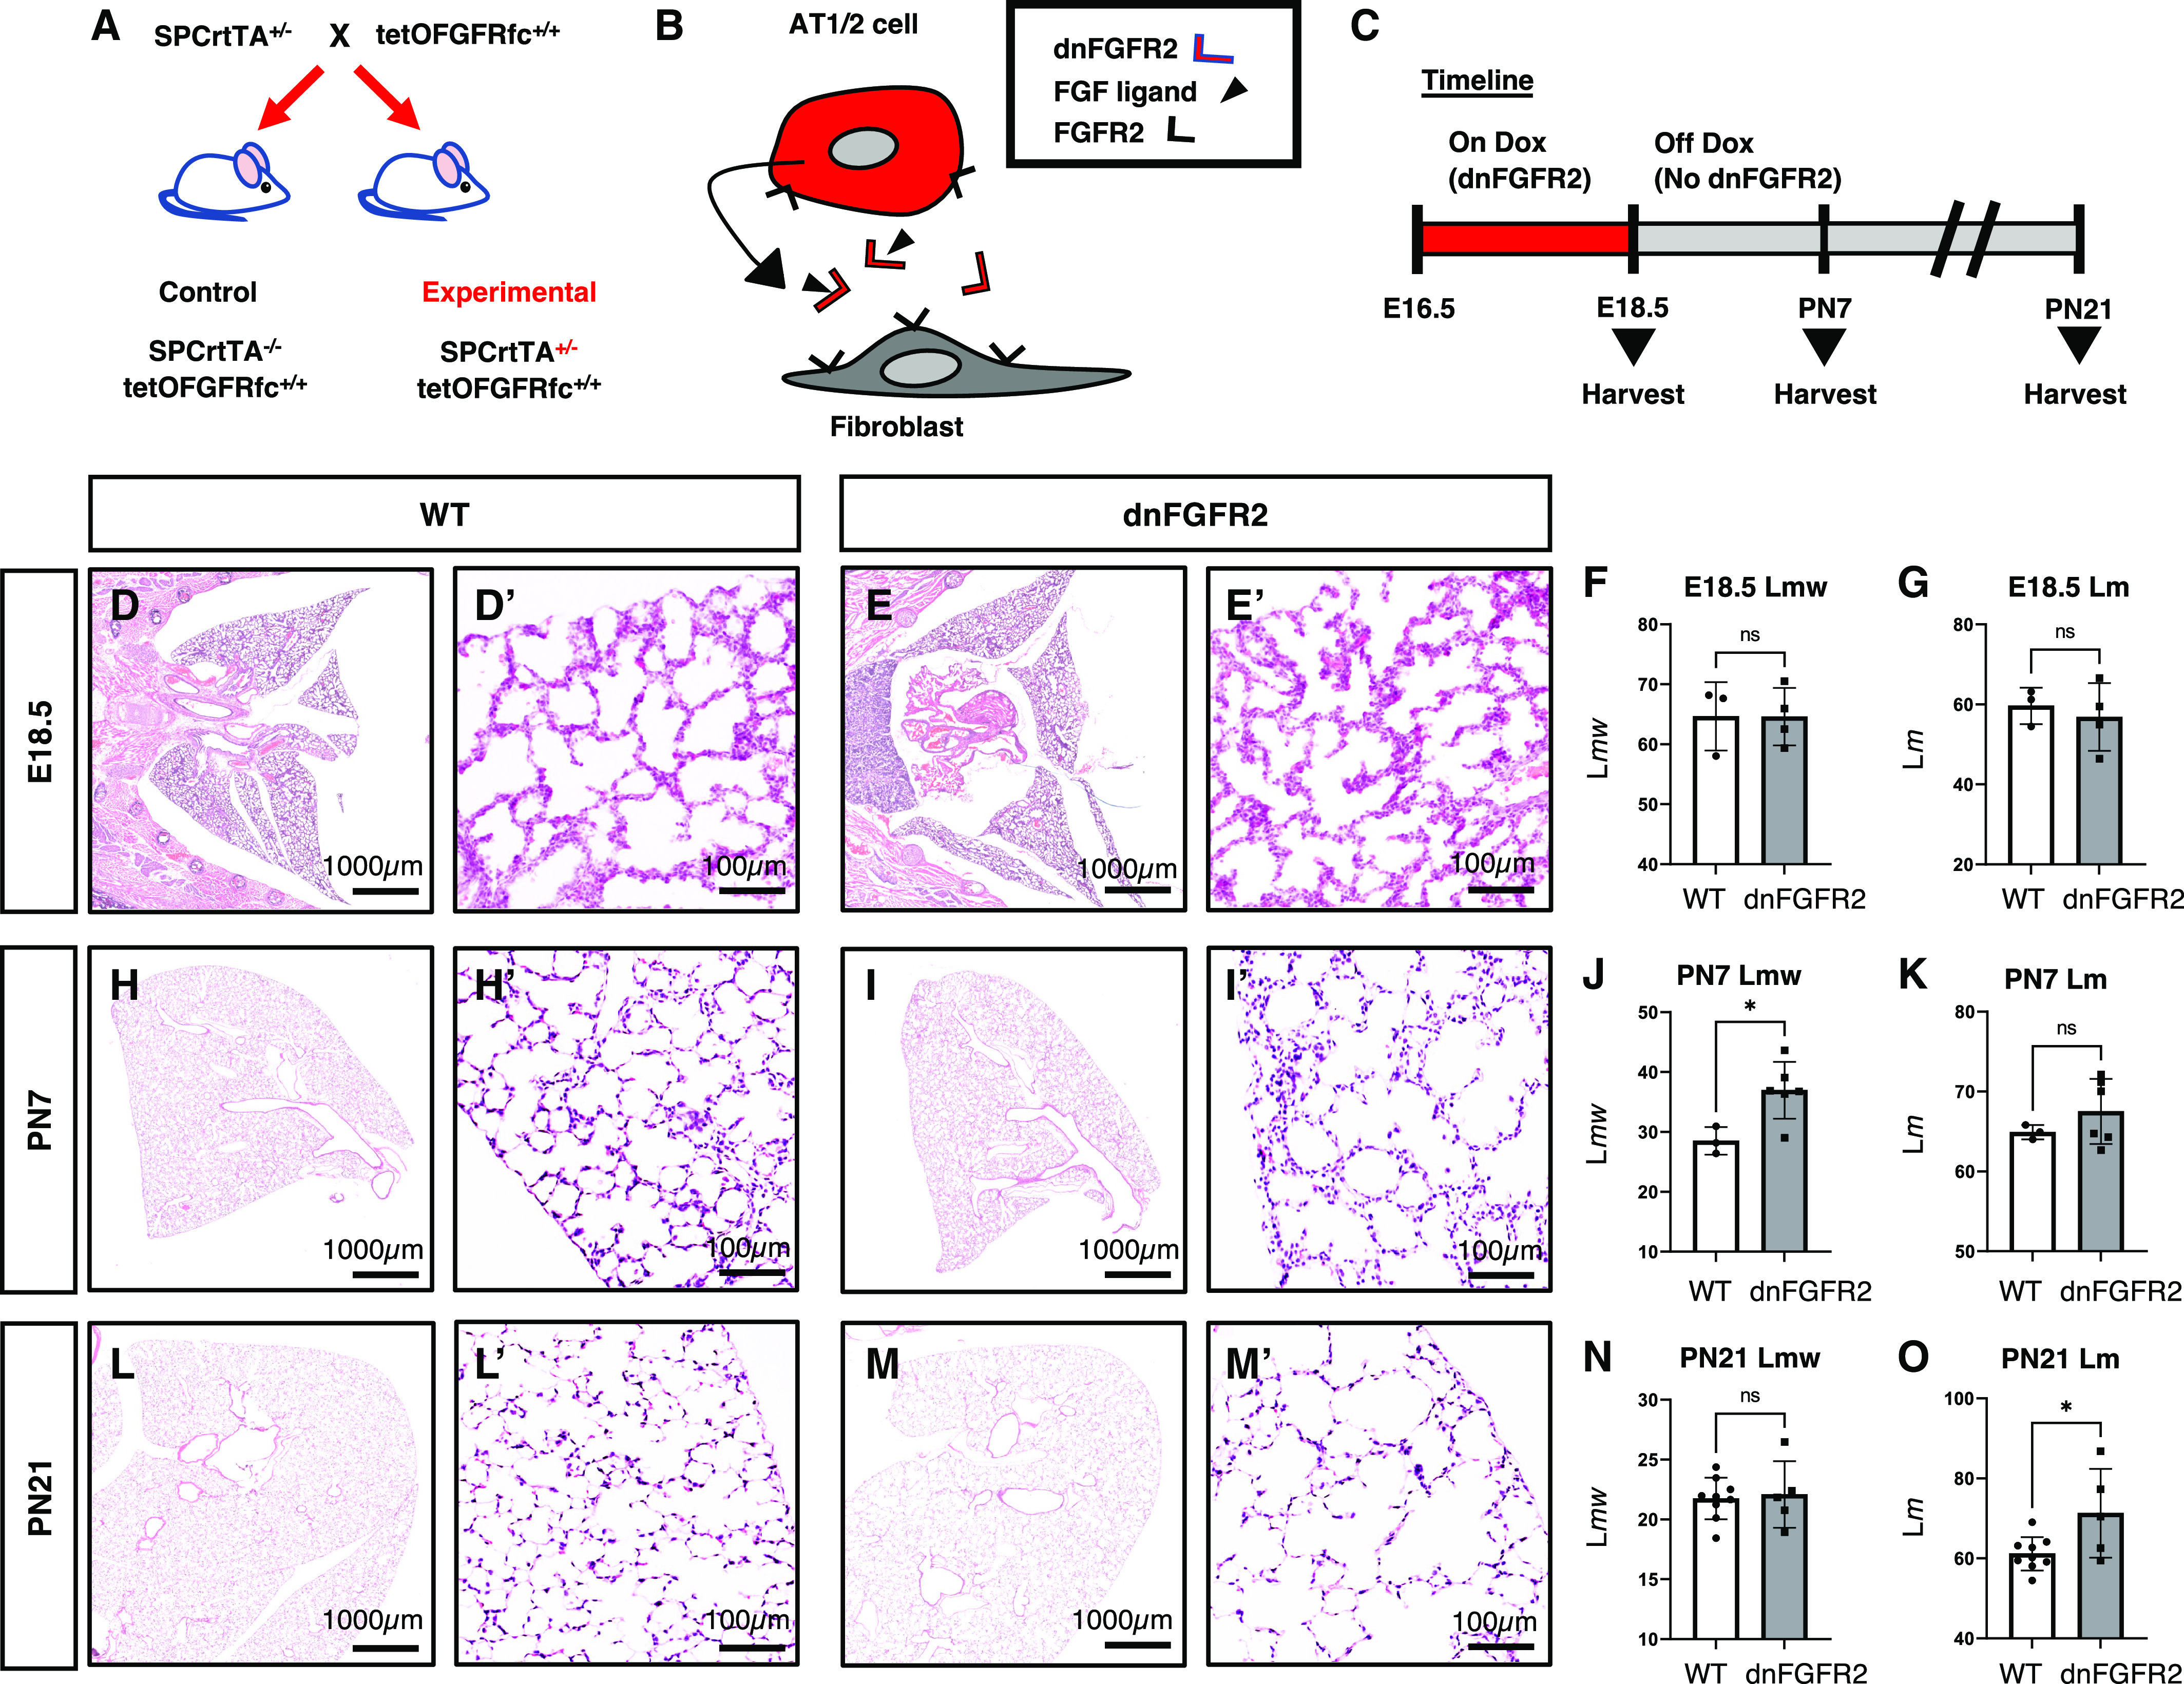
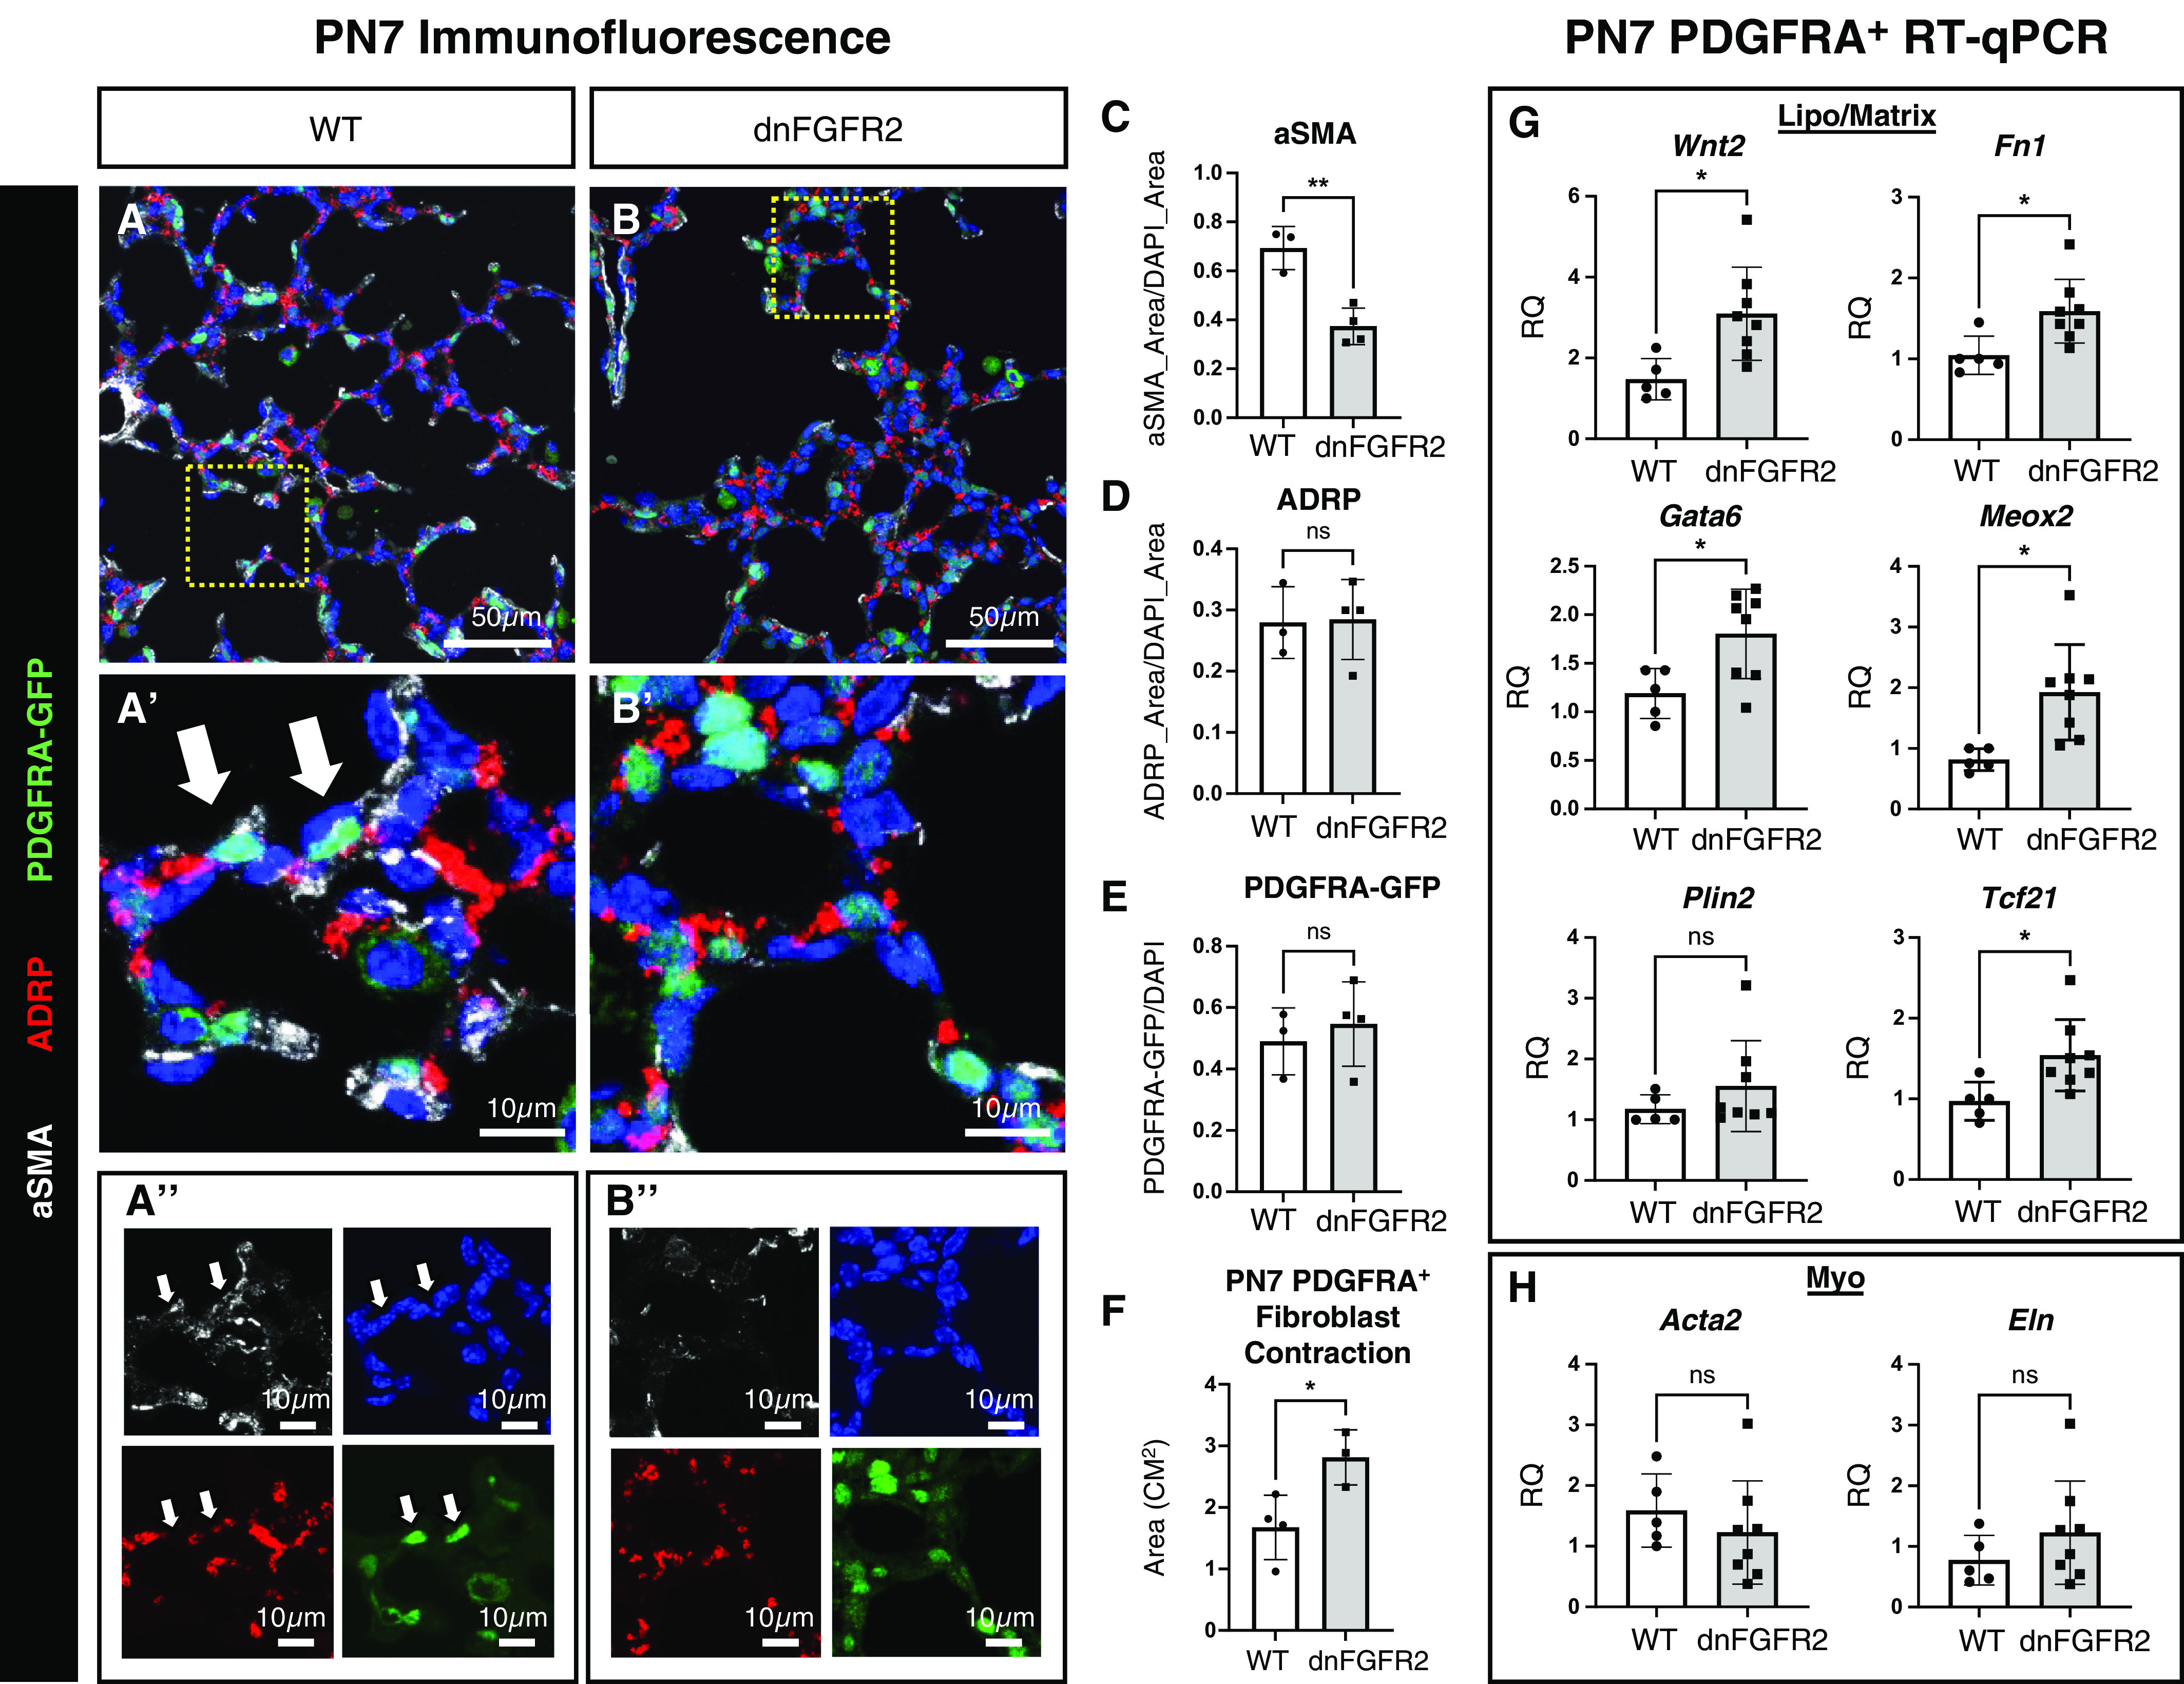
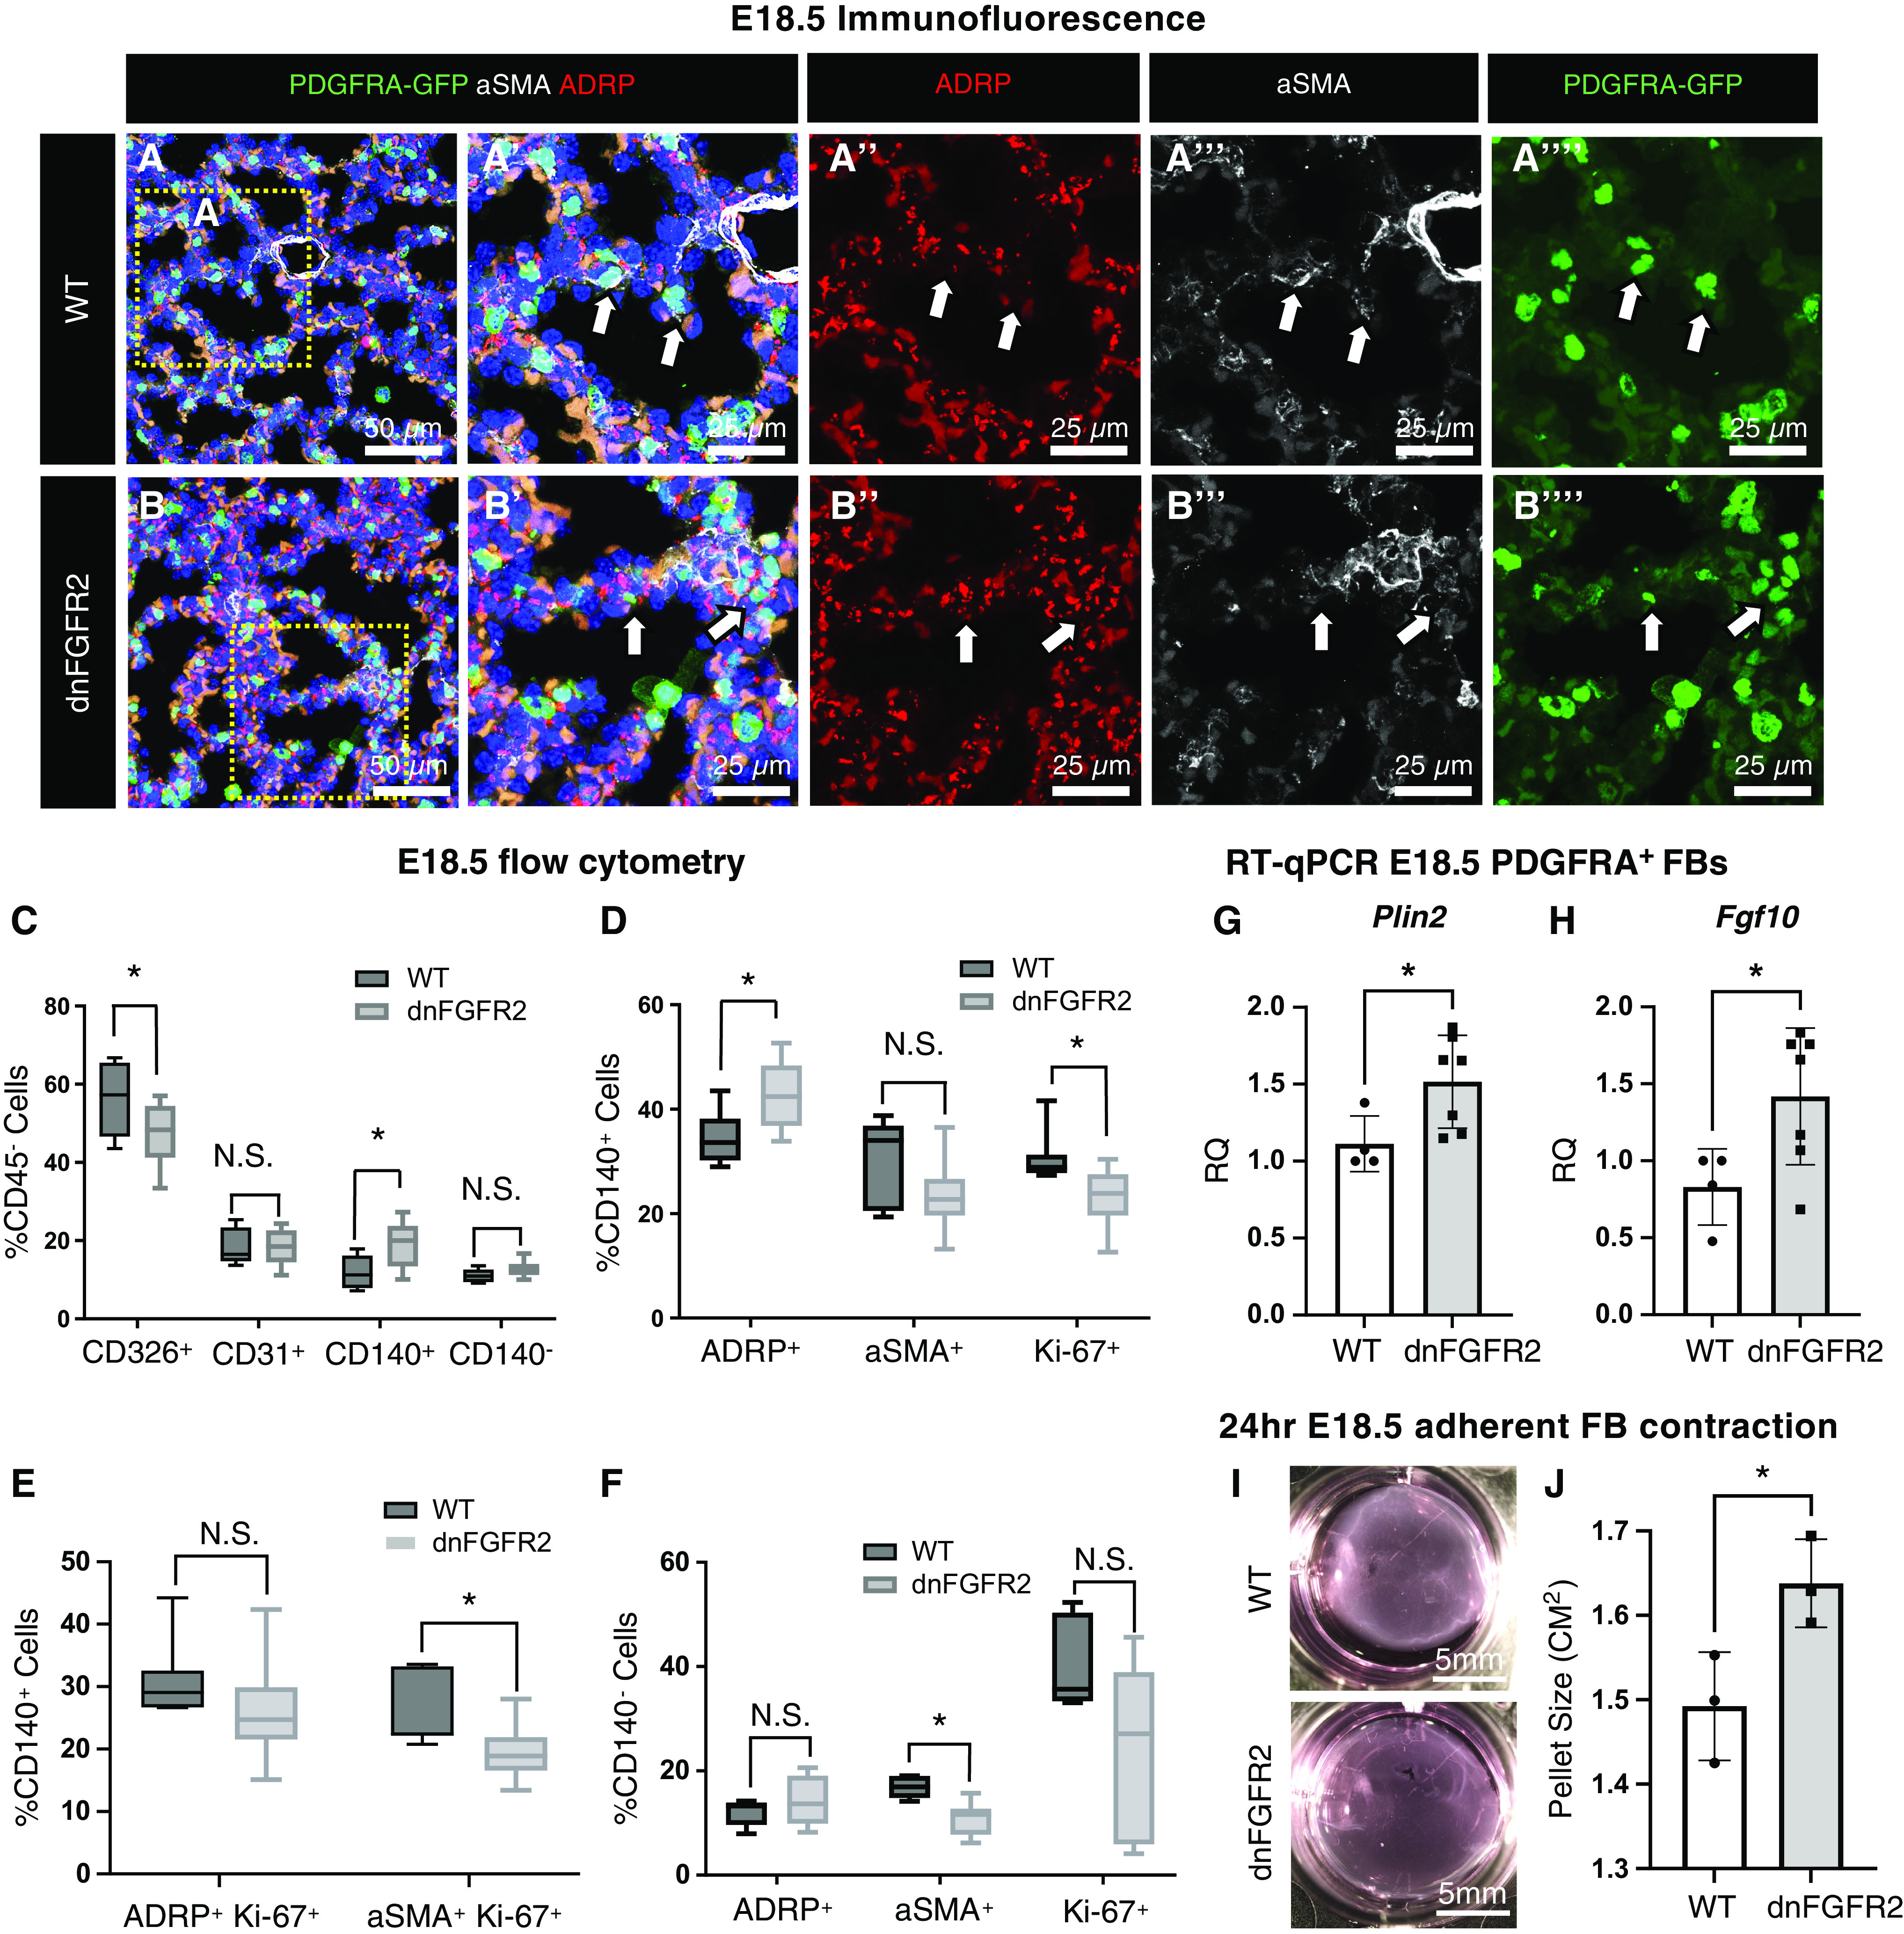
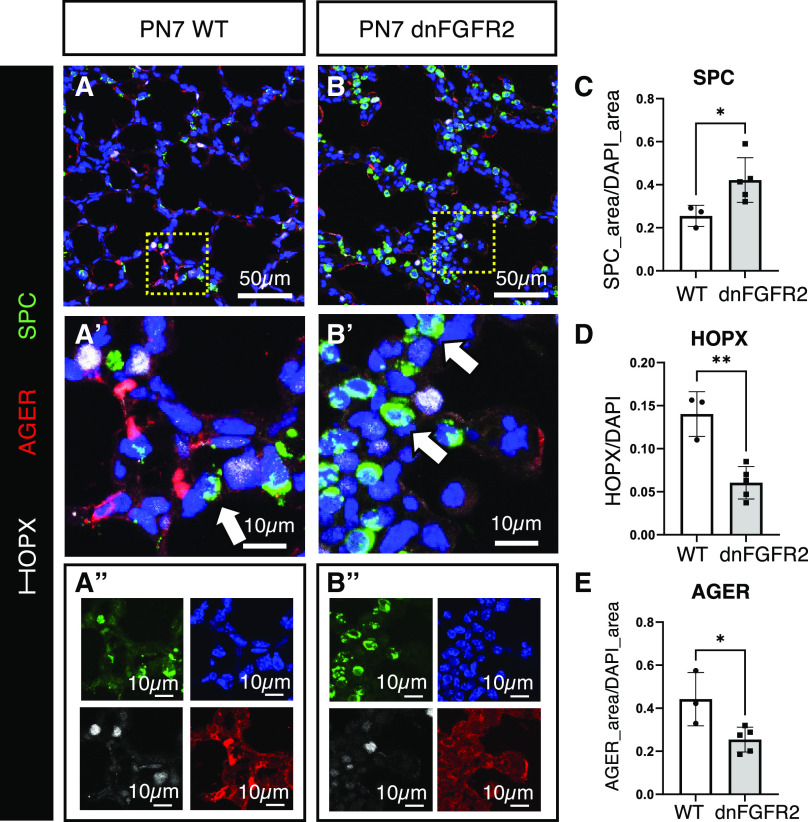
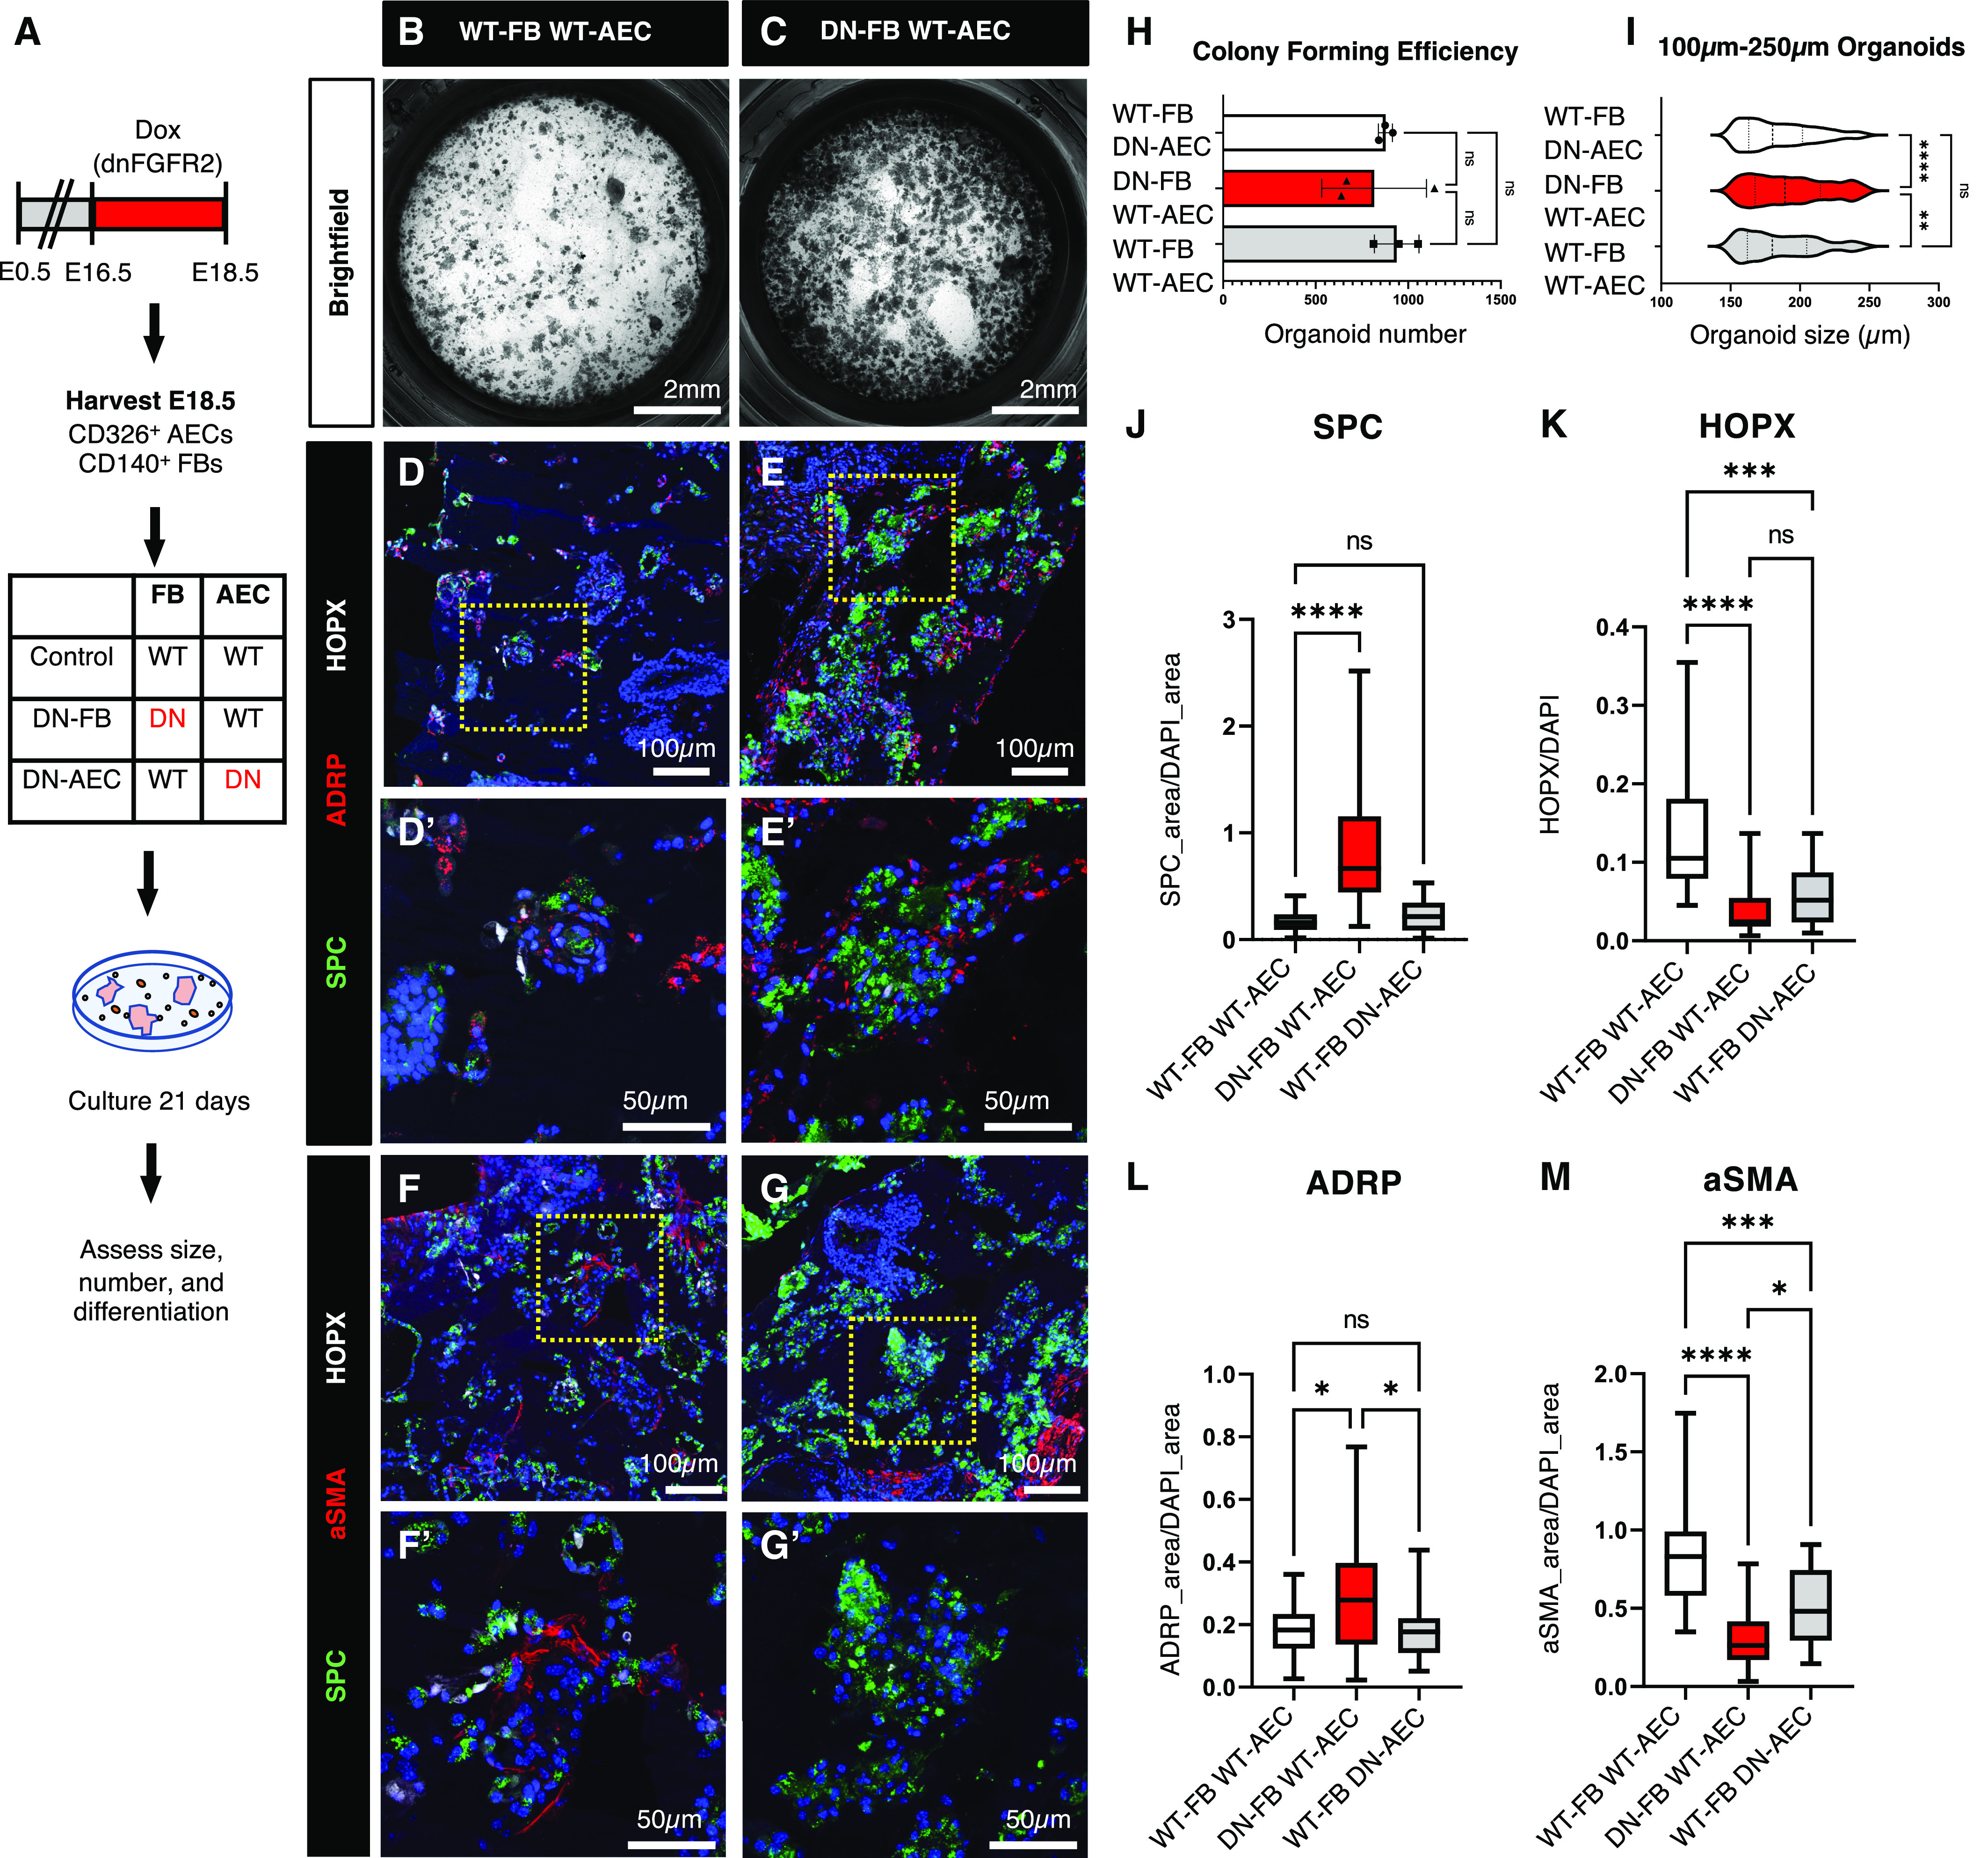
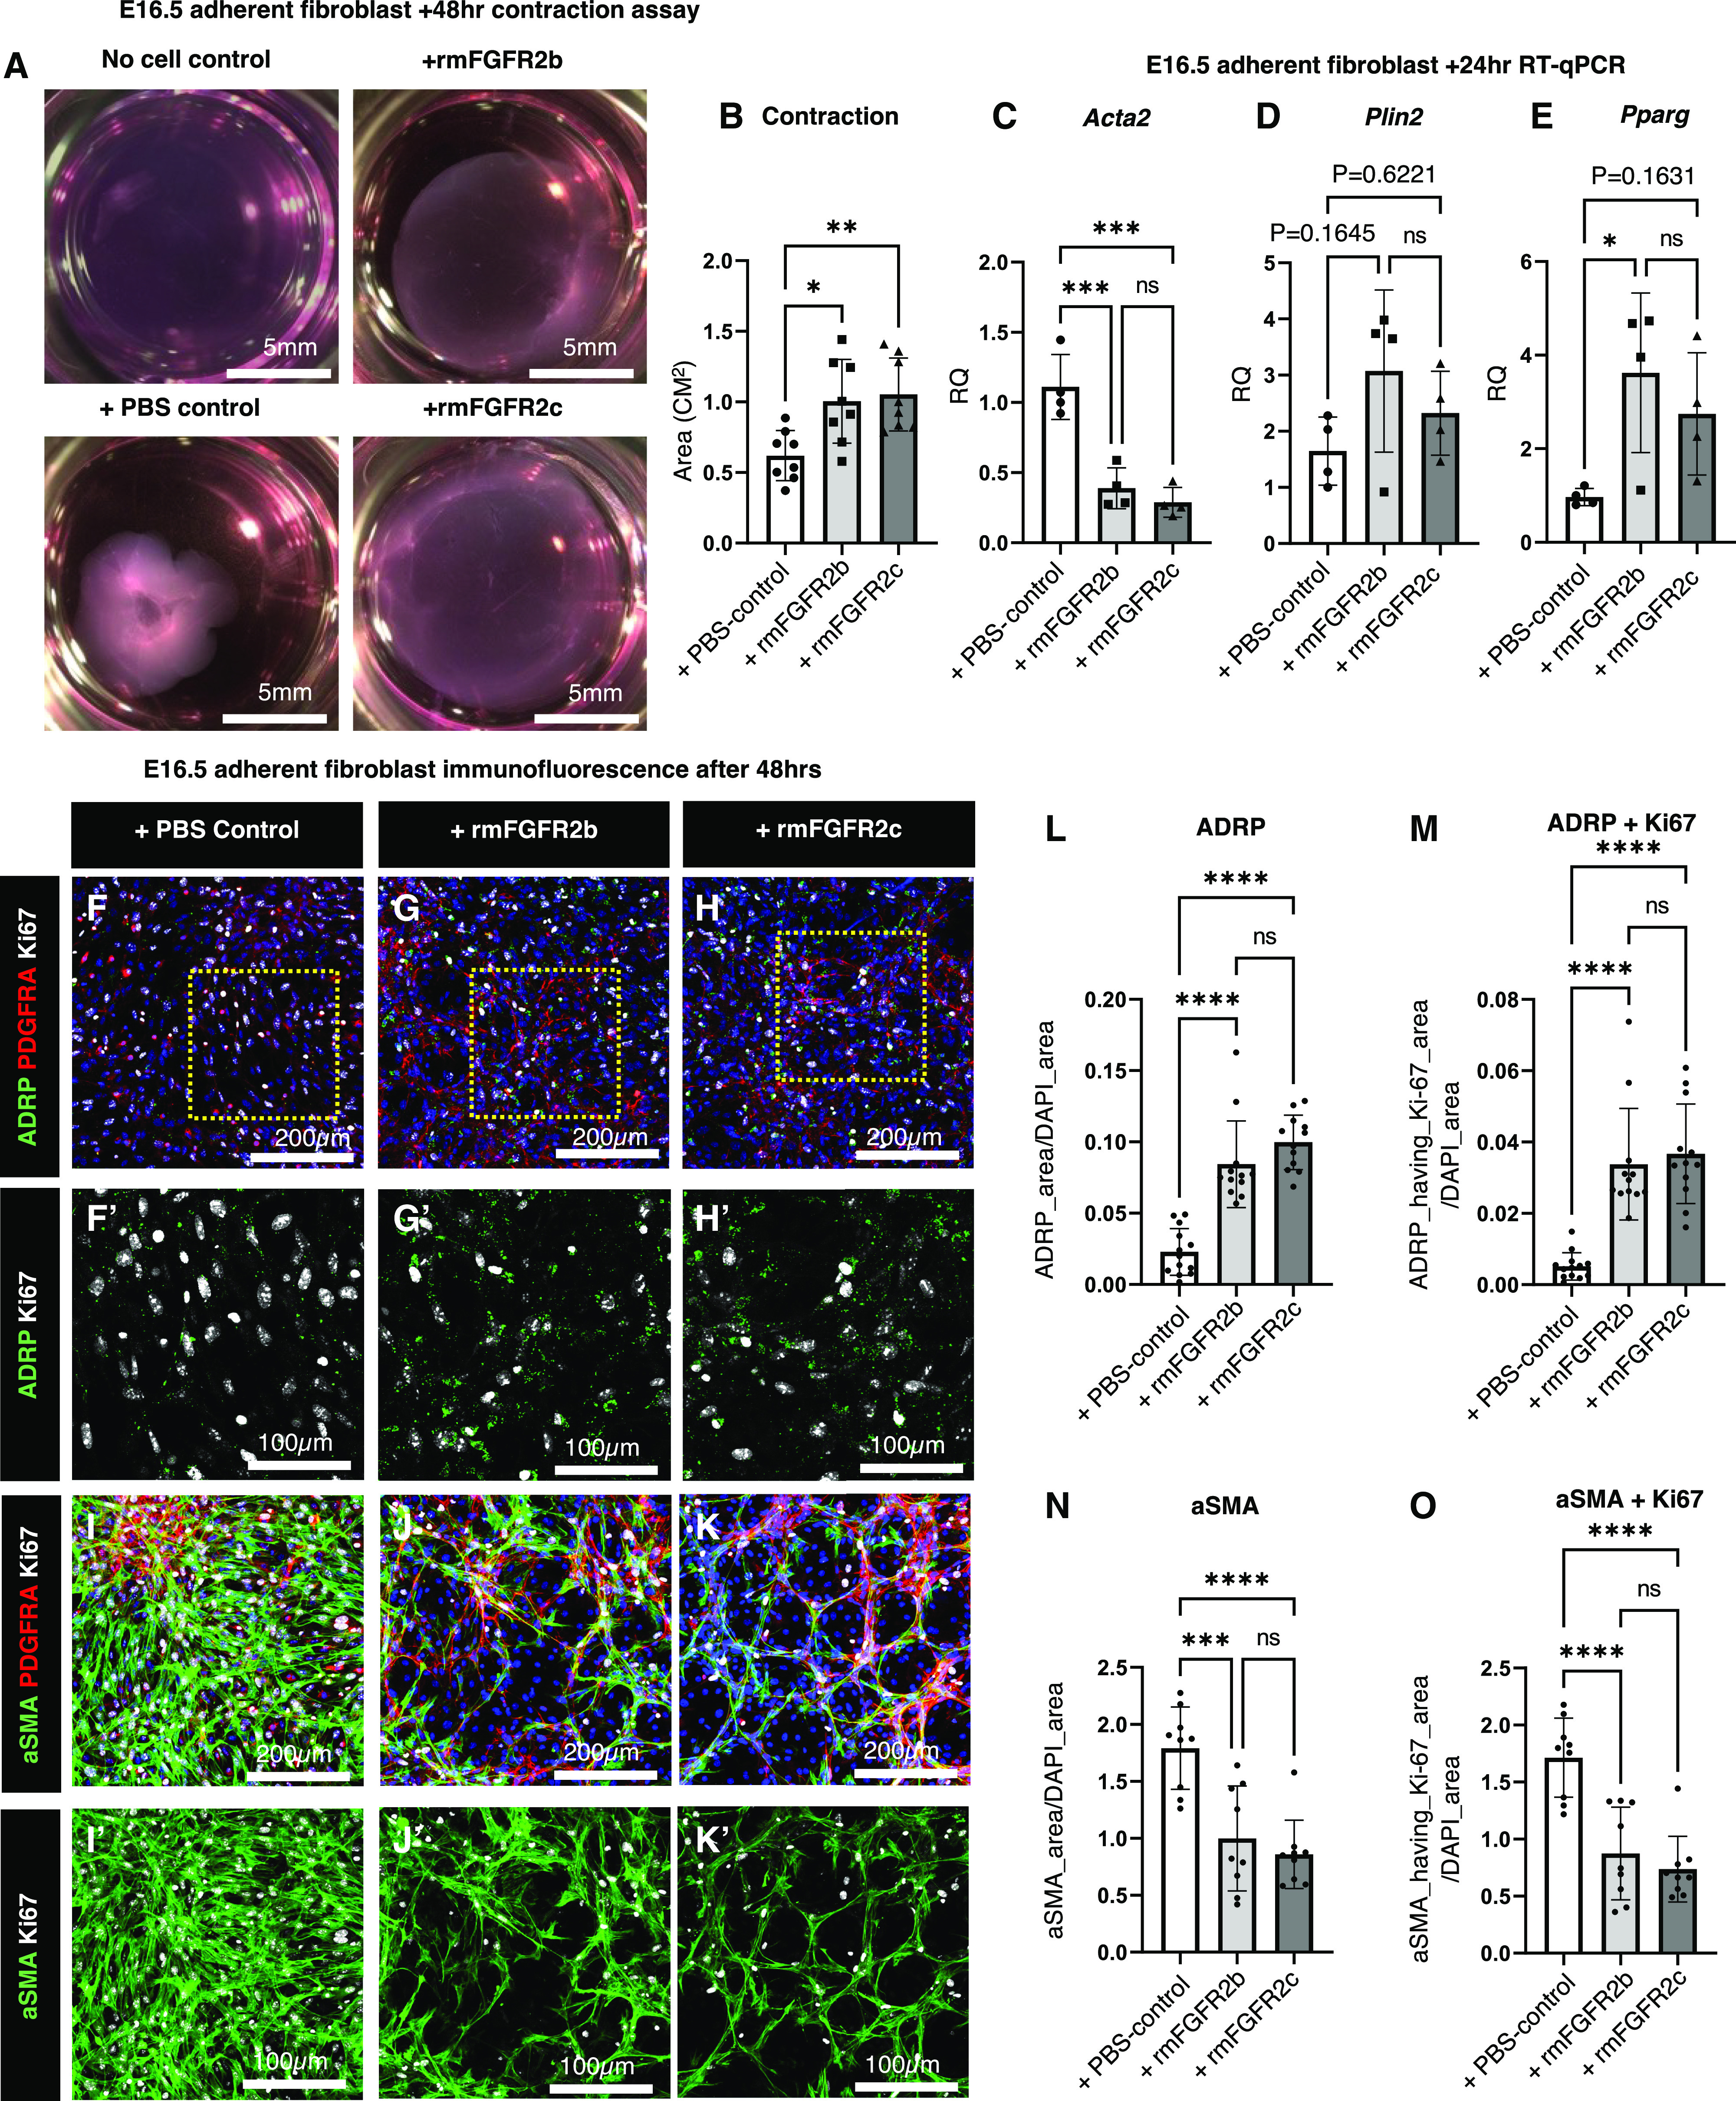
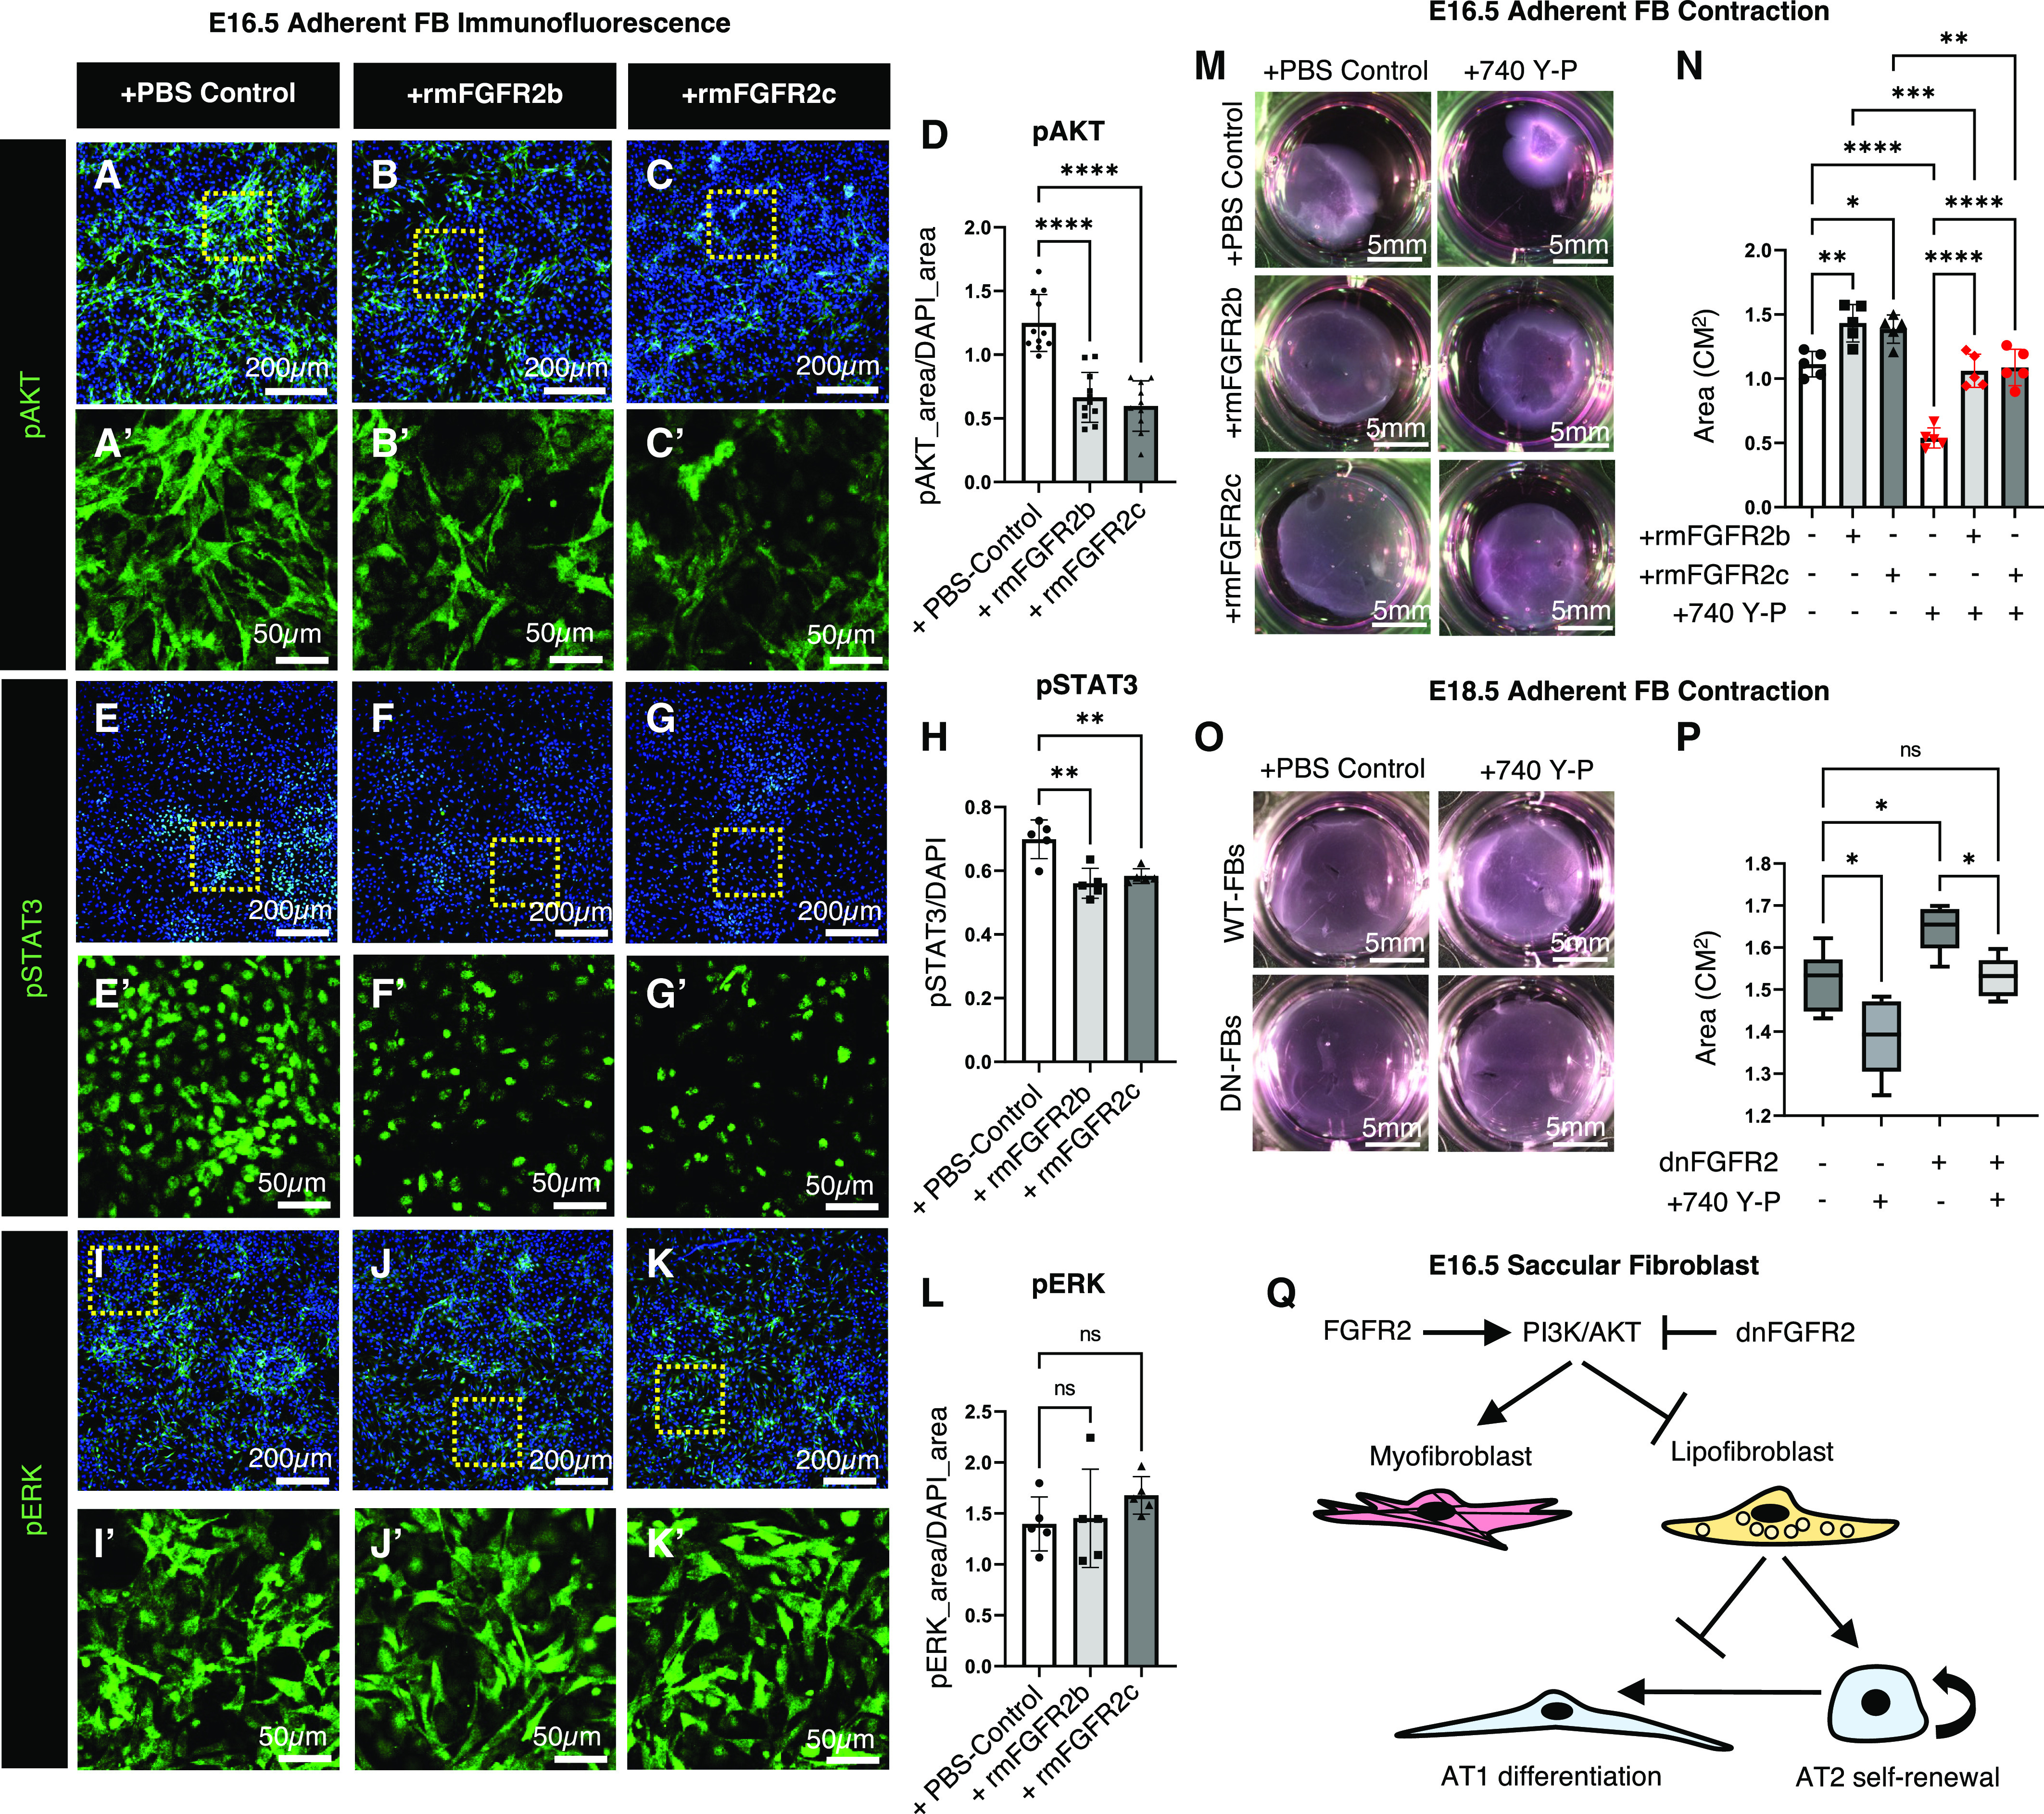
It is well known that FGFR2 (fibroblast growth factor receptor 2) signaling is critical for proper lung development. Recent studies demonstrate that epithelial FGFR2 signaling during the saccular phase of lung development (sacculation) regulates alveolar type 1 (AT1) and AT2 cell differentiation. During sacculation, PDGFRA (platelet-derived growth factor receptor-α)-positive lung fibroblasts exist as three functional subtypes: contractile myofibroblasts, extracellular matrix-producing matrix fibroblasts, and lipofibroblasts. All three subtypes are required during alveolarization to establish a niche that supports AT2 epithelial cell self-renewal and AT1 epithelial cell differentiation. FGFR2 signaling directs myofibroblast differentiation in PDGFRA+ fibroblasts during alveolar reseptation after pneumonectomy. However, it remains unknown if FGFR2 signaling regulates PDGFRA+ myo-, matrix, or lipofibroblast differentiation during sacculation. In this study, FGFR2 signaling was inhibited by temporal expression of a secreted dominant-negative FGFR2b (dnFGFR2) by AT2 cells from embryonic day (E) 16.5 to E18.5. Fibroblast and epithelial differentiation were analyzed at E18.5 and postnatal days 7 and 21. At all time points, the number of myofibroblasts was reduced and the number of lipo-/matrix fibroblasts was increased. AT2 cells are increased and AT1 cells are reduced postnatally, but not at E18.5. Similarly, in organoids made with PDGFRA+ fibroblasts from dnFGFR2 lungs, increased AT2 cells and reduced AT1 cells were observed. In vitro treatment of primary wild-type E16.5 adherent saccular lung fibroblasts with recombinant dnFGFR2b/c resulted in reduced myofibroblast contraction. Treatment with the PI3K/AKT activator 740 Y-P rescued the lack of myofibroblast differentiation caused by dnFGFR2b/2c. Moreover, treatment with the PI3K/AKT activator 740 Y-P rescued myofibroblast differentiation in E18.5 fibroblasts isolated from dnFGFR2 lungs.

Keywords: alveolar niche; lipofibroblast; lung development; matrix fibroblast; sacculation.


Figures

Figure 1.
Figure 1.
Prenatal inhibition of FGFR2 (fibroblast growth factor receptor 2) signaling results in postnatal alveolar simplification. (A) Breeding scheme for SPCrtTA;tetOFGFRfc mice: tetOFGFRfc bred as homozygous with a heterozygous SPCrtTA mouse, giving 50% SPCrtTA−/− tetOFGFRfc+/+ and 50% SPCrtTA+/− tetOFGFRfc+/+ offspring. (B) The tetOFGFRfc (dominant-negative FGFR2b [dnFGFR2]) construct lacks the FGFR2b transmembrane domain and is thus secreted as an extracellular receptor that acts as a sink for FGF ligands, draining the distal lung of FGF signaling. (C) The doxycycline treatment and harvest timeline used in this study. (D–E′, H–I′, and L–M′) Hematoxylin and eosin–stained images of distal lung of wild-type (WT) and dnFGFR embryonic day (E) 18.5 (D–E′), postnatal day (PN) 7 (H–I′), and PN21 (L–M′) mice that were given doxycycline from E16.5 to E18.5. Scale bars: tile scans, 1,000 μm; inset, 100 μm. (F, J, and N) Morphometric quantification of mean transsectional wall lengths at E18.5, PN7, and PN21. (G, K, and O) Morphometric quantification of mean linear intercept of E18.5, PN7, and PN21 WT and dnFGFR lungs (n ⩾ 3 mice per group). Two-tailed Student’s t test: *P < 0.05. Dox = doxycycline; Lm = mean linear intercept; Lmw = mean transsectional wall length, ns = not significant.
Figure 2.
Figure 2.
Prenatal inhibition of FGFR2 signaling results in postnatal loss of secondary crest myofibroblasts and gain of matrix/lipofibroblasts at PN7. (A–H) “WT” and “dnFGFR2” refer to WT and experimental littermate mice exposed to dnFGFR2 at E16.5–E18.5 and harvested at PN7, respectively. (A–B′′) Immunofluorescence of α-smooth muscle actin (aSMA; white), adipose differentiation-related protein (ADRP) (red), and platelet-derived growth factor receptor-α (PDGFRA)–GFP (green) in PN7 WT and dnFGFR2 lungs. Scale bars: 50 μm; inset, 10 μm. White arrows point to PDGFRA+/aSMA+ myofibroblasts. (C–E) Quantification of aSMA area over DAPI area, ADRP area over DAPI area, and PDGFRA-GFP bright spot over DAPI bright spot in PN7 WT and dnFGFR lungs (n = 3–4 mice; two-tailed Student’s t test **P < 0.01; error bars display SD). (F) Collagen contraction assay of magnetic-activated cell sorting (MACS)–isolated PDGFRA+ fibroblasts from PN7 WT and dnFGFR2 lungs after 72 hours (n = 3–4 mice; two-tailed Student’s t test **P < 0.01). (G and H) Quantitative reverse transcription PCR (RT-qPCR) of MACS-isolated PDGFRA+ fibroblasts from PN7 WT and dnFGFR2 lungs for matrix fibroblast transcriptional markers Wnt2, Fn1, Gata6, and Meox2; lipofibroblast transcriptional markers Tcf21, and Plin2; and myofibroblast transcriptional markers Acta2, and Eln identified on Lung Gene Expression Analysis/LungMAP (n = 5–8 mice). Relative quantification (RQ) of each gene displayed as bar graphs. Two-tailed Student’s t test: *P < 0.05; error bars display SD.
Figure 3.
Figure 3.
Inhibition of FGFR2 signaling during sacculation causes prenatal expansion of PDGFRA+ lipofibroblasts at E18.5. (A–B′′′′) Immunofluorescence of E18.5 WT and dnFGFR2 lungs stained for PDGFRA-GFP (green) aSMA (white), and ADRP (red). Representative images from four WT and dnFGFR2 animals. In A′–A′′′′, white arrows point to PDGFRA+/aSMA+/ADRP cells. In B′–B′′′′, white arrows point to PDGFRA+/aSMA/ADRP+ cells. Scale bars: 50 μm; inset, 25 μm. (C–F) Flow cytometry of E18.5 WT and dnFGFR2 lungs (n = 7–13 mice). (C) Percentages of EPCAM (CD326+), PECAM-1 (CD31+), PDGFRA (CD140+), and CD140 cells within the PTPRC (CD45) population. (D) Percentages of ADRP+, aSMA+, and Ki-67+ cells within the CD140+ population. (E) Percentages of proliferating lipofibroblasts (Ki-67+/ADRP+) and myofibroblasts (Ki-67+/aSMA+) within the CD140+ population. (F) Percentages of ADRP+, aSMA+, and Ki-67+ cells within the CD140 population. (G and H) RT-qPCR for Plin2 and Fgf10 in WT and dnFGFR2 E18.5 PDGFRA+ fibroblasts isolated by MACS (n = 4–7). (I) Bright-field images of collagen pellets from 24-hour collagen contraction assay on adherent E18.5 WT and dnFGFR2 fibroblasts. Scale bar, 5 mm. (J) Quantification of collagen pellets measured as the area of pellets in cm2 (n = 3 mice). In C–F, G, H, and J, a two-tailed Student’s t test was used: *P < 0.05. Box-and-whisker plot displays IQRs and outliers; dot-plot error bars display SD. FB = fibroblast.
Figure 4.
Figure 4.
Prenatal inhibition of FGFR2 signaling increases the number of AT2 cells at PN7. (A–B′′) Mice were exposed to dnFGFR2 at E16.5–E18.5 and harvested at PN7. Immunofluorescence of HOPX (white), AGER (red), and SPC (green) in PN7 WT and dnFGFR2 lungs. Scale bars: 50 μm; inset, 10 μm. White arrows point to SPC+ AT2 cells. (C–E) Immunofluorescence quantification of SPC area over DAPI area, HOPX bright spot over DAPI bright spot, and AGER area over DAPI area (n = 3–5 mice). In C–E, error bars display SD. Two-tailed Student’s t test: *P < 0.05 and **P < 0.01. AGER = advanced glycosylation end product-specific receptor; SPC = surfactant protein C.
Figure 5.
Figure 5.
E18.5 dnFGFR2 fibroblasts support an increased number of AT2 cells in vitro. (A) Schematic for generating organoids. Mice were exposed to dnFGFR2 at E16.5–E18.5, lungs were harvested at E18.5, and CD140+ fibroblasts and CD326+ epithelium were isolated by MACS and cultured in Cultrex in Transwell inserts at a ratio of 10 fibroblasts to 1 alveolar epithelial cell for 21 days with organoid media. (A and B) Bright-field images of organoid Transwell inserts at 21 days of growth. Scale bar, 2 mm. (D–E′) Twenty-one-day-old organoids immunostained for SPC (green), ADRP (red), and HOPX (white). (F–G′) Twenty-one-day-old organoids immunostained for SPC (green), HOPX (white), and aSMA (red). Scale bars: D–G, 100 μm; insets, 50 μm. (H and I) Organoid size in Transwell inserts quantified using Cytation 5 imager; n = 3 Transwell inserts (replicates) per group. (H) Colony-forming efficiency averaged per Transwell insert (organoids 50–1,000 μm in diameter). Box-and-whisker plot displays IQR and outliers; dot-plot error bars display SD. (I) Total number of organoids per group (100–250-μm size quantified). Violin plot displays IQR, mean, and outliers. (J) Quantification of SPC in organoids as SPC area over DAPI area. (K) Quantification of HOPX in organoids as HOPX bright spot over DAPI bright spot. (L) Quantification of ADRP in organoids as ADRP area over DAPI area. (M) Quantification of aSMA in organoids as aSMA area over DAPI area. (J–M) Box-and-whisker plots with IQR and outliers. One-way ANOVA followed by Tukey’s multiple comparison was used to determine significance among three or more groups; n = 3–4 Transwell inserts (replicates). *P < 0.05, **P < 0.01, ***P < 0.001, and ****P < 0.0001. AEC = alveolar epithelial cell.
Figure 6.
Figure 6.
FGFR2 signaling directs E16.5 myofibroblast differentiation and suppresses E16.5 lipofibroblast differentiation. (A) Bright-field image of collagen assay on adherent E16.5 fibroblasts. Cells were trypsinized after a 1-hour differential plate-down, plated on collagen pellets for the contraction assay, and treated with PBS solution control, rmFGFR2b, or rmFGFR2c. Scale bar, 5 mm. (B) Pellet size was quantified after 48 hours as area in cm2 (n = 8). (C–E) E16.5 adherent fibroblasts were treated for 24 hours with PBS solution control, rmFGFR2b, or rmFGFR2c, and RT-qPCR was performed for the markers of myofibroblast differentiation Acta2 and lipofibroblast differentiation Plin2 and Pparg (n = 4). (F–K′) Immunofluorescence of ADRP (green), PDGFRA (red), and Ki67 (white) (F–H′) and aSMA (green), PDGFRA (red), and Ki67 (white) (I–K′) in adherent fibroblasts treated for 48 hours with PBS solution control, rmFGFR2b, or rmFGFR2c in chamber slides. Scale bars: 200 μm; insets, 100 μm. (L–O) Quantification of ADRP (ADRP area over DAPI area), ADRP having Ki67 (ADRP area having Ki67 bright spot over DAPI area) (n = 12), aSMA (aSMA area over DAPI area), and aSMA having Ki67 (aSMA area having KI67 bright spot over DAPI area) (n = 9). (B–E and L–O) One-way ANOVA followed by Tukey’s multiple comparisons was used to determine significance among three or more groups: *P < 0.05, **P < 0.01, ***P < 0.001, and ****P < 0.0001. In B–D and K–N, error bars display SD.
Figure 7.
Figure 7.
PI3K/AKT signaling positively regulates FGFR2-mediated contraction. (A–C′, E–G′, and I–K′) Immunofluorescence of pAKT (green) (A–D), pSTAT3 (green) (E–H), and pERK (green) (I–L) in adherent fibroblasts treated for 24 hours with PBS solution control, rmFGFR2b, or rmFGFR2c in chamber slides. Scale bars: 200 μm; inset, 50 μm. (D, H, and L) Quantification of pAKT (pAKT area over DAPI area) (n = 10), pERK (pERK area over DAPI area), and pSTAT3 (pSTAT3 bright spot over DAPI bright spot) (n = 5). (M) E16.5 adherent fibroblasts seeded on collagen pellets and treated with PBS solution, PBS + rmFGFR2b, PBS + rmFGFR2c, PBS + 740 Y-P, PBS + rmFGFR2b + 740 Y-P, or PBS + rmFGFR2b + 740 Y-P for 24 hours. Scale bars, 5 mm. (N) Pellet size quantified after 24 hours as area in cm2 (n = 5). (O) E18.5 adherent fibroblasts isolated from WT and dnFGFR2 littermate lungs plated in a contraction assay and treated with 740-YP or left untreated. Scale bars, 5 mm. (P) Quantification of E18.5 collagen pellets after 48 hours as area in cm2 (n = 4–6 mice). (Q) Model of phenotype. Disruption of FGFR2 signaling prenatally in the alveolar niche causes expansion of PDGFRA+ matrix/lipofibroblasts over PDGFRA+ myofibroblasts, leading to increased support of AT2 expansion but decreased AT1 differentiation and secondary septation. PI3K/AKT signaling mediates myofibroblast-over-lipofibroblast specification downstream of FGFR2 signaling. (D, H, L, N, and P) One-way ANOVA followed by Tukey’s multiple comparison was used to determine significance among three or more groups: *P < 0.05, **P < 0.01, ***P < 0.001, and ****P < 0.0001. In D, H, L, and N, error bars display SD; in P, a box-and-whisker plot is displayed with IQR and mean.

Similar articles

References

    1. Burri PH, Dbaly J, Weibel ER. The postnatal growth of the rat lung. I. Morphometry. Anat Rec . 1974;178:711–730. - PubMed
    1. Schittny JC. Development of the lung. Cell Tissue Res . 2017;367:427–444. - PMC - PubMed
    1. Desai TJ, Brownfield DG, Krasnow MA. Alveolar progenitor and stem cells in lung development, renewal and cancer. Nature . 2014;507:190–194. - PMC - PubMed
    1. Yang J, Hernandez BJ, Martinez Alanis D, Narvaez del Pilar O, Vila-Ellis L, Akiyama H, et al. The development and plasticity of alveolar type 1 cells. Development . 2016;143:54–65. - PMC - PubMed
    1. Northway WH, Jr, Rosan RC, Porter DY. Pulmonary disease following respirator therapy of hyaline-membrane disease. Bronchopulmonary dysplasia. N Engl J Med . 1967;276:357–368. - PubMed

MeSH terms

Substances