. 2023 Sep 19;6(11):e202301947.
doi: 10.26508/lsa.202301947. Print 2023 Nov.

MAST4 promotes primary ciliary resorption through phosphorylation of Tctex-1

Affiliations

MAST4 promotes primary ciliary resorption through phosphorylation of Tctex-1

Kensuke Sakaji et al. Life Sci Alliance. .

Abstract

The primary cilium undergoes cell cycle-dependent assembly and disassembly. Dysregulated ciliary dynamics are associated with several pathological conditions called ciliopathies. Previous studies showed that the localization of phosphorylated Tctex-1 at Thr94 (T94) at the ciliary base critically regulates ciliary resorption by accelerating actin remodeling and ciliary pocket membrane endocytosis. Here, we show that microtubule-associated serine/threonine kinase family member 4 (MAST4) is localized at the primary cilium. Suppressing MAST4 blocks serum-induced ciliary resorption, and overexpressing MAST4 accelerates ciliary resorption. Tctex-1 binds to the kinase domain of MAST4, in which the R503 and D504 residues are key to MAST4-mediated ciliary resorption. The ciliary resorption and the ciliary base localization of phospho-(T94)Tctex-1 are blocked by the knockdown of MAST4 or the expression of the catalytic-inactive site-directed MAST4 mutants. Moreover, MAST4 is required for Cdc42 activation and Rab5-mediated periciliary membrane endocytosis during ciliary resorption. These results support that MAST4 is a novel kinase that regulates ciliary resorption by modulating the ciliary base localization of phospho-(T94)Tctex-1. MAST4 is a potential new target for treating ciliopathies causally by ciliary resorption defects.


Conflict of interest statement

The authors declare that they have no conflict of interest.

Figures

Figure S1.
Figure S1.. Quantitative PCR analyzed MAST1-4 expression in RPE-1 cells.
Quantitative PCR analyses show the relative transcript levels of MAST1-4 in RPE-1 cells (normalized by the housekeeping gene GAPDH). Data are shown as means ± S.E.M. of n = 3 biologically independent experiments. The gel pictures of the PCR products are also shown.
Figure S2.
Figure S2.. Validation of the KD effect and overexpressed MAST4.
(A) Representative immunoblots of endogenous MAST4 and GAPDH in RPE-1 cells transfected with GFP alone (control), MAST4-shRNA1-IRES-GFP (MAST4-sh1), or MAST4-shRNA2-IRES-GFP (MAST4-sh2). (B) Lysates of RPE-1 cells transfected with GFP alone (control), or GFP together with MAST4WT were immunoblotted with anti-MAST4 or anti-GAPDH antibody. The high level of transfected MAST4 obscured the relatively weaker signal of the endogenous MAST4 signal.
Figure 1.
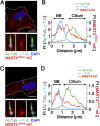
Figure 1.. MAST4 is localized in the cilium and required for ciliary resorption.
(A) RPE-1 cells transfected with the GFP alone (control), MAST4-shRNA1-IRES-GFP (MAST4-sh1), or MAST4-shRNA2-IRES-GFP (MAST4-sh2) were starved and added serum back for the indicated time periods. Representative confocal images of the Ac-Tub–labeled cilium (red) and the γ-Tub–labeled basal body (cyan) in GFP+ cells (green) are shown. Cell nuclei were stained with DAPI (blue). n = 16–31 cells from three independent experiments. Scale bar: 5 μm. (B, C) Quantification of (A). Histogram shows the cilium length (measured by Ac-Tub) (B) and the fraction of the GFP+ cells expressing a cilium (C). Values are means ± S.E.M. *P < 0.05 and ***P < 0.001, one-way ANOVA followed by Tukey’s test versus 0 h for each group. #P < 0.05 and ##P < 0.01, two-way ANOVA followed by Bonferroni’s test. n = 16–31 cells (B) and n = 100 cells in each experiment, with three independent experiments (C). (D) RPE-1 cells transiently transfected with GFP (control) or GFP together with MAST4WT were starved and followed by serum readdition. The quantification of the percentage of GFP+ cells, harvested at different time points post-serum stimulation, is shown. Values are means ± S.E.M. *P < 0.05 and ***P < 0.001, one-way ANOVA followed by Tukey’s test versus 0 h for each group. n = 100 cells in each experiment, with three independent experiments. (E) Representative confocal images of MAST4-mCherry (mC) in quiescent transfected RPE-1 cells stained for mCherry (red), Ac-Tub (green), and γ-Tub (cyan). White dashed lines demarcate the cell border (DAPI: nuclear). The high-power view highlights the ciliary distribution of MAST4-mCherry. Scale bars: 10 μm (E, low-power magnification) and 1 μm (E, high-power magnification). (E, F) Segmented profiles of fluorescence intensities (FIs) along the white dashed arrow shown in (E). BB, basal body. The y-axis FI unit is defined by the acquired values divided by 104 using Zen software (Zeiss). The x-axis describes the distance from the proximal part of the basal body (considered as 0). The representative line scan from the images of 16 cilia is shown.
Figure S3.
Figure S3.. Super-resolution images of MAST4WT-mCherry in RPE-1 cells.
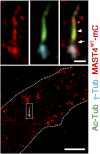
A representative super-resolution Airyscan image of MAST4WT-mCherry in serum-starved RPE-1 cells. MAST4WT-mCherry signals were detected in the ciliary base (arrow) and the ciliary axoneme (arrowhead). The asterisk marks the MAST4WT-mCherry signal juxtaposing to the ciliary axoneme, possibly representing the ciliary pocket. White dashed lines in the low-power view demarcate the cell border. Scale bars: 5 μm (low power) and 1 μm (high power).
Figure 2.
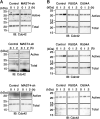
Figure 2.. Characterization of Tctex-1-MAST4 interaction and mapping Tctex-1–binding motif of MAST4.
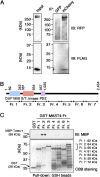
(A) Representative immunoblot of total HEK293 cell lysates containing transiently transfected MAST4WT-mCherry and FLAG-Tctex-1WT (input) and the immunoprecipitants (IP) pulled down by anti-mCherry or anti-GFP (control) antibodies probed with anti-RFP and anti-DYKDDDDK (FLAG) antibodies. (B) Diagram showing different domains and corresponding amino acids of MAST4. Different regions (Fr.1–Fr. 7) of MAST4 fused with GST for pull-down assays are also labeled. S/T_kinase, serine/threonine kinase domain. (C) MBP-Tctex-1–containing bacterial lysates were mixed with bacterial extracts containing GST or GST-MAST4 fragments (with indicated molecular weights) and then incubated with glutathione beads. The eluates from the glutathione beads were electrophoresed and immunoblotted (IB) with anti-MBP antibody, or GST or GST-MAST4 fragments in the elutes were stained with Coomassie brilliant blue (CBB). The expected molecular weights of GST (26 kD) and GST-MAST4 are shown. Note the roughly equivalent amounts of GST and GST-MAST4 fragments were loaded in the inputs.
Figure 3.
Figure 3.. MAST4 regulates Tctex-1–mediated ciliary resorption and the appearance of phospho-(T94)Tctex-1 at the ciliary base.
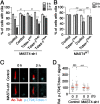
(A) RPE-1 cells transfected with GFP alone (control), or MAST4-sh1-IRES-GFP (MAST4-sh1) together with FLAG-tagged Tctex-1WT, Tctex-1T94E, or Tctex-1T94A were subjected to a ciliary resorption assay. The histogram shows the percentage of GFP+ cells expressing Ac-Tub–labeled cilium at the indicated time points post-serum restimulation. Values are means ± S.E.M. *P < 0.05 and ***P < 0.001, one-way ANOVA followed by Tukey’s test versus 0 h for each group. ##P < 0.01, two-way ANOVA followed by Bonferroni’s test. n = 100 cells in each experiment, with three independent experiments. (B) Ciliary resorption assay of RPE-1 cells transfected with FLAG-Tctex-1T94A with or without co-transfected MAST4WT. The histogram shows the percentage of ciliated GFP+ cells at 0 and 1 h post-serum readdition. Values are means ± S.E.M. ###P < 0.001, two-way ANOVA followed by Bonferroni’s test. §§P < 0.01, t test versus 0 h. n = 100 cells in each experiment, with three independent experiments. (C, D) Representative confocal images of phospho-(T94)Tctex-1 (cyan) and Ac-Tub (red) in RPE-1 cells transfected with GFP (control) or MAST4-sh1 under the starving (0 h) and 2-h serum-stimulated conditions. (C) Phospho-(T94)Tctex-1 was detected by Alexa Fluor 647–conjugated secondary antibody and is pseudo-colored in cyan for presentation. (D) Fluorescence intensity of phospho-(T94)Tctex-1 associated with the proximal end of Ac-Tub–labeled cilium was quantified and is shown in (D). Scale bar: 1 μm (C). Values are means ± S.E.M. ###P < 0.001, two-way ANOVA followed by Bonferroni’s test. §§§P < 0.001, t test. n = 25–39 cells from three independent experiments.
Figure 4.
Figure 4.. Mapping catalytic motif residues of MAST4 required for the ciliary base activation of phospho-(T94)Tctex-1.
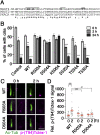
(A) Alignment of the kinase domain of MAST2 and PKA catalytic subunit α (PKACA) with the predicted catalytic domain of MAST4. Bold letters were used to highlight the amino acid residues that were changed to alanine by site-directed mutagenesis. The predicted catalytic motif (H502–N509), DFG motif (D522–G524), and autophosphorylation residues (T524 or T535) of MAST4 are marked by a bar. (B) Ciliary resorption assay of RPE-1 cells transfected with GFP alone (control), or GFP together with MAST4WT or the indicated MAST variants. The histogram shows the percentage of ciliated GFP+ cells at different time points after serum readdition. Values are means ± S.E.M. *P < 0.05, **P < 0.01, and ***P < 0.001, one-way ANOVA followed by Tukey’s test versus 0 h for each group. n = 100 cells in each experiment, with three independent experiments. (C) Representative confocal images of phospho-(T94)Tctex-1 (magenta) and Ac-Tub (green) in RPE-1 cells transfected with GFP together with WT or indicated mutant MAST4-mCherry under the starving (0 h) and 2-h serum-stimulated conditions. (C) Phospho-(T94)Tctex-1 was detected by Alexa Fluor 647–conjugated secondary antibody and is pseudo-colored in magenta for presentation. n = 12–16 cells from three independent experiments. (D) Fluorescence intensity of phospho-(T94)Tctex-1 associated with the proximal end of Ac-Tub–labeled cilium was quantified (D). Values are means ± S.E.M. ##P < 0.01 and ###P < 0.001, two-way ANOVA followed by Bonferroni’s test. §§§P < 0.001, t test. n = 12–16. Scale bar: 1 μm (C).
Figure S4.
Figure S4.. 3D structural prediction of the MAST4 kinase domain.
The structure of the MAST4 kinase domain was predicted using the AlphaFold2 tool. (A, C) MAST4 kinase domain without (A) or with (C) side chain structure of amino acids is shown. (B, D) Boxed areas are highlighted in (B, D), respectively. The positions of R503, D504, and K506 are labeled.
Figure S5.
Figure S5.. Immunoblots of overexpressed MAST4 variants.
Representative immunoblots of RPE-1 cells transfected with GFP alone (control), or GFP together with MAST4WT, MAST4R503A, MAST4D504A, MAST4K506A, MAST4D522A, MAST4T534A, or MAST4T535A. The blots were probed with anti-MAST4 or anti-GAPDH antibody.
Figure S6.
Figure S6.. Ciliary localization of MAST4R503A and MAST4D504A.
(A, B, C, D) Representative confocal images of serum-starved RPE-1 cells transfected with the indicated mutant MAST4-mCherry (mC) (red) and stained for Ac-Tub (green) and γ-Tub (cyan). (A, C) Low-power views show a single transfected cell. The high-power view highlights the ciliary distribution of MAST4-mCherry. (B, D) Profile blots of fluorescence intensities (FIs) are also shown. BB, basal body. White dashed lines in the low-power view demarcate the cell border (DAPI: nuclear). Scale bars: 10 μm (low-power magnification) and 1 μm (high-power magnification). The y-axis FI unit is defined by the acquired values divided by 104 using Zen software (Zeiss). The x-axis describes the distance from the proximal part of the basal body (considered as 0). The representative line scans from the images of 11–16 cilia are shown.
Figure 5.
Figure 5.. MAST4 promotes ciliary resorption through Cdc42 activation.
(A) Ciliary resorption assay of RPE-1 cells transfected with GFP alone (control), or MAST4WT together without (control) or with HA-tagged Cdc42T17N (Cdc42-DN). The histogram shows the percentage of GFP+ cells with Ac-Tub–labeled primary cilia at the indicated time points. Values are means ± S.E.M. ##P < 0.01 and ###P < 0.001, two-way ANOVA followed by Bonferroni’s test. §P < 0.05, t test. n = 100 cells in each experiment, with three independent experiments. (B) RPE-1 cells expressing GFP alone (control), MAST4R503A, or MAST4D504A (co-expressed with GFP), in the presence or absence (control) of HA-tagged Cdc42G12V (Cdc42-CA). The cells were subjected to a ciliary resorption assay. The histogram shows the percentage of ciliated GFP+ cells at different time points post-serum readdition. Values are means ± S.E.M. *P < 0.05 and ***P < 0.001, one-way ANOVA followed by Tukey’s test versus 0 h for each group. ###P < 0.001, two-way ANOVA followed by Bonferroni’s test. n = 100 cells in each experiment, with three independent experiments. (C, D, E, F) Cdc42 activity assays. (C, E) Representative Cdc42 immunoblots containing total Cdc42 and active Cdc42 pulled down by PAK-PBD beads from RPE-1 cells transfected with pCAG (control) and pCAG-MAST4-sh1 (C) or MAST4 variants (E). (D, F). Ratios of active Cdc42 to total Cdc42 in cells harvested at different time points post-serum readdition are shown in (D, F). Value at the 0-h time point was considered as 100. Values (D, F) are means ± S.E.M. #P < 0.05, ##P < 0.01, and ###P < 0.001, two-way ANOVA followed by Bonferroni’s test. n = 3 (D, F).
Figure S7.
Figure S7.. Cdc42 activity assay.
The whole blots of Fig 5C–F. (A, B) Immunoblots show the active Cdc42 and total Cdc42 expressed in RPE-1 cells transfected with MAST4-shRNA1 (A), and MAST4R503A or MAST4D504A (B).
Figure S8.
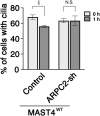
Figure S8.. ARPC2 acts downstream of MAST4-mediated ciliary resorption.
A ciliary resorption assay of RPE-1 cells transfected with GFP alone (control), or GFP together with MAST4WT, in the presence or absence of ARPC2-shRNA-IRES-GFP (ARPC2-sh). The histogram shows the percentage of cilium-expressing GFP+ cells at the indicated time points. Values are means ± S.E.M. §P < 0.05, t test. n = 100 cells in each experiment, with three independent experiments. N.S., not significant.
Figure 6.
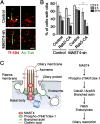
Figure 6.. MAST4 regulates the periciliary membrane endocytosis working model.
(A) Representative SR-SIM images show Ac-Tub–labeled cilium (green) and the periciliary signal of internalized Alexa Fluor 594–conjugated transferrin (Tf-594) (red) in RPE-1 cells transfected with GFP alone (control), and GFP together with MAST4-sh1 1 h post–IGF-1 (10 nM) stimulation. Ac-Tub was detected by Alexa Fluor 405–conjugated secondary antibody and is pseudo-colored in green for presentation. Reprehensive images of 14 cilia (in control) and 8 cilia (in MAST-sh1–transfected cells) are shown. Scale bar: 1 μm. (B) Ciliary resorption assay of RPE-1 cells transfected with GFP alone (control), or MAST4-sh1-IRES-GFP (MAST4-sh1) together with FLAG-tagged Rab5Q79L (Rab5-CA). The histogram shows the percentage of GFP+ cells with Ac-Tub–labeled primary cilia at the indicated time points. Values are the mean ± S.E.M. *P < 0.05, **P < 0.01, and ***P < 0.001, one-way ANOVA followed by Tukey’s test versus 0 h for each group. #P < 0.05, two-way ANOVA followed by Bonferroni’s test. n = 100 cells in each experiment, with three independent experiments. (C) Schematic diagram shows the periciliary location and the processes by which MAST4 mediates the ciliary resorption, through the activation of phospho-(T94)Tctex-1, Cdc42/Arp2/3 activity (probably branched actin organization), and periciliary membrane endocytosis.

Similar articles

Cited by

References

    1. An SWA, Choi ES, Hwang W, Son HG, Yang JS, Seo K, Nam HJ, Nguyen NTH, Kim EJE, Suh BK, et al. (2019) KIN-4/MAST kinase promotes PTEN-mediated longevity of Caenorhabditis elegans via binding through a PDZ domain. Aging Cell 18: e12906. 10.1111/acel.12906 - DOI - PMC - PubMed
    1. Beretov J, Wasinger VC, Millar EK, Schwartz P, Graham PH, Li Y (2015) Proteomic analysis of urine to identify breast cancer biomarker candidates using a label-free LC-MS/MS approach. PLoS One 10: e0141876. 10.1371/journal.pone.0141876 - DOI - PMC - PubMed
    1. Chen JL, Chang CH, Tsai JW (2019) Gli2 rescues delays in brain development induced by Kif3a dysfunction. Cereb Cortex 29: 751–764. 10.1093/cercor/bhx356 - DOI - PubMed
    1. Chuang JZ, Yeh TY, Bollati F, Conde C, Canavosio F, Caceres A, Sung CH (2005) The dynein light chain Tctex-1 has a dynein-independent role in actin remodeling during neurite outgrowth. Dev Cell 9: 75–86. 10.1016/j.devcel.2005.04.003 - DOI - PMC - PubMed
    1. Clement CA, Ajbro KD, Koefoed K, Vestergaard ML, Veland IR, Henriques de Jesus MP, Pedersen LB, Benmerah A, Andersen CY, Larsen LA, et al. (2013) TGF-β signaling is associated with endocytosis at the pocket region of the primary cilium. Cell Rep 3: 1806–1814. 10.1016/j.celrep.2013.05.020 - DOI - PubMed

Publication types

LinkOut - more resources