. 2023 Sep 26;120(39):e2302500120.
doi: 10.1073/pnas.2302500120. Epub 2023 Sep 18.

Light-inducible T cell engagers trigger, tune, and shape the activation of primary T cells

Affiliations

Light-inducible T cell engagers trigger, tune, and shape the activation of primary T cells

Morgane Jaeger et al. Proc Natl Acad Sci U S A. .

Abstract

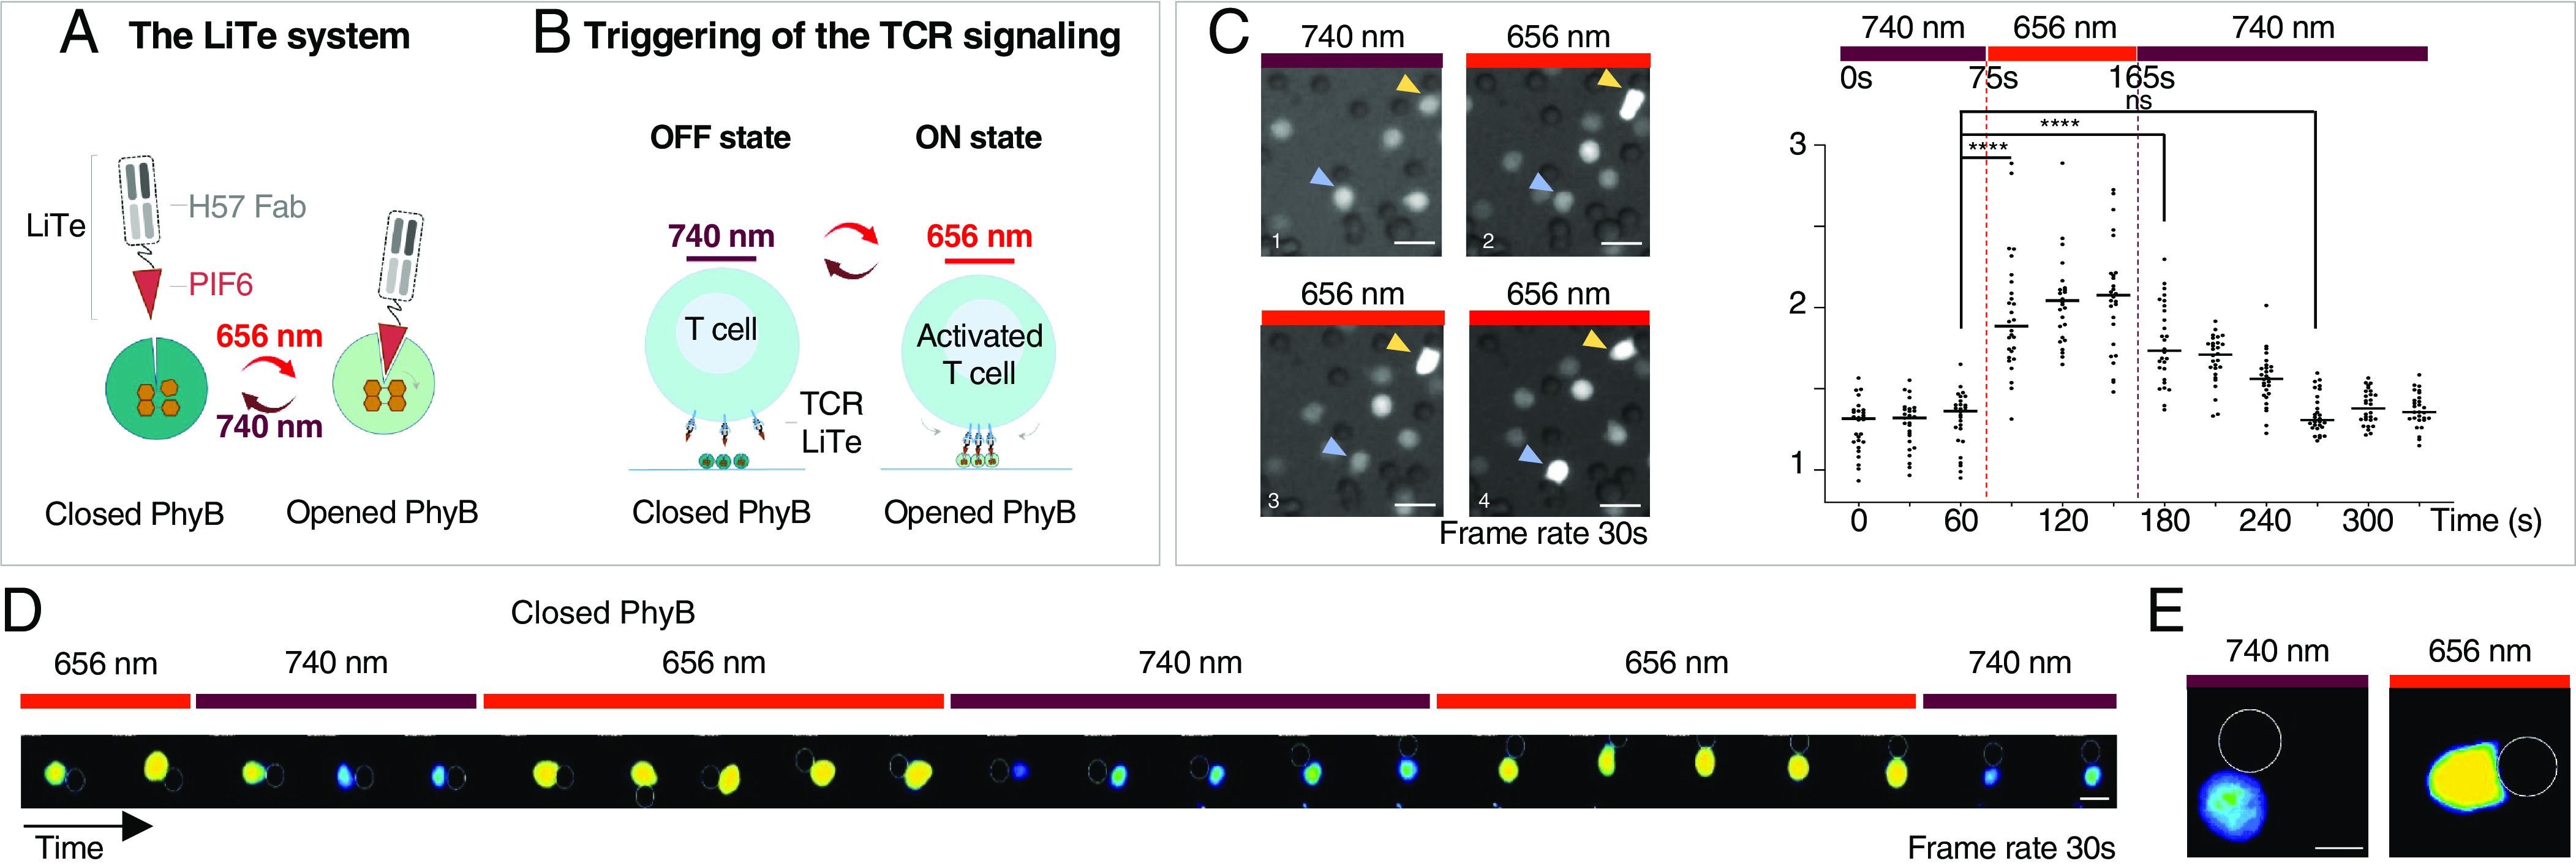
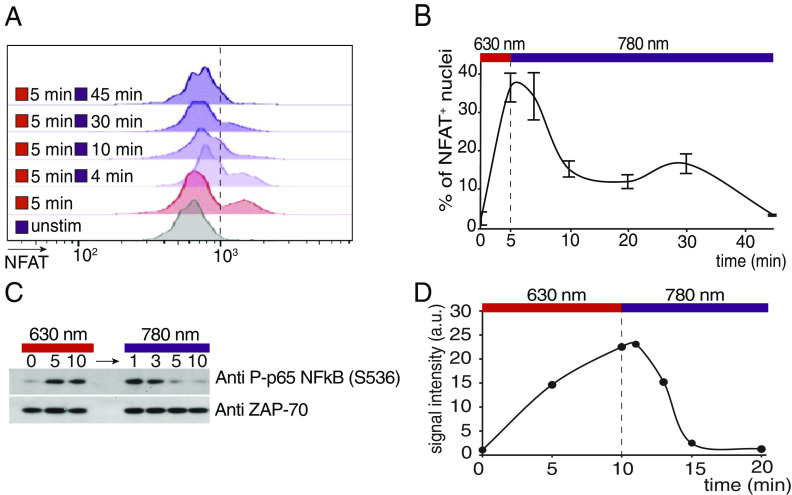
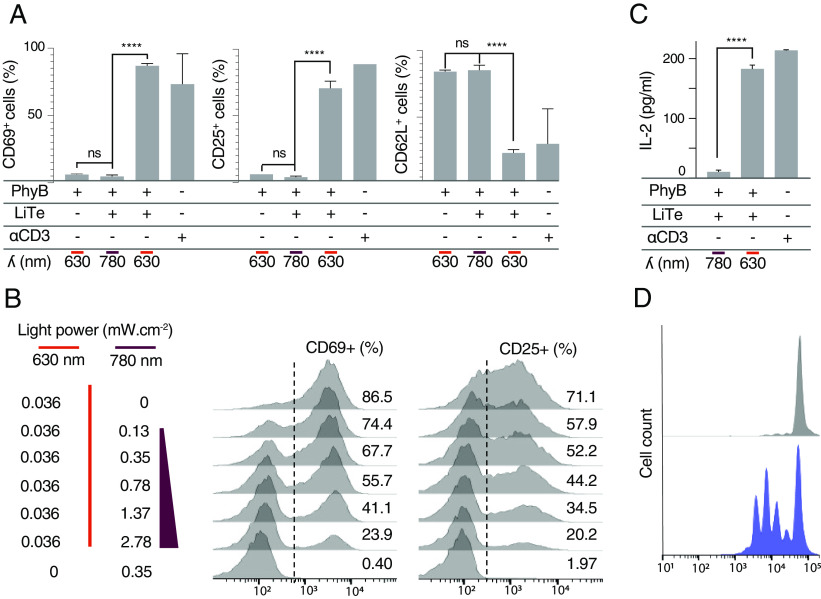
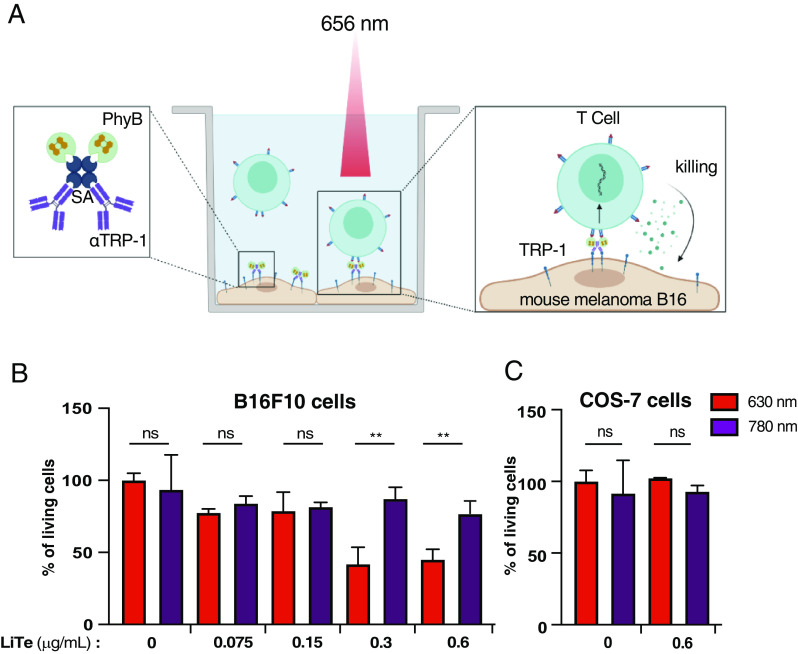
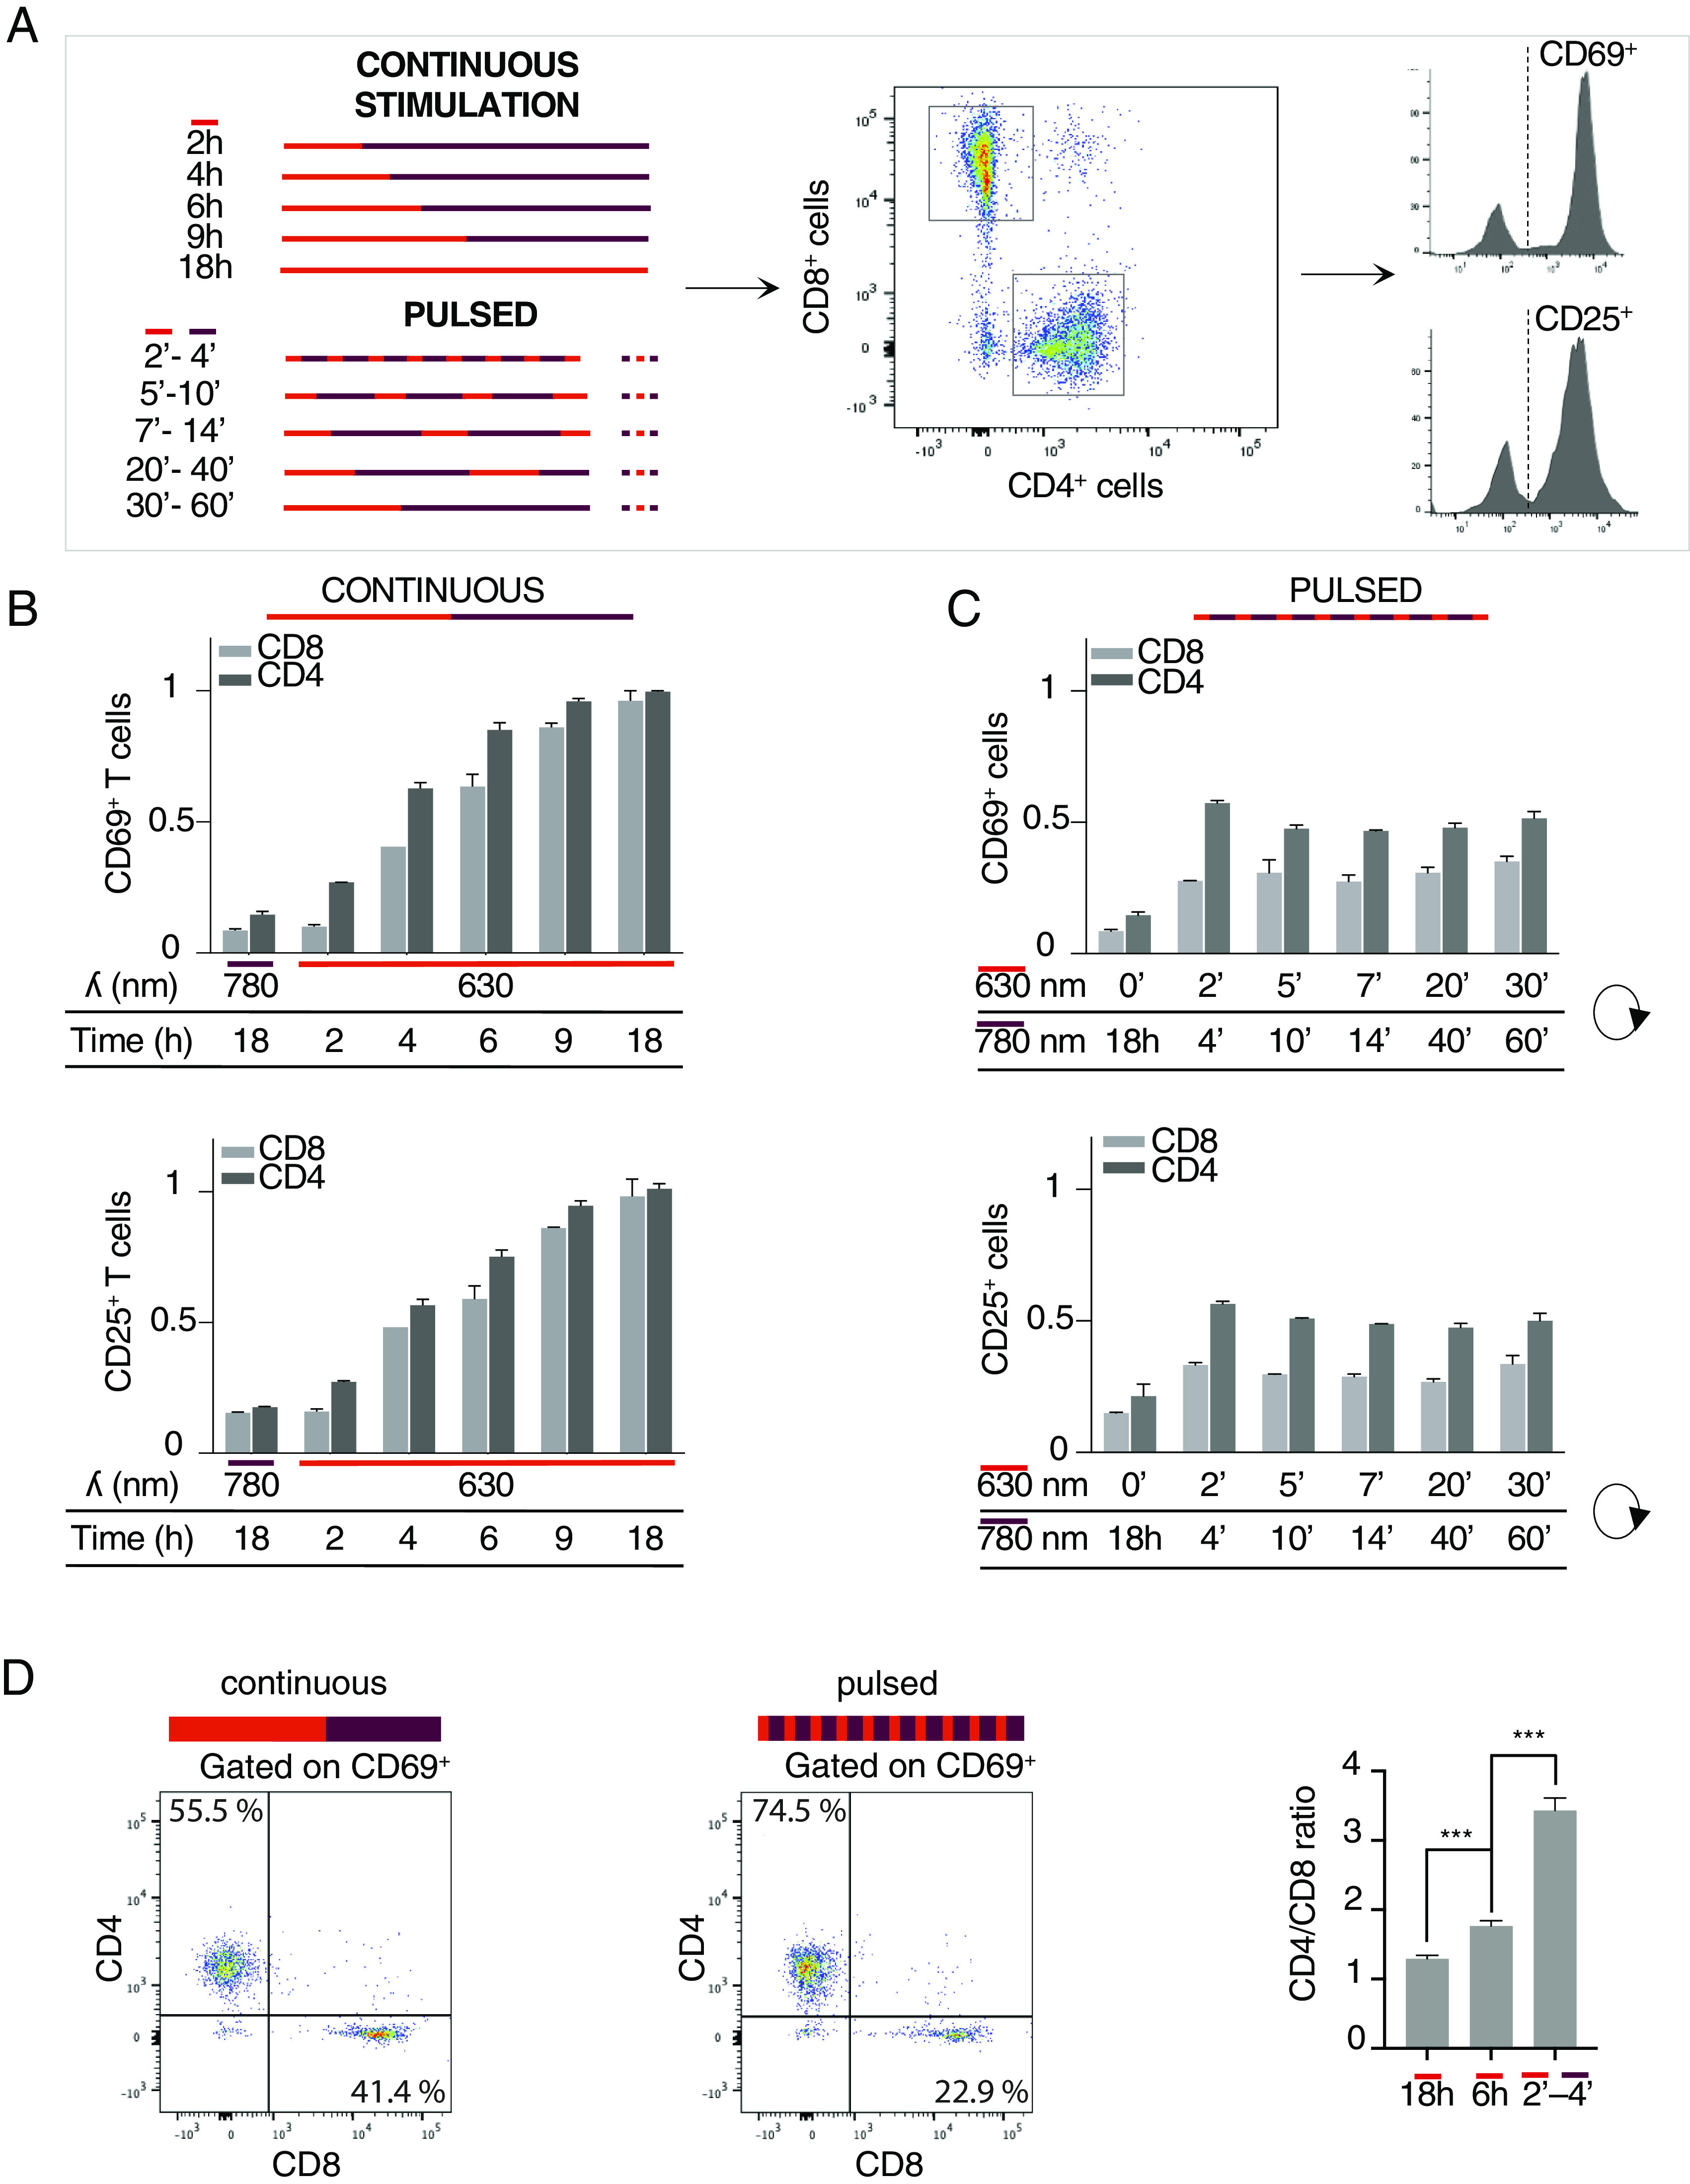
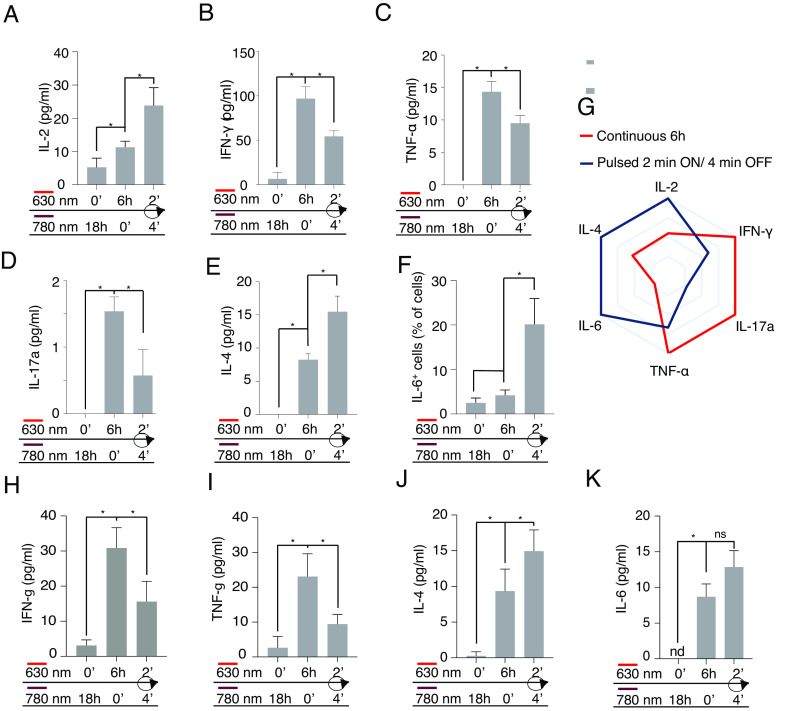
To mount appropriate responses, T cells integrate complex sequences of receptor stimuli perceived during transient interactions with antigen-presenting cells. Although it has been hypothesized that the dynamics of these interactions influence the outcome of T cell activation, methodological limitations have hindered its formal demonstration. Here, we have engineered the Light-inducible T cell engager (LiTE) system, a recombinant optogenetics-based molecular tool targeting the T cell receptor (TCR). The LiTE system constitutes a reversible molecular switch displaying exquisite reactivity. As proof of concept, we dissect how specific temporal patterns of TCR stimulation shape T cell activation. We established that CD4+ T cells respond to intermittent TCR stimulation more efficiently than their CD8+ T cells counterparts and provide evidence that distinct sequences of TCR stimulation encode different cytokine programs. Finally, we show that the LiTE system could be exploited to create light-activated bispecific T cell engagers and manipulate tumor cell killing. Overall, the LiTE system provides opportunities to understand how T cells integrate TCR stimulations and to trigger T cell cytotoxicity with high spatiotemporal control.

Keywords: T cell activation; TCR; bispecific T cell engagers; immunology; optogenetics.


Conflict of interest statement

Patent application PCT/EP2019/076914 and EP22305545.0 corresponding respectively to the LiTE and the LiTE-Me systems have been filed.

Figures

Fig. 1.
Fig. 1.
Design of the LiTE system for reversible triggering of TCR signaling in response to light. (A) The LiTE system is in two parts: LiTE protein, a recombinant protein linking the PIF6 domain to the anti-mouse TCR H57-597 Fab and PhyB1-651. Exposure of the LiTE system to red light opens the PhyB binding site for PIF6, whereas far-red light reverses this conformational change. (B) Exposure of mouse T cells in the presence of the LiTE system to 656 nm light induces the binding of TCR-bound LiTE proteins to PhyB-coated surface, leading to TCR aggregation/immobilization and triggering. This process is reversed by 730- to 760 nm light. (C) Primary T lymphocytes were loaded with PBX, a calcium-sensitive dye, then incubated with the LiTE protein before being mixed with PhyB-coated beads and imaged by fluorescence microscopy at 37 °C. (Left) Time-lapse images of the cells exposed to 740 nm light and then to 656 nm light in the presence of the LiTE system. Arrows indicate cells in contact with PhyB-coated beads over time. (Right) Quantification of relative fluorescence intensity of cells in contact with PhyB-coated beads and exposed to the specified light sources (n = 30 cells, representative of >3 experiments; ****P < 0.0001, Wilcoxon–Mann–Whitney test; (scale bar: 10 μm). (D) Time-lapse images of a T cell under iterative stimulation/resting cycles (scale bar: 5 μm, frame rate: 30 s). (E) Morphological changes of a lymphocyte in contact with PhyB-coated bead and in response to exposure to 740 nm (Left) or 656 nm (Right) lights; (scale bar: 5 μm.)
Fig. 2.
Fig. 2.
Kinetics of NFAT nuclear translocation and NFκB phosphorylation in response to transient LiTE-driven TCR stimulation. Primary CD8+ T cells were incubated with the LiTE system and illuminated on optoPlate with 630 nm light for the indicated time and then with 780 nm light for the indicated time. (A) Flow cytometry analysis of the amount of NFAT in purified T cell nuclei at different time points (representative of n = 2 experiments). (B) Percentage of NFAT positive nuclei shown in A. (C) Western blot analysis of NFκB phosphorylation during illumination at a wavelength of 630 nm followed by illumination at 780 nm (representative of n = 2 experiments). (D) Quantification of NFκB phosphorylation signal shown in C. Values are normalized on the ZAP-70 molecule signal as loading control.
Fig. 3.
Fig. 3.
LiTE-driven TCR photostimulation is tunable and leads to effective T cell activation. (A) Primary T cells were incubated with the LiTE system and anti-CD28 antibody, then illuminated 18 h in optoPlate at the specified wavelength. Flow cytometry analysis of CD69, CD25, or CD62L positive cells in response to 630- or 780 nm light (n > 3, mean ± SEM are shown; ***P < 0.001, ****P < 0.0001, Student t test). (B) Same experimental conditions as in A, except that cells were exposed to different ratios of 630 nm/780 nm light power and analyzed for the expression of CD69 or CD25 by flow cytometry. (C) Same experimental conditions as in A, except that IL-2 secretion was analyzed in the cell supernatant by ELISA (n = 3; mean ± SD are shown; ****P < 0.0001, Student t test). (D) T Cells treated as in a were illuminated 72 h with 780 nm light (Upper) or 630 nm light (Lower) before the analysis of their proliferation by measurement of CellTrace Violet dilution by flow cytometry (representative of n > 3 experiments).
Fig. 4.
Fig. 4.
LiTE-Me system design and validation. (A) PhyB is combined with streptavidin (SA) and with the melanoma cell-targeting antibody TA-99 (specific for surface molecule TRP-1). When bound to melanoma cells, the Me–PhyB complex can engage LiTE-bound CTL when exposed to 656 nm light and trigger tumor cell killing. (B) CTLs were dropped on a B16F10 melanoma cell monolayer in the presence of the LiTE-Me system at the indicated concentration and then illuminated with a 630 nm or 780 nm light for 18 h at 37 °C. Tumor cell killing has been evaluated with the CellTiter-Glo® luminescent assay; the histogram represents the percent of living tumor cells compared to untreated cells (i.e., without the LiTE-Me system), (n = 2; mean ± SD are shown; **P < 0.001, Student t test). (C) Control under the same conditions as in A but with the TRP-1 negative COS-7 cell line; (n = 2; mean ± SD are shown, Student t test).
Fig. 5.
Fig. 5.
LiTE system enabled the differential mobilization of the CD4+ and CD8+ T cell subsets. (A) Primary T cells were incubated with the LiTE system and anti-CD28 antibody and then illuminated for 18 h in optoPlate under continuous or pulsed illumination conditions. All pulsed illumination conditions correspond to 6 h of cumulative exposure time to 630 nm light. CD4+ and CD8+ T cell subsets were analyzed by flow cytometry for CD69 and CD25 expression. (B) Flow cytometry analysis of the T cell activation following different periods of continuous photostimulation (n > 3; mean ± SEM are shown; normalized data to 18-h continuous photostimulation value). (C) Same as in B, but for pulsed photostimulation of different durations (n > 3; mean ± SEM; normalized data to 18 h continuous photostimulation value). (D) Dot plot showing the proportion of CD4+ and CD8+ T cells among the CD69+ T cells, activated under continuous (Left) or pulsed photostimulation conditions (Middle). A total of 2,500 activated cells are shown in each panel. The CD4+/CD8+ T cell ratios induced by the indicated stimulation conditions are shown in the Right panel. The 2′-4′ pulsed stimulation condition over 18 h corresponds to a cumulated 6-h exposure to the 630 nm light (representative of n > 3 experiments; mean ± SD are shown; *** indicates P < 0.0005, Student t test).
Fig. 6.
Fig. 6.
Distinct sequences of TCR stimulation encode different cytokine programs. Primary T cells were incubated with the LiTE system and anti-CD28 antibody and then illuminated for 18 h in optoPlate under continuous or pulsed illumination conditions (6 h of cumulated stimulation time). (A) Measurement of IL-2 secretion in the supernatants by ELISA. (BE) Measurement by the multiplex assay of IFN-γ, TNF-α IL-17, or IL-4 secretion, respectively. (F) Analysis of intracellular IL-6 by flow cytometry (n = 2; mean ± SD; *P < 0.05, Wilcoxon–Mann–Whitney test). (G) Polar representation of the cytokine panels produced by the T lymphocytes stimulated after continuous (in blue) or pulsed (in red) stimulations shown in AF (normalized to the maximum value detected for each cytokine). (HK) Measurement by the multiplex assay of the quantity of IFN-γ, TNF-α, IL-4, and IL-6, respectively, secreted by primary naive CD4+ T cells stimulated as in A, (n = 2; mean ± SD; *P < 0.05, Wilcoxon–Mann–Whitney test).

Similar articles

References

    1. Purvis J. E., Lahav G., Encoding and decoding cellular information through signaling dynamics. Cell 152, 945–956 (2013). - PMC - PubMed
    1. Miller M. J., Safrina O., Parker I., Cahalan M. D., Imaging the single cell dynamics of CD4+ T cell activation by dendritic cells in lymph nodes J. Exp. Med. 200, 847–856 (2004). - PMC - PubMed
    1. Hugues S., et al. , Distinct T cell dynamics in lymph nodes during the induction of tolerance and immunity. Nat. Immunol. 5, 1235–1242 (2004). - PubMed
    1. Mempel T. R., Henrickson S. E., Von Andrian U. H., T-cell priming by dendritic cells in lymph nodes occurs in three distinct phases. Nature 427, 154–159 (2004). - PubMed
    1. Moreau H. D., Bousso P., Visualizing how T cells collect activation signals in vivo. Curr. Opin. Immunol. 26, 56–62 (2014). - PubMed

Publication types