Casein kinase 1 and 2 phosphorylate Argonaute proteins to regulate miRNA-mediated gene silencing
- PMID: 37712432
- PMCID: PMC10626430
- DOI: 10.15252/embr.202357250
Casein kinase 1 and 2 phosphorylate Argonaute proteins to regulate miRNA-mediated gene silencing
Abstract
MicroRNAs (miRNAs) together with Argonaute (AGO) proteins form the core of the RNA-induced silencing complex (RISC) to regulate gene expression of their target RNAs post-transcriptionally. Argonaute proteins are subjected to intensive regulation via various post-translational modifications that can affect their stability, silencing efficacy and specificity for targeted gene regulation. We report here that in Caenorhabditis elegans, two conserved serine/threonine kinases - casein kinase 1 alpha 1 (CK1A1) and casein kinase 2 (CK2) - regulate a highly conserved phosphorylation cluster of 4 Serine residues (S988:S998) on the miRNA-specific AGO protein ALG-1. We show that CK1A1 phosphorylates ALG-1 at sites S992 and S995, while CK2 phosphorylates ALG-1 at sites S988 and S998. Furthermore, we demonstrate that phospho-mimicking mutants of the entire S988:S998 cluster rescue the various developmental defects observed upon depleting CK1A1 and CK2. In humans, we show that CK1A1 also acts as a priming kinase of this cluster on AGO2. Altogether, our data suggest that phosphorylation of AGO within the cluster by CK1A1 and CK2 is required for efficient miRISC-target RNA binding and silencing.
Keywords: Argonaute; CK1A1; CK2; microRNA; phosphorylation.
© 2023 The Authors.
Conflict of interest statement
The authors declare that they have no conflict of interest.
Figures
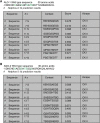
Netphos3.1 scores of CKI and CK2 phosphorylating the different phosphorylatable Serine residues (S988, S992, S995, and S998) and a Threonine residue (T997) within the S988:S998 cluster on ALG‐1 in Caenorhabditis elegans.
Netphos3.1 scores of CKI and CK2 phosphorylating the different phosphorylatable Serine residues (S824, S828, S831, and S834) and a Threonine residue (T830) within the S824:S834 cluster on AGO2 in humans.
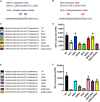
ALG‐1 harbors two CK1A1 recognition motifs within the cluster.
ALG‐1 harbors two CK2 recognition motifs within the cluster.
List of different 30 amino acid biotinylated peptides of ALG‐1 encompassing the S988:S998 phosphorylation cluster that were used for the in vitro CK1A1 kinase assay.
ALG‐1 is phosphorylated in vitro by CK1A1 at S992 and S995 sites. Data are presented as the mean and the error bars represent the standard deviation (SD) from three technical replicates (n = 3).
List of different 30 amino acid biotinylated peptides of ALG‐1 encompassing the S988:S998 phosphorylation cluster that were used for the in vitro CK2 kinase assay.
ALG‐1 is phosphorylated in vitro by CK2 at S988 and S998 sites. Data are presented as the mean and the error bars represent the SD from three technical replicates (n = 3).
- A, B
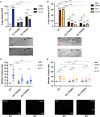
(A) RNAi of kin‐19 on alg‐1(S992E) and alg‐1(S995E) animals significantly rescues defective alae formation as seen in wild‐type animals upon CK1A1 depletion. (B) RNAi of kin‐3 and kin‐10 on alg‐1(S988E) and alg‐1(S998E) animals significantly rescues defective alae formation as seen in wild‐type animals upon CK2 depletion. Animals were fed with bacteria expressing RNAi against kin‐19 (blue), kin‐3 (red), kin‐10 (yellow), or control RNAi (black) for 56 h and observed as young adults. KIN‐19 is an ortholog of CK1A1 in worms. KIN‐3, KIN‐10 are subunits of CK2 in worms. The P‐values indicated were measured by two‐tailed Fisher's exact t‐test (not significant [ns] P > 0.05, ****P < 0.0001). The number of animals with alae defects over the total number of animals scored (n = 50 for each condition) is indicated. Data are presented as the mean and the error bars represent the SD. Representative images with alae structure (normal and defective) are shown for wild‐type animals on kin‐19, kin‐3, kin‐10, or control RNAi. The scale bar represents 10 μm.
- C, D
(C) RNAi of kin‐19 on alg‐1(S992E) and alg‐1(S995E) animals expressing a seam cell gfp reporter (Pscm::gfp) significantly rescues seam cells hyperplasia post‐L4 as seen in wild‐type animals upon CK1A1 depletion. (D) RNAi of kin‐3 and kin‐10 on alg‐1(S988E) and alg‐1(S998E) animals expressing a seam cell gfp reporter (Pscm::gfp) significantly rescues seam cells hyperplasia post‐L4 as seen in wild‐type animals upon CK2 depletion. Mean and SD are plotted on the graph showing the distribution of seam cell number of wild‐type, alg‐1(S992E), and alg‐1(S995E) animals on kin‐19 RNAi (blue) versus control (black) (n = 45 for each condition). Mean and SD are plotted on the graph showing the distribution of seam cell number of wild‐type, alg‐1(S988E), and alg‐1(S998E) animals on kin‐3 (red), kin‐10 (yellow), or control RNAi (black) (n = 45 for each condition). Wild‐type animals have an invariable 16 seam cells at the adult stage. The P‐values indicated were measured by two‐tailed Student's t‐test (*P < 0.05, **P < 0.01, ***P < 0.001, ****P < 0.0001). Representative pictures of seam cell gfp reporter expression (normal and abnormal) are shown for wild‐type animals on kin‐19, kin‐3, kin‐10, or control RNAi. The number in brackets indicates the number of seam cells. The scale bar represents 100 μm.
- A, B
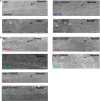
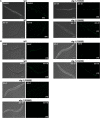
Representative images with alae structure (normal and defective) are shown for all conditions. The scale bar represents 10 μm.
- A, B
Representative pictures of seam cell gfp reporter expression (normal and abnormal) are shown for all conditions. The number in brackets indicates the number of seam cells. The scale bar represents 100 μm.
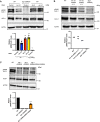
RNAi of kin‐19 leads to a drastic loss of phosphorylation at ALG‐1(S992) site within the S988:S998 cluster. Representative Western blot of pALG‐1 (S992) and ALG‐1 in wild‐type or phospho‐lacking alg‐1(S992A) young adult worm extracts fed with bacteria expressing RNAi against kin‐19, kin‐3, kin‐10, or control RNAi. Western blot quantification from three biological replicates is shown (n = 3). pALG‐1 level is normalized to ALG‐1 levels. ACTIN is used as a loading control. Data are presented as the mean and the error bars represent the SD. P‐values were calculated with a two‐tailed Student's t‐test; **P < 0.01. A significant decrease (kin‐19 RNAi) and no change (kin‐3 and kin‐10 RNAi) in the phosphorylation status of ALG‐1 at S992 site is observed in wild‐type animals.
kin‐19 (ok602) homozygous mutant animals show a strong loss of phosphorylation at ALG‐1(S992) site within the S988:998 cluster. Representative Western blot of pALG‐1 (S992) and ALG‐1 in wild‐type, kin‐19 (ok602) homozygotes, kin‐19 (ok602)/+ heterozygotes, and phospho‐lacking alg‐1 (S992A) young adult worm extracts. Western blot quantification from two biological replicates is shown (n = 2). pALG‐1 level is normalized to ALG‐1 levels. ACTIN is used as a loading control.
The phospho‐specific antibody is specific to the S992 site as it does not recognize the phospho‐lacking alg‐1(S992A) or the phospho‐mimicking alg‐1(S992E) strains. The triple mutant of alg‐1(S988A;S995A;S998A) which still contains the S992 site is still recognized by the antibody. Representative Western blot of pALG‐1 (S992) and ALG‐1 in wild‐type, alg‐1(S992A), alg‐1(S992E), and alg‐1(S988A;S995A;S998A) young adult worm extracts. Western blot quantification from three biological replicates is shown (n = 3). pALG‐1 level is normalized to ALG‐1 levels. ACTIN is used as a loading control. Data are presented as the mean and the error bars represent the SD. P‐values were calculated with a two‐tailed Student's t‐test; ****P < 0.0001.

- A–C
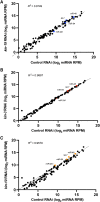
Global miRNA abundance after CK1A1 and CK2 depletion in wild‐type animals. Global miRNA abundance in wild‐type animals after kin‐19 (A), kin‐3 (B), and kin‐10 (C) RNAi compared to control RNAi. Mature miRNA levels are quantified by small RNA sequencing and represented as number of reads mapping to each mature miRNA normalized to total mapped library size in millions (reads per million—RPM). Each point represents the value for a specific miRNA averaged on four biological replicates (n = 4). Members of the let‐7 family are indicated in blue for (A), red for (B), and orange for (C).
- A–H
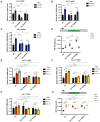
(A–C) RNAi of kin‐19 on alg‐1(S992E) and alg‐1(S995E) animals rescues de‐repression of let‐7 targets as observed in wild‐type animals upon CK1A1 depletion. Wild‐type, alg‐1(S992E), and alg‐1(S995E) animals were fed with bacteria expressing RNAi against kin‐19 (blue) or control RNAi (black) for 56 h and collected as young adults. The mRNA levels of three let‐7 miRNA targets lin‐41 (A), daf‐12 (B), and hbl‐1 (C) were measured by RT–qPCR and normalized to the levels of control RNAi. tba‐1 mRNA was used as reference. Data are presented as the mean and the error bars represent the SD from four biological replicates (n = 4), and P‐values were calculated with a two‐tailed Student's t‐test; (not significant [ns] P > 0.05, **P < 0.01, ***P < 0.001, ****P < 0.0001). (E–G) RNAi of kin‐3 and kin‐10 on alg‐1(S988E) and alg‐1(S998E) animals rescues de‐repression of let‐7 targets as observed in wild‐type animals upon CK2 depletion. Wild‐type, alg‐1(S988E) and alg‐1(S998E) animals were fed with bacteria expressing RNAi against kin‐3 (red), kin‐10 (yellow), or control RNAi (black). The mRNA levels of three let‐7 miRNA targets lin‐41 (E), daf‐12 (F), and hbl‐1 (G) were measured by RT–qPCR and normalized to the levels of control RNAi. tba‐1 mRNA was used as reference. Data are presented as the mean and the error bars represent the SD from four biological replicates (n = 4), and P‐values were calculated with a two‐tailed Student's t‐test; (not significant [ns] P > 0.05, *P < 0.05, **P < 0.01, ***P < 0.001, ****P < 0.0001). (D and H) Functional analysis using a let‐7 miRNA reporter. Animals carrying the GFP reporter transgene under the control of a hypodermis‐specific col‐10 promoter and the lin‐41 3′ UTR containing the let‐7 miRNA binding sites (red: diagram) were crossed into wild‐type, alg‐1(S992E), alg‐1(S995E), alg‐1(S988E), and alg‐1(S998E) animals. Animals were fed with bacteria expressing RNAi against kin‐19 (blue), kin‐3 (red), kin‐10 (yellow), or control RNAi (black) for 48 h and observed at late L4 stage. Quantification of GFP in adult animals was performed by measuring the mean of the GFP detected in four different hypodermal cells for each animal. Data are plotted as the mean and the error bars represent the SD. The P‐values were calculated with a two‐tailed Student's t‐test (not significant [ns] P > 0.05, **P < 0.01, ***P < 0.001, ****P < 0.0001). Fifteen animals were scored under each condition (n = 15).
- A, B
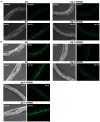
CK1A1 depletion in alg‐1(S992E) and alg‐1(S995E) animals and CK2 depletion in alg‐1(S988E) and alg‐1(S998E) animals rescue let‐7 miRNA reporter de‐repression. Representative pictures of let‐7 miRNA reporter expression are shown for all conditions. The scale bar represents 20 μm.

- A, B
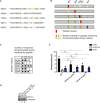
In vitro phosphorylation assay by CK1A1 (A) AGO2 alanine mutants that were used for the in vitro phosphorylation assay. The mutated residues are shown in red. (B) HEK 293T cells were transfected with Flag/HA‐tagged Ago2 WT and mutants. Flag‐tagged proteins were immunoprecipitated, phosphorylated by recombinant CK1A1 and separated on a 10% SDS gel (upper panel). Immunoprecipitated proteins were separated on a 10% SDS gel and analyzed by Western blotting using anti‐HA antibody (middle and lower panel).
- C
Quantification of in vitro phosphorylation assay. Signal of phosphorylated AGO2 was normalized to the AGO2 or EGFP Western blot signal and is shown relative to the WT phosphorylation level. Analysis was performed with three biological replicates (n = 3) and calculated as mean. Error bars represent the SD. P‐values were calculated with a two‐tailed Student's t‐test (not significant [ns] P > 0.05, *P < 0.05, **P < 0.01, ***P < 0.001).
- A
AGO2 single alanine mutants. The mutated residue is shown in red, and the phosphorylated residues are shown in green.
- B
Phosphorylation was quantified by peptide intensities. Percentage of phosphorylation for each residue is shown as the ratio between the intensity of all peptides and the intensity of the phosphorylated peptide. In case of residues that were found phosphorylated in several peptides, the sum of these ratios is shown using the mean of two biological replicates. light green ratio < 2.0, green: ratio < 5, dark green: ratio > 5.
- C
Overview of number of phosphorylated residues per peptide for each mutant. Black: in both replicates, Gray: in only one replicate.
- D, E
Endogenous AGO2 was immunoprecipitated from HEK 293T CK1A1 knockout cells and AGO2 cluster phosphorylation was quantified. (D) CK1A1 knockout was confirmed by Western blotting. (E) Targeted quantification of relative abundance for single phosphorylation at S824 and four times phosphorylation at S824, 828, 831 and 834. For quantification via Selected reaction monitoring, stable isotope‐labeled peptides were spiked into the tryptic digest. Percentual phosphorylation was calculated as fraction of the individual phosphopeptide species assuming the sum of all measured singly, multiply, and non‐phosphorylated peptides to be 100%. Analysis was performed with three biological replicates (n = 3) and calculated as mean. Error bars represent the standard deviation. P‐values were calculated with a two‐tailed Student's t‐test (not significant [ns] P > 0.05, *P < 0.05, ****P < 0.0001).
Similar articles
-
Casein kinase II promotes target silencing by miRISC through direct phosphorylation of the DEAD-box RNA helicase CGH-1.Proc Natl Acad Sci U S A. 2015 Dec 29;112(52):E7213-22. doi: 10.1073/pnas.1509499112. Epub 2015 Dec 15. Proc Natl Acad Sci U S A. 2015. PMID: 26669440 Free PMC article.
-
TEG-1 CD2BP2 controls miRNA levels by regulating miRISC stability in C. elegans and human cells.Nucleic Acids Res. 2017 Feb 17;45(3):1488-1500. doi: 10.1093/nar/gkw836. Nucleic Acids Res. 2017. PMID: 28180320 Free PMC article.
-
A specific type of Argonaute phosphorylation regulates binding to microRNAs during C. elegans development.Cell Rep. 2022 Dec 13;41(11):111822. doi: 10.1016/j.celrep.2022.111822. Cell Rep. 2022. PMID: 36516777 Free PMC article.
-
Regulation and different functions of the animal microRNA-induced silencing complex.Wiley Interdiscip Rev RNA. 2022 Jul;13(4):e1701. doi: 10.1002/wrna.1701. Epub 2021 Nov 1. Wiley Interdiscip Rev RNA. 2022. PMID: 34725940 Review.
-
Transgenerational functions of small RNA pathways in controlling gene expression in C. elegans.Epigenetics. 2014 Jan;9(1):37-44. doi: 10.4161/epi.26795. Epub 2013 Oct 25. Epigenetics. 2014. PMID: 24162759 Free PMC article. Review.
Cited by
-
The structural basis for RNA slicing by human Argonaute2.bioRxiv [Preprint]. 2024 Aug 20:2024.08.19.608718. doi: 10.1101/2024.08.19.608718. bioRxiv. 2024. PMID: 39229170 Free PMC article. Preprint.
-
An RNAi screen for conserved kinases that enhance microRNA activity after dauer in Caenorhabditis elegans.G3 (Bethesda). 2024 Mar 6;14(3):jkae007. doi: 10.1093/g3journal/jkae007. G3 (Bethesda). 2024. PMID: 38226857 Free PMC article.
-
Casein Kinase 1α-A Target for Prostate Cancer Therapy?Cancers (Basel). 2024 Jul 2;16(13):2436. doi: 10.3390/cancers16132436. Cancers (Basel). 2024. PMID: 39001502 Free PMC article. Review.
-
Selecting genes for analysis using historically contingent progress: from RNA changes to protein-protein interactions.bioRxiv [Preprint]. 2024 Oct 19:2024.05.01.592119. doi: 10.1101/2024.05.01.592119. bioRxiv. 2024. Update in: Nucleic Acids Res. 2025 Jan 7;53(1):gkae1246. doi: 10.1093/nar/gkae1246 PMID: 38746289 Free PMC article. Updated. Preprint.
References
-
- Ambros V, Horvitz HR (1984) Heterochronic mutants of the nematode Caenorhabditis elegans . Science 226: 409–416 - PubMed
Publication types
MeSH terms
Substances
Associated data
- Actions
Grants and funding
LinkOut - more resources
Full Text Sources
Molecular Biology Databases

