. 2023 Sep 13;31(9):1507-1522.e5.
doi: 10.1016/j.chom.2023.08.006.

Spontaneous HIV expression during suppressive ART is associated with the magnitude and function of HIV-specific CD4+ and CD8+ T cells

Affiliations

Spontaneous HIV expression during suppressive ART is associated with the magnitude and function of HIV-specific CD4+ and CD8+ T cells

Mathieu Dubé et al. Cell Host Microbe. .

Abstract

Spontaneous transcription and translation of HIV can persist during suppressive antiretroviral therapy (ART). The quantity, phenotype, and biological relevance of this spontaneously "active" reservoir remain unclear. Using multiplexed single-cell RNAflow-fluorescence in situ hybridization (FISH), we detect active HIV transcription in 14/18 people with HIV on suppressive ART, with a median of 28/million CD4+ T cells. While these cells predominantly exhibit abortive transcription, p24-expressing cells are evident in 39% of participants. Phenotypically diverse, active reservoirs are enriched in central memory T cells and CCR6- and activation-marker-expressing cells. The magnitude of the active reservoir positively correlates with total HIV-specific CD4+ and CD8+ T cell responses and with multiple HIV-specific T cell clusters identified by unsupervised analysis. These associations are particularly strong with p24-expressing active reservoir cells. Single-cell vDNA sequencing shows that active reservoirs are largely dominated by defective proviruses. Our data suggest that these reservoirs maintain HIV-specific CD4+ and CD8+ T responses during suppressive ART.

Keywords: HIV; HIV-specific CD4 T cell responses; HIV-specific CD8 T cell responses; antiretroviral therapy; flow cytometric fluorescence in situ RNA hybridization; spontaneously active reservoirs; viral reservoirs; viral transcription; viral translation.


Conflict of interest statement

Declaration of interests The authors declare no competing interests.

Figures

Figure 1:
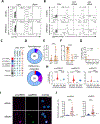
Figure 1:. Spontaneous vRNA expression by HIV reservoirs in ART-suppressed PWH.
(A) vRNA probeset designs. (B) Quantification of vRNA+ cells in purified CD4+ T cells from ART-treated PWH and uninfected (UD) as controls. Cells were either unstimulated or treated ex vivo with PMA/ionomycin for 15h. Two statistical tests are shown: Mann-Whitney for cohort comparisons and Wilcoxon between stimulations. (C) Comparison between four different types of viral reservoir measurements. Numbers below indicate the median fold increase between groups. (D) The proportion of inducible and spontaneous vRNA+ reservoirs using integrated DNA as denominator. A Wilcoxon test was performed, shown above. Median values are shown below. (E-G) Correlations between (E) spontaneous reservoirs and total DNA, (F) spontaneous reservoirs and integrated DNA, (G) spontaneous and inducible reservoirs, with r and p values from Spearman tests. (H) Correlations between reservoirs metrics and indicated clinical parameters. CD4 and CD8 stand for CD4+ and CD8+ T cell clinical counts. Values in the heat map indicate r values, with p values underneath: * <0.05, ** <0.01, *** <0.001. The shade of colors indicates the r value. N=18. In B and D, the histograms indicate the median, and the error bars illustrate the interquartile range
Figure 2:
Figure 2:. Spontaneously active reservoirs are enriched in short vRNA transcripts.
(A-B) Gating strategy to assess: (A) p24 expression in vRNA+ cells, and (B) gagRNA and polRNA co-expression in p24 or p24+ vRNA+ cells. (C) List of the theoretical vRNA+ populations. (D) Donut charts presenting the median proportions of each vRNA+ subpopulation for spontaneous or PMA/ionomycin-induced reservoirs, as colored in C. Numbers in the donut holes represent the median vRNA+ / 106 CD4+. (E) The proportion of p24+ cells in spontaneous compared to PMA/ionomycin-induced vRNA+ reservoirs. The frequency of participants with p24+ cell detection is indicated underneath. (F) Compared frequencies of spontaneous vRNA+ and p24+ cells. The median of the 7 participants in which p24 was spontaneously detected is shown. (G) Correlation between p24+ cells in unstimulated and PMA/ionomycin-induced conditions. (H) Violin plots showing total single-cell fluorescence intensities in 18 participants. (E,F) The bars indicate the median. The error bars illustrate the interquartile range. Results from Wilcoxon tests are shown above. N=18 (excepted for panel E, where n=16 because <5 vRNA+ events). (I) Representative maximal intensity of confocal microscopy projections from Z-stacks of vRNA and vRNA+ sorted cells. (J) Number of spots per cell for exonRNA (left) and gagRNA (right) probes. The results from a Mann-Whitney test are shown above. False-positive rates are indicated by the dashed lines.
Figure 3:
Figure 3:. Near full-length single-cell vDNA sequencing of spontaneously active viral reservoirs identifies underlying proviral defects.
Purified CD4+ T cells from 3 ART-treated participants were co-stained by multiplexed HIV-1 RNAflow-FISH. vRNA+ cells were individually sorted for nested PCR amplification and near full-length sequencing. (A) Phylogenetic trees for the three participants PWH3, PWH5 and PWH9 built from the entire amplified area sequenced based on maximum likelihood. Sequences with 100% identity are boxed in gray. (B) List of the different defects found in the 36 proviral sequences, aligned on the HxB2 genome. The type of defect is color coded, based on the legend presented below.
Figure 4:
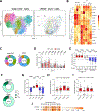
Figure 4:. Spontaneously active viral reservoirs are phenotypically diverse.
(AB) Global Uniform manifold approximation and projection (UMAP) for dimension reduction map of all 1418 vRNA+ cells. These cells were embedded among downsampled 3000 CD4+ per donor to help identify stable population clusters. (A) All 8 clusters are identified. (B) Individual CD4 (left) and vRNA+ (right) UMAP are shown. Contours show the density of vRNA+ cells. (C) Heat map showing an unsupervised hierarchical clustering of the 8 clusters, defined by MFI. (D) The donut charts present the proportion of each cluster for the indicated population, with color matching with panel A. The total number of events used to generate the plot are indicated in the donut holes. (E) The histogram presents the proportion of each cluster, with a side-by-side comparison between CD4 and vRNA+ cells. Wilcoxon tests are shown. (F) The enrichment score for each cluster is calculated as the log of the ratios between vRNA+ / CD4 cluster proportions. (G) Donut charts presenting the median proportions of each memory vRNA+ subpopulation for spontaneous or PMA/ionomycin-induced reservoirs. (H-J) Enrichment scores for univariate analysis of (H) memory, (I) polarization and (J) activation subsets. The enrichment scores were calculated as in (F). In EF and H-J. (K) Correlations between PMA/ionomycin or Panobinostat+ingenol inducible reservoirs and each active vRNA+ cluster. Values and the shade of color indicate r values. P values are shown underneath: * p <0.05, ** p <0.01, *** p <0.001. In E,F,H-J, the histograms indicate the median, and the error bars illustrate the interquartile range.
Figure 5:
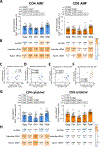
Figure 5:. Associations between spontaneously active reservoirs and HIV-specific CD4+ and CD8+ T cell responses.
(A) Net magnitude of HIV-specific CD4+ and CD8+ T cells by AIM assay. (B) Heat map reporting the associations between AIM+ CD4+ and CD8+ T responses and integrated DNA, inducible and spontaneous reservoirs. (C-E) Correlations between net AIM+ CD4+ responses and (C) integrated DNA, (D) inducible reservoirs, (E) spontaneous reservoirs. (F) Correlation between net AIM+ CD8+ T cell responses and spontaneous reservoirs. (G) Net magnitude of HIV-specific CD4+ and CD8+ T cells defined by the ICS. (H) Heat map reporting the associations between cytokine+ CD4+ and CD8+ T responses and integrated DNA, inducible and spontaneous reservoirs. (A,B,G,H) Peptide pools used to stimulate PMBCs are indicated. “HIV” responses were inferred by the sum of Gag, Pol, Env, and Nef net responses. In A and G, net magnitudes after background subtraction are shown. The bars indicate the median, and the error bars illustrate the interquartile range. The results from a Friedman test are shown above. In B and H, R and p (Spearman) values are shown. p <0.05, ** p <0.01, *** p <0.001. N=16 (1 participant had <5 vRNA+ cells, therefore could not be phenotyped).
Figure 6:
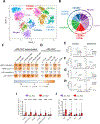
Figure 6:. A subset of active reservoirs display strong links to HIV-specific CD4+ and CD8+ T cell responses.
(A) Global Uniform manifold approximation and projection (UMAP) for dimension reduction map of HIV-specific AIM+ CD4 T cells. 15 clusters were identified and regrouped in 6 superclusters. (B) Median proportions of each cluster, regrouped by superclusters. (C-D) Heat map showing correlations between (C) vRNA+ cluster frequencies and net magnitudes of AIM+ CD4+, regrouped by superclusters, or (D) vRNA+ cluster frequencies and net magnitudes of AIM+ CD8+ T cells. P values from Spearman test are shown, with significance underneath. * : p <0.05, ** p <0.01, *** p <0.001. (E-F) Correlations between the inducible or spontaneous vRNA+ reservoir and the magnitude of cells in (E) AIM+ HIV-specific CCR6+ CD4+ T supercluster, (F) AIM+ HIV-specific CXCR3+ CD4+ T supercluster. (G-H) Correlations between the inducible or spontaneous p24+ reservoir and the magnitude of cells in (G) total AIM+ HIV-specific CD4+, and (H) total AIM+ HIV-specific CD8+ T cells. Spearman tests were performed. R and p values are shown. (IJ) Histogram comparing median HIV-specific AIM+ (I) CD4 and (J) CD8 T responses in people where p24+ cells were detectable in peripheral blood (n=5) or were not (n=11). Mann-Whitney tests are shown above. Error bars indicate the interquartile range. N=16 (1 participant had <5 vRNA+ cells, therefore could not be phenotyped).

Similar articles

Cited by

References

    1. Davey RT Jr., Bhat N, Yoder C, Chun TW, Metcalf JA, Dewar R, Natarajan V, Lempicki RA, Adelsberger JW, Miller KD, et al. (1999). HIV-1 and T cell dynamics after interruption of highly active antiretroviral therapy (HAART) in patients with a history of sustained viral suppression. Proceedings of the National Academy of Sciences of the United States of America 96, 15109–15114. 10.1073/pnas.96.26.15109. - DOI - PMC - PubMed
    1. Baxter AE, O’Doherty U, and Kaufmann DE (2018). Beyond the replication-competent HIV reservoir: transcription and translation-competent reservoirs. Retrovirology 15, 18. 10.1186/s12977-018-0392-7. - DOI - PMC - PubMed
    1. Gaebler C, Lorenzi JCC, Oliveira TY, Nogueira L, Ramos V, Lu CL, Pai JA, Mendoza P, Jankovic M, Caskey M, and Nussenzweig MC (2019). Combination of quadruplex qPCR and next-generation sequencing for qualitative and quantitative analysis of the HIV-1 latent reservoir. The Journal of experimental medicine 216, 2253–2264. 10.1084/jem.20190896. - DOI - PMC - PubMed
    1. Bruner KM, Wang Z, Simonetti FR, Bender AM, Kwon KJ, Sengupta S, Fray EJ, Beg SA, Antar AAR, Jenike KM, et al. (2019). A quantitative approach for measuring the reservoir of latent HIV-1 proviruses. Nature 566, 120–125. 10.1038/s41586-019-0898-8. - DOI - PMC - PubMed
    1. Procopio FA, Fromentin R, Kulpa DA, Brehm JH, Bebin AG, Strain MC, Richman DD, O’Doherty U, Palmer S, Hecht FM, et al. (2015). A Novel Assay to Measure the Magnitude of the Inducible Viral Reservoir in HIV-infected Individuals. EBioMedicine 2, 874–883. 10.1016/j.ebiom.2015.06.019. - DOI - PMC - PubMed

LinkOut - more resources