. 2023 Nov 8;8(21):e172051.
doi: 10.1172/jci.insight.172051.

Mice lacking γENaC palmitoylation sites maintain benzamil-sensitive Na+ transport despite reduced channel activity

Affiliations

Mice lacking γENaC palmitoylation sites maintain benzamil-sensitive Na+ transport despite reduced channel activity

Andrew J Nickerson et al. JCI Insight. .

Abstract

Epithelial Na+ channels (ENaCs) control extracellular fluid volume by facilitating Na+ absorption across transporting epithelia. In vitro studies showed that Cys-palmitoylation of the γENaC subunit is a major regulator of channel activity. We tested whether γ subunit palmitoylation sites are necessary for channel function in vivo by generating mice lacking the palmitoylated cysteines (γC33A,C41A) using CRISPR/Cas9 technology. ENaCs in dissected kidney tubules from γC33A,C41A mice had reduced open probability compared with wild-type (WT) littermates maintained on either standard or Na+-deficient diets. Male mutant mice also had higher aldosterone levels than WT littermates following Na+ restriction. However, γC33A,C41A mice did not have reduced amiloride-sensitive Na+ currents in the distal colon or benzamil-induced natriuresis compared to WT mice. We identified a second, larger conductance cation channel in the distal nephron with biophysical properties distinct from ENaC. The activity of this channel was higher in Na+-restricted γC33A,C41A versus WT mice and was blocked by benzamil, providing a possible compensatory mechanism for reduced prototypic ENaC function. We conclude that γ subunit palmitoylation sites are required for prototypic ENaC activity in vivo but are not necessary for amiloride/benzamil-sensitive Na+ transport in the distal nephron or colon.

Keywords: Cell Biology; Epithelial transport of ions and water; Ion channels; Nephrology.


Conflict of interest statement

Conflict of interest: The authors have declared that no conflict of interest exists.

Figures

Figure 1
Figure 1. Schematic for the γC33A,C41A mouse genotype.
(A) Amino acid (upper) and nucleotide (lower) partial sequences of mouse γ subunit’s N-terminal region. CRISPR-mediated cysteine to alanine mutations are shown in red. (B) Genotyping of WT and γC33A,C41A mice, showing PCR products after digestion with Mlul1 (see Methods for details). DNA ladder and corresponding molecular weights are shown to the left. (C) Cartoon depicting the locations of putative palmitoylation sites, C33 and C41, within γ subunit’s N-terminal region (α helices within the γ subunit are depicted in red; α and β subunits are translucent).
Figure 2
Figure 2. Baseline ENaC activity is reduced in split-open cortical connecting tubules /collecting ducts (CNT/CCDs) from γC33A,C41A versus WT mice.
(A and B) Representative recordings from cell-attached patches of principal cell (PC) apical membranes in split-open CNT/CCDs from WT (A) and γC33A,C41A (B) mice maintained on a standard chow diet. Channel closed (C) and open (O) states are depicted to the right of each recording. (CE) Total channel activity (NPO; C), number of observed channels per patch (N; D), and single-channel open probability (PO: E) in apical membrane patches from WT (n = 9) and γC33A,C41A mice (n = 10). Data from male and female mice are shown as black and white circles, respectively. Lines and error bars represent mean ± SD. NPO, N, and PO data were analyzed via Student’s unpaired t test.
Figure 3
Figure 3. Baseline ENaC α and γ subunit expression is similar between WT and γC33A,C41A mice.
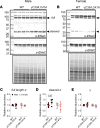
(A and B) Representative Western blot images showing the detection of ENaC subunits in kidney homogenates from male (A) and female (B) WT and γC33A,C41A mice maintained on a standard chow diet. Standard molecular weight markers are shown in the far-left lane, along with corresponding weights, in kDa. Full-length α subunit, as well as the cleaved N-terminal fragment, are indicated by arrows and arrowheads, respectively. Stain-free gel images showing total protein content for each sample are shown below blots. (CE) Densitometric quantification of full-length α subunit (C), cleaved α subunit (D), and γ subunit (E) was performed by first normalizing to the total protein signal for each sample, then transforming the data such that WT values were set equal to 1 (WT and γC33A,C41A males, n = 6; WT and γC33A,C41A females, n = 5). Lines and error bars represent mean ± SD. Comparisons were made via Student’s unpaired t test for each sex.
Figure 4
Figure 4. Dietary Na+ restriction induces higher aldosterone levels in male γC33A,C41A compared with male WT mice.
(A and B) Body weight (A) and total body water percentage (B) measured in WT (squares) and ENaCγC33A,C41A mice (triangles) of both sexes during 7 consecutive days on low-Na+ (<0.01%) diet (n = 9 for WT, n = 11 γC33A,C41A). (C) Plasma aldosterone levels measured in WT versus γC33A,C41A mice after 8 days of dietary Na+ depletion (n = 9 for WT male, n = 6 for γC33A,C41A male, n = 5 for WT female, n = 7 for γC33A,C41A female). Data from male and female mice are shown as black and white circles, respectively. Lines and error bars represent mean ± SD. Time course percentage starting body weight and percentage body water measurements were compared via 2-way ANOVA with repeated measures. No significant differences were found regarding body weight or water content between the groups. Endpoint aldosterone levels were assessed via 2-way ANOVA and multiple comparisons made with Tukey’s post hoc analysis.
Figure 5
Figure 5. CNT/CCD ENaC activity in γC33A,C41A mice remains low under dietary Na+ restriction.
(A and B) Representative recordings from cell-attached patches of PC apical membranes in split-open CNT/CCDs from WT (A) and γC33A,C41A mice (B) maintained on a low-Na+ (<0.01%) diet. Channel closed (C) and open (O) states are depicted to the right of each recording. (CE) Total channel activity (NPO; C), number of observed channels per patch (N; D), and single-channel open probability (PO: E) in apical membrane patches from WT (n = 10) and γC33A,C41A (n = 11) mouse collecting ducts. Data from male and female mice are shown as black and white circles, respectively. Lines and error bars represent mean ± SD. NPO, N, and PO data were analyzed via Student’s unpaired t test.
Figure 6
Figure 6. ENaC activity in the DCT2/CNT is reduced in γC33A,C41A mice under dietary Na+ restriction.
(A and B) Representative recordings from cell-attached patches of DCT2/CNT cell apical membranes from male WT (A) and γC33A,C41A mice (B) maintained on a low-Na+ (<0.01%) diet. Channel closed (C) and open (O) states are depicted to the right of each recording. (CE) Total channel activity (NPO; C), number of observed channels per patch (N; D), and single-channel open probability (PO; E) in apical membrane patches from WT (n = 10) and γC33A,C41A (n = 9) mouse DCT2/CNTs. Lines and error bars represent mean ± SD. NPO, N, and PO data were analyzed via Student’s unpaired t test.
Figure 7
Figure 7. Expression and cleavage pattern of the γ subunit is similar between Na+-restricted WT and γC33A,C41A mice.
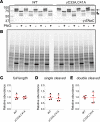
(A) Western blot image showing cleavage fragments of the γ subunit after treating samples with (+) or without (-) PNGase F to remove N-linked sugar residues. Standard molecular weight markers are shown in the far-left lane, along with corresponding weights, in kDa. Arrow indicates the full, uncleaved fragment. Single and double arrowheads indicate proximally (furin) and distally (presumably double) cleaved fragments, respectively. All samples were from male mice maintained for 8 days on a low-Na+ diet. (B) Stain-free gel image showing total protein content for each sample. Dark bands appearing in the stain-free gel image correspond to PNGase enzyme (~36 kDa) in the sample preparation. Densitometric quantification of full-length (C) and furin (D) distally cleaved γ subunit (E) was performed as described above (n = 4 for WT and γC33A,C41A mice). Lines and error bars represent mean ± SD. Statistical comparisons were made via Student’s unpaired t test.
Figure 8
Figure 8. Expression of upstream Na+ transport proteins is similar between Na+-restricted WT and γC33A,C41A mice but varies by sex.
(A, C, and E) Western blot images showing expression of Thr-53 phosphorylated Na+,Cl co-transporter (p-NCC; A), total NCC (C), and Na+, K+, 2Cl co-transporter (NKCC2; E) proteins from whole-kidney lysates of WT and γC33A,C41A mice of both sexes (n = 4 for each group). Data from male and female mice are shown as black and white circles, respectively. Standard molecular weight markers are shown in the far-left lane, along with corresponding weights, in kDa. Stain-free gel images showing total protein content for each sample are shown below each blot. All mice were maintained for 8 days on a low-Na+ diet. (B, D, and F) Densitometric quantification of p-NCC (B), total NCC (D), and NKCC2 (E) was performed as described above. Lines and error bars represent mean ± SD. Statistical comparisons were made via 2-way ANOVA with Tukey’s post hoc analysis.
Figure 9
Figure 9. Responses of WT and γC33A,C41A mice to K+ loading.
(A and B) Blood K+ (A) and plasma aldosterone levels (B) measured from WT and γC33A,C41A (n = 13 and 15, respectively for A; n = 10 and 11, respectively for B) male mice maintained on a 10% KCl diet for 8 days. Lines and error bars represent mean ± SD. Statistical comparisons were made via Student’s unpaired t test. (C) Blood K+ levels measured following an acute oral gavage of 150 μL 5% KCl solution in WT (n = 6) and γC33A,C41A (n = 6) mice maintained on a standard chow diet. Sequential measurements were taken at 30- and 60-minute time points postgavage. Statistical comparison was made with 2-way ANOVA with repeated measures. No difference between genotypes was observed.
Figure 10
Figure 10. WT and γC33A,C41A mice exhibit robust benzamil-sensitive natriuresis following dietary Na+ restriction.
(AD) Body weight (A), daily urine output (B) and urinary Na+ (C) and K+ excretion (D) recorded from male WT (squares; n = 6) and γC33A,C41A mice (triangles; n = 6) over the course of 4 days on a low-Na+ diet. No statistical differences were detected for any parameter by 2-way ANOVA with repeated measures. (EG) Urinary Na+ (E), K+ (F), and Cl (G) excretion from WT (n = 5) and γC33A,C41A (n = 5) mice in response to 1.5 mg/kg benzamil injection. Urines were collected over the first 3 hours following benzamil administration. (H) Plasma aldosterone levels measured in WT (n = 6) and γC33A,C41A (n = 6) mice following the benzamil injection experiment. Lines and error bars represent mean ± SD. Comparisons were made via 2-way ANOVA with repeated measures (AD) or Student’s unpaired t test (EH).
Figure 11
Figure 11. WT and γC33A,C41A mice exhibit amiloride-sensitive Na+ transport in the distal colon.
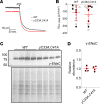
(A) Representative short-circuit current (ISC) recordings of distal colons obtained from WT (black) and ENaCγC33A,C41A mice (red) maintained for 8 days on low-Na+ diet. Where indicated 100 μM amiloride was added to the apical chamber bath. (B) Amiloride-sensitive ISC measured in WT (n = 13) and γC33A,C41A (n = 12) mouse distal colons. Data from male and female mice are shown as black and white circles, respectively. (C) Representative Western blot images showing the detection of the γENaC subunit in colon mucosal homogenates from male WT (n = 4) and γC33A,C41A (n = 4) mice maintained on a low-Na+ diet for 8 days. Standard molecular weight markers are shown in the far-left lane, along with corresponding weights, in kDa. Stain-free gel image showing total protein content for each sample is also provided. (D) Densitometric quantitation of γ subunit abundance was performed as described above. Lines and error bars represent mean ± SD. Statistical comparisons were made via Student’s unpaired t test and no significant differences were detected.
Figure 12
Figure 12. Presence of a benzamil-sensitive, 20 pS apical membrane conductance in CNT/CCDs of both WT and γC33A,C41A mice.
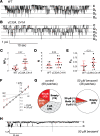
(A and B) Representative recordings from cell-attached patches of PC apical membranes in split-open CNT/CCDs from WT (A) and γC33A,C41A mice (B) maintained on a low-Na+ diet for 8 days. Channel “closed” (C) and “open” (O) states are depicted to the right of each recording. (CE) Total channel activity (NPO; C), number of observed channels per patch (N; D), and single-channel open probability (PO: E) in apical membrane patches from WT (n = 10) and γC33A,C41A (n = 12) mouse CNT/CCDs. Data from male and female mice are shown as black and white circles, respectively. (F) Current/voltage relationship of 8 pS and 20 pS channels observed in CNT/CCD apical membrane patches with Li+ in the patch pipette. (G) Frequency of channel appearances for both 8 and 20 pS conductance populations in the absence (left) or presence (right) of 50 μM benzamil in the bath and patch pipette solutions. (H) Representative recording of a 20 pS channel from a WT male mouse in the presence of benzamil, illustrating diminishing channel activity over time.

Similar articles

Cited by

References

    1. Rotin D, Staub O. Function and regulation of the epithelial Na+ channel ENaC. Compr Physiol. 2021;11(3):2017–2045. doi: 10.1002/cphy.c200012. - DOI - PubMed
    1. Palmer LG, Schnermann J. Integrated control of Na transport along the nephron. Clin J Am Soc Nephrol. 2015;16(4):676–687. doi: 10.2215/CJN.12391213. - DOI - PMC - PubMed
    1. Mutchler SM, et al. Epithelial sodium channel and salt-sensitive hypertension. Hypertension. 2021;77(3):759–767. doi: 10.1161/HYPERTENSIONAHA.120.14481. - DOI - PMC - PubMed
    1. Rossier BC. Epithelial sodium channel (ENaC) and the control of blood pressure. Curr Opin Pharmacol. 2014;15:33–46. doi: 10.1016/j.coph.2013.11.010. - DOI - PubMed
    1. Palmer LG, Frindt G. Amiloride-sensitive Na channels from the apical membrane of the rat cortical collecting tubule. Proc Natl Acad Sci U S A. 1986;83(8):2767–2770. doi: 10.1073/pnas.83.8.2767. - DOI - PMC - PubMed