. 2023 Nov 6;220(11):e20231154.
doi: 10.1084/jem.20231154. Epub 2023 Sep 12.

NK cell expansion requires HuR and mediates control of solid tumors and long-term virus infection

Affiliations

NK cell expansion requires HuR and mediates control of solid tumors and long-term virus infection

Sytse J Piersma et al. J Exp Med. .

Abstract

Natural killer (NK) cells are lymphocytes capable of controlling tumors and virus infections through direct lysis and cytokine production. While both T and NK cells expand and accumulate in affected tissues, the role of NK cell expansion in tumor and viral control is not well understood. Here, we show that posttranscriptional regulation by the RNA-binding protein HuR is essential for NK cell expansion without negatively affecting effector functions. HuR-deficient NK cells displayed defects in the metaphase of the cell cycle, including decreased expression and alternative splicing of Ska2, a component of the spindle and kinetochore complex. HuR-dependent NK cell expansion contributed to long-term cytomegalovirus control and facilitated control of subcutaneous tumors but not tumor metastases in two independent tumor models. These results show that posttranscriptional regulation by HuR specifically affects NK cell expansion, which is required for the control of long-term virus infection and solid tumors, but not acute infection or tumor metastases, highlighting fundamental differences with antigen-specific T cell control.


Conflict of interest statement

Disclosures: The authors declare no competing interests exist.

Figures

None
Graphical abstract
Figure 1.
Figure 1.
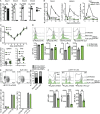
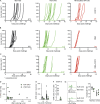
NK cells specifically express Elavl1 encoding HuR that is required for expansion and formation of adaptive NK cells, but not effector functions in response to MCMV infection. (A) Expression of Elavl family member transcripts in purified NK cells and brain. Statistics represent unpaired t tests with Bonferroni-Dunn correction from two independent experiments, totaling three to four mice per group. (B) Number of NK cells in blood, spleen, and liver in response to MCMV infection. Statistics indicate the comparison of HuR CKO with littermate NK cells at the indicated day after infection. PBL, peripheral blood leukocytes. Data are cumulative from six independent experiments totaling 4–11 mice per group per time point, with at least two independent experiments per time point. Statistics indicate two-way ANOVA with Bonferroni correction. (C) Weight loss and viral load in HuR CKO and littermate mice in response to MCMV infection. Viral load was measured by qPCR on day 5 p.i.; the dotted line indicates limit of detection. Cumulative data of two independent experiments for each panel totaling 9–12 mice per group. Statistics for weight loss were calculated using two-way ANOVA with Bonferroni correction, and for viral load unpaired t tests were used. (D) Expression of the effector molecules perforin, granzyme B (GzmB), IFNγ, and CD69 by splenic NK cells at 36 h after MCMV infection. Representative data from two independent experiments with two to three mice per group. Statistics are unpaired t tests with Bonferroni-Dunn correction. (E) Expression of maturation markers CD27 and CD11b on splenic NK cells at 5 d after MCMV infection. Representative data from two independent experiments with three to five mice per group. (F) Expression levels of adaptive NK cell markers Ly49H, Ly6C, and KLRG1 at day 21 p.i. by splenic NK cells. Representative data from two independent experiments with four mice per group. Unpaired t tests with Bonferroni-Dunn correction were used for statistics. (G) Degranulation measured by CD107a staining and IFNγ production by HuR-WT and HuR CKO NK cells in response to stimulation with C57BL/6 or m157-Tg cells in the presence of IL-12 where indicated. Representative of two independent experiments with duplicates. MFI, median fluorescent intensity. Error bars indicate SEM; ns, not significant; *P < 0.05, **P < 0.01, ***P < 0.001, and ****P < 0.0001.
Figure S1.
Figure S1.
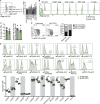
HuR expression in NK cells and steady state phenotype of HuR CKO NK cells. (A) Expression of HuR in NK cells in response to stimulation with plate-bound antibody or indicated cytokines for 1 d. Representative of two experiments in triplicate. (B) HuR expression by splenic lymphocytes in HuR CKO and littermate control mice. Filled histograms show HuR staining and open histograms indicate isotype control. Representative of two independent experiments. (C) Peripheral blood and splenic NK cell numbers in HuR CKO and littermates analyzed by flow cytometry. Cumulative of two experiments totaling four to six mice per group. (D) Maturation of splenic NK cells measured by CD27 and CD11b staining. (E) Receptor repertoire on splenic NK cells in HuR CKO and littermate control mice. Cumulative of two experiments totaling four to six mice per group. Statistics were calculated using unpaired t tests with Bonferroni correction. Error bars indicate SEM; ns: not significant, *P < 0.05, **P < 0.01, ***P < 0.001, and ****P < 0.0001. MFI, median fluorescent intensity.
Figure S2.
Figure S2.
HuR expression and function of HuR-deficient NK cells during MCMV infection. (A) HuR expression by splenic C57BL/6 NK cells at indicated day after infection, analyzed by flow cytometry. Representative of two independent experiments with three mice per time point. (B) Number of splenic NK cells in Ncr1 cre/wt × HuR fl/wt and littermate Ncr1 wt/wt × HuR fl/wt control mice at 7 d after MCMV infection. (C) Competitive expansion of HuR CKO (left) or littermate control with congenic CD45.1 WT NK cells transferred into Ly49H-deficient hosts and subsequently infected with MCMV. Representative of two independent experiments with three to five mice per group. (D) Analysis of MCMV m157 sequences in spleens of RAG HuR CKO and RAG littermate mice that succumbed to MCMV infection. Cumulative of two independent experiments totaling nine mice per group with 10 m157 sequences analyzed per mouse. Statistics were calculated using unpaired t tests with Bonferroni correction. Error bars indicate SEM; ns: not significant, *P < 0.05, and **P < 0.01. MFI, median fluorescent intensity.
Figure 2.
Figure 2.
Rag-deficient HuR CKO mice have increased organ-specific susceptibility to MCMV infection at later time points. (A and B) Numbers of NK cells in spleen and liver at day 5 (A) and day 12 (B) p.i., with each panel representing an independent experiment with four to seven mice per group. Statistics represent unpaired t tests with Bonferroni-Dunn correction. (C and D) Weight loss (C) and survival (D) in RAG HuR CKO and RAG littermate mice after i.p. infection with MCMV. Cumulative data of three independent experiments totaling 13–14 mice per group. Statistics for weight loss were calculated using two-way ANOVA with Bonferroni correction and indicate a comparison of HuR CKO RAG1 with littermate RAG1 NK cells at the indicated day p.i. Survival statistics were calculated using Log-rank (Mantel-Cox) tests. (E and F) Viral load in indicated organs at day 5 (E) and day 16 (F) p.i. analyzed by qPCR. Each panel is cumulative data from two independent experiments totaling four to nine mice per group. Statistics were calculated with unpaired t tests with Bonferroni-Dunn correction. Error bars indicate SEM; ns, not significant; **P < 0.01, ***P < 0.001, and ****P < 0.0001.
Figure 3.
Figure 3.
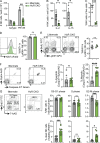
Activated HuR-deficient NK cells have defective proliferation, resulting from increased cell death. (A) Purified NK cells were stimulated with indicated plate-bound antibody in the presence of low-dose IL-2, and the number of NK cells was analyzed after 4 d by flow cytometry using counting beads. Representative of two independent experiments with three mice per group. (B) Purified HuR WT or HuR CKO NK cells were expanded with high-dose IL-2 or IL-15. Representative of two independent experiments with three mice per group. (C) Purified NK cells were transferred to Rag2−/−Il2rg−/−; 14 d after transfer, NK cells were quantified in the liver. Representative of two independent experiments with four mice per group. (D and E) Mice were infected with MCMV, and at day 5 p.i. mice were pulsed with BrDU i.p. for 3 h, after which NK cells were analyzed for Ki67 (D) and BrdU incorporation (E) in the spleen by flow cytometry. Representative of two independent experiments with three to five mice per group. (F) Mice were infected with MCMV, and after 3 d, NK cells were analyzed for apoptosis and cell death by flow cytometry. Cumulative of two independent experiments totaling seven to eight mice per group. (G) HuR WT or HuR CKO splenocytes were expanded with high-dose IL-2; after 4 d, cells were pulsed with BrDU for 1 h, after which cell cycle and viability in NK cells were analyzed by flow cytometry. Cumulative of two independent experiments totaling four to five mice per group in duplicate. Statistics were calculated with unpaired t tests. Error bars indicate SEM; ns, not significant; *P < 0.05, **P < 0.01, ***P < 0.001, and ****P < 0.0001.
Figure 4.
Figure 4.
Transcriptomic and eCLIP analysis of WT and HuR-deficient NK cells derived from MCMV-infected mice. (A and B) Venn diagram (A) and gene ontology (B) of gene expression and alternative splicing changes on MCMV infection in littermate control NK cells. (C) Overlap of gene expression changes on MCMV infection in NK cells with changes due to loss of HuR in infected mice. (D) Heatmap showing a decrease in the expression of proliferation genes upon loss of HuR in MCMV infection. (E) Schematic for eCLIP experiment for HuR in NK cells from MCMV infection. (F) Distribution of HuR-binding peaks in the genome and across the gene body. (G) Frequency plot for nucleotide residues found at HuR crosslinking sites in the RNA. (H) Genes downregulated upon HuR loss in MCMV infection are found by HuR in 3′UTR, and among these about one half of the proliferation genes are also bound by HuR in 3′UTR regions.
Figure 5.
Figure 5.
Ska2 is aberrantly spliced in HuR-deficient NK cells, which causes decreased NK cell expansion. (A) Splenic NK cells were sorted from day 3 MCMV-infected animals and relative mRNA copy number was analyzed by TaqMan qPCR. Cumulative data from two independent experiments totaling five to six mice per group. (B) Sashimi plot displaying Ska2 mRNA splicing in HuR CKO and littermate control NK cells. Sashimi plots are representative of the splicing dataset. (C) PCR along exon 1 to exon 4 of Ska2 to analyze alternative splicing in splenic NK cells isolated from day 3 MCMV-infected animals. The band intensity of different isoforms was analyzed using image lab software. Representative data from two independent experiments with three mice per group. M, marker. (D) The nucleotide sequences of gel-excised bands were analyzed by Sanger sequencing. (E) Cartoon representation of the structure of the Ska core complex using PDB 4aj5. Indicated in red is the portion of Ska2 encoded by exon 2 in 1 out of 10 Ska2 molecules within the Ska complex. (F and G) C57BL/6 splenocytes were electroporated with Cas9 and specific gRNAs and cultured with IL-15 for 4 d. NKp46+CD3CD19 NK cells were analyzed for NK1.1 expression (F) and cell number (G). Representative data from two independent experiments with three mice per group. Statistics were calculated with unpaired t tests. Error bars indicate SEM; ns, not significant; *P < 0.05, **P < 0.01, and ****P < 0.0001. Source data are available for this figure: SourceData F5.
Figure 6.
Figure 6.
HuR-dependent NK cell expansion is required for primary tumor control but is dispensable for elimination of tumor metastases. (A) Mice were either untreated or NK cells were depleted with anti-NK1.1 (PK136). B16F10 melanoma cells were injected i.v. After 14 d, lungs were harvested and metastases were counted in a blinded manner. Scale bar indicates 10 mm. Cumulative of two independent experiments with 4–12 mice per group. Statistics represent unpaired t test. (B) B16F10 melanoma cells were injected s.c., and tumor growth was monitored; mice were sacrificed when tumor size was larger than 1,000 mm3. Mice were either untreated or NK cells were depleted with anti-NK1.1 (PK136). Survival of indicated groups is shown over time. Cumulative of two independent experiments with 6–13 mice per group and statistics are from Log-rank (Mantel-Cox) test. (C and D) MHC-I–sufficient RMA cells (C) or MHC-I–deficient RMA.ΔTAP2 cells (D) were s.c. injected and survival was monitored as in B. Both panels are cumulative of two independent experiments with 5–13 mice per group and statistics are from Log-rank (Mantel-Cox) test. (E) RMA.ΔTAP2.YFP cells were injected i.v. After 14 d, lungs were harvested and metastases were quantified using flow cytometry. Cumulative of two independent experiments with 5–12 mice per group. Statistics represent unpaired t test. (F–H) The number (F) and phenotype (G and H) of tumor-infiltrating NK cells in mice challenged s.c. with RMA.ΔTAP2 cells was analyzed by flow cytometry at day 14–21 after challenge. Cumulative of two independent experiments with eight to nine mice per group. Statistics represent unpaired t tests. Panels G and H were corrected for multiple testing using Bonferroni-Dunn. Error bars indicate SEM; ns, not significant; *P < 0.05, and ****P < 0.0001.
Figure S3.
Figure S3.
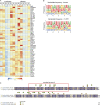
Gene expression and HuR-binding consensus sequences in NK cells in response to MCMV infection and interactions of Ska2 with Ska1 and Ska3. (A) Heatmap of differentially expressed genes associated with cell cycle and immune pathways. (B) Frequency plot for nucleotide residues found at HuR crosslinking sites in RNA, divided by introns and 3′UTRs. (C) Mouse and human SKA2 sequences were alined using UniProt (https://www.uniprot.org/align). The region of Ska2 that is encoded by exon 2 is marked by the red box. In green and yellow the amino acids that interact with Ska1 and Ska3, respectively, are indicated as published by Jeyaprakash et al. (2012).
Figure S4.
Figure S4.
Tumor outgrowth in HuR CKO mice. (A–C) Tumor outgrowth in individual mice challenged s.c. with B16F10 (A), RMA (B), and RMA.ΔTAP2 (C). Above the x axis, the number of mice without a tumor at the end of the experiments versus the total mice in that group is indicated. Ulcerating tumors were indicated with * and were euthanized according to institutional guidelines. (D and E) The number versus tumor size (D) and kinetics (E) of tumor-infiltrating NK cells in mice challenged s.c. with 50,000 RMA.ΔTAP2 cells at day 14–21 after challenge. Cumulative of two independent experiments totaling eight to nine mice per group. (F and G) The number of tumor-infiltrating NK cells (F) and their phenotype (G) in indicated mice challenged with B16F10. Representative of two independent experiments with three to five mice per group.
Figure S5.
Figure S5.
Generation of TAP2-deficient RMA tumor model. (A) Overview of RMA.ΔTAP2 tumor model generation. (B) Classical and non-classical MHC-I expression by tissue cultured RMA, RMA.ΔTAP2, and RMA-s using flow cytometry. (C) Sanger sequencing of genomic DNA TAP2 region targeted by CRISPR using primers forward 5′-CTT​TCC​GGT​GAA​CAA​GAA​GCC-3′ and reverse 5′-AAG​ATA​AGG​AGG​CTG​TGC​CC-3′. (D) 5 × 10⁴ of selected clone RMA.ΔTAP2 were s.c. injected and survival was monitored.

Similar articles

Cited by

References

    1. Adams, N.M., Lau C.M., Fan X., Rapp M., Geary C.D., Weizman O.-E., Diaz-Salazar C., and Sun J.C.. 2018. Transcription factor IRF8 orchestrates the adaptive natural killer cell response. Immunity. 48:1172–1182.e6. 10.1016/j.immuni.2018.04.018 - DOI - PMC - PubMed
    1. Anderson, P., Aptsiauri N., Ruiz-Cabello F., and Garrido F.. 2021. HLA class I loss in colorectal cancer: Implications for immune escape and immunotherapy. Cell. Mol. Immunol. 18:556–565. 10.1038/s41423-021-00634-7 - DOI - PMC - PubMed
    1. Arase, H., Mocarski E.S., Campbell A.E., Hill A.B., and Lanier L.L.. 2002. Direct recognition of cytomegalovirus by activating and inhibitory NK cell receptors. Science. 296:1323–1326. 10.1126/science.1070884 - DOI - PubMed
    1. Bangru, S., Arif W., Seimetz J., Bhate A., Chen J., Rashan E.H., Carstens R.P., Anakk S., and Kalsotra A.. 2018. Alternative splicing rewires Hippo signaling pathway in hepatocytes to promote liver regeneration. Nat. Struct. Mol. Biol. 25:928–939. 10.1038/s41594-018-0129-2 - DOI - PMC - PubMed
    1. Beaulieu, A.M., Zawislak C.L., Nakayama T., and Sun J.C.. 2014. The transcription factor Zbtb32 controls the proliferative burst of virus-specific natural killer cells responding to infection. Nat. Immunol. 15:546–553. 10.1038/ni.2876 - DOI - PMC - PubMed

Publication types

Substances