. 2023 Sep 11;9(1):340.
doi: 10.1038/s41420-023-01638-0.

Tumor suppressor p53 mediates interleukin-6 expression to enable cancer cell evasion of genotoxic stress

Affiliations

Tumor suppressor p53 mediates interleukin-6 expression to enable cancer cell evasion of genotoxic stress

Trinh T T Phan et al. Cell Death Discov. .

Abstract

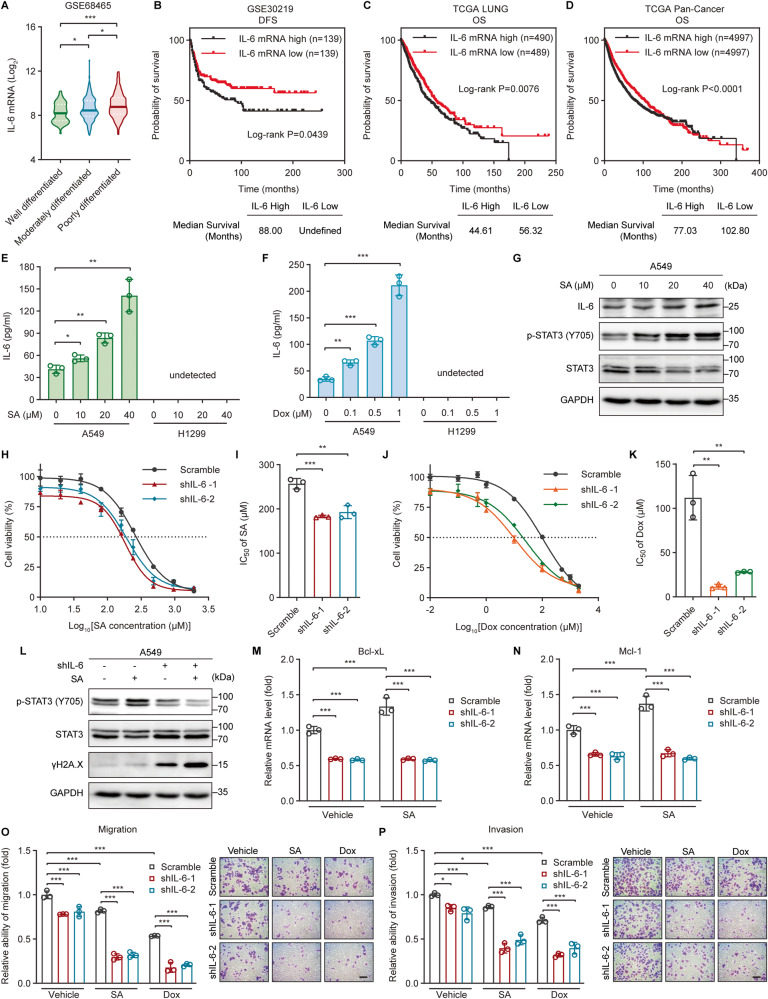
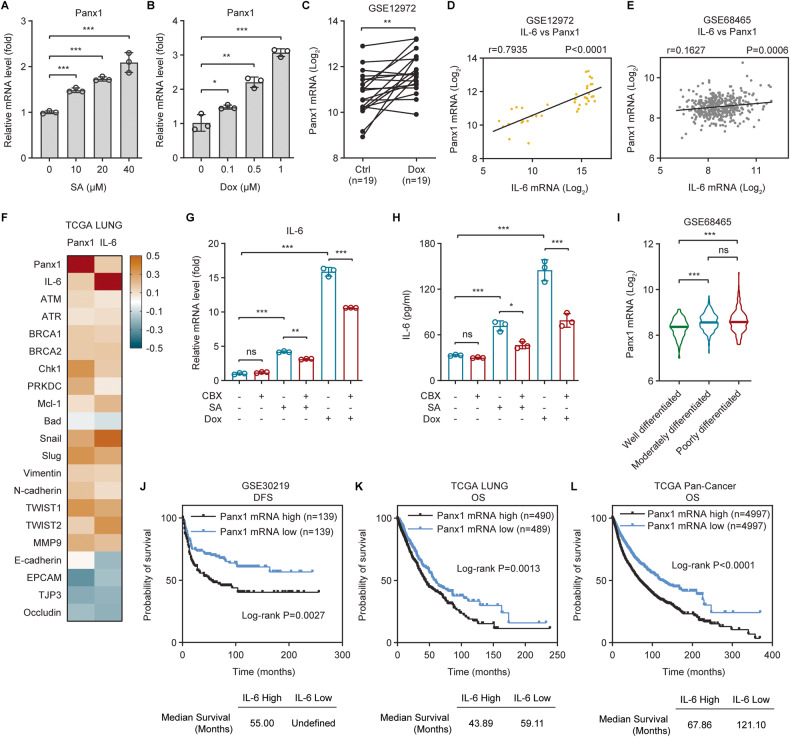
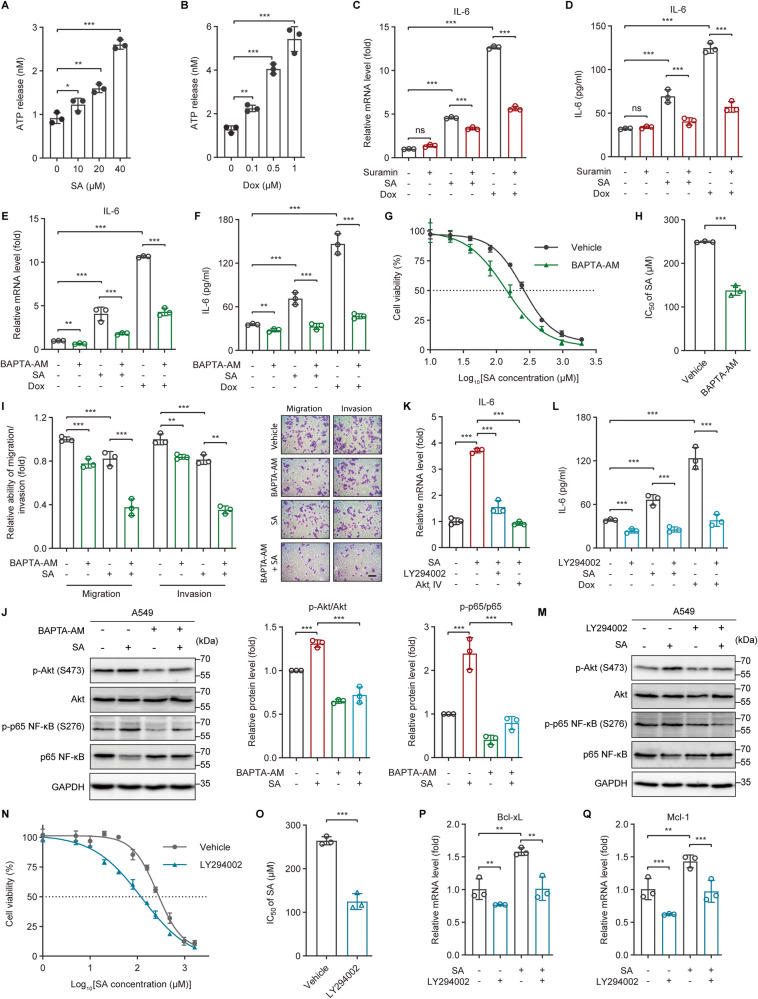
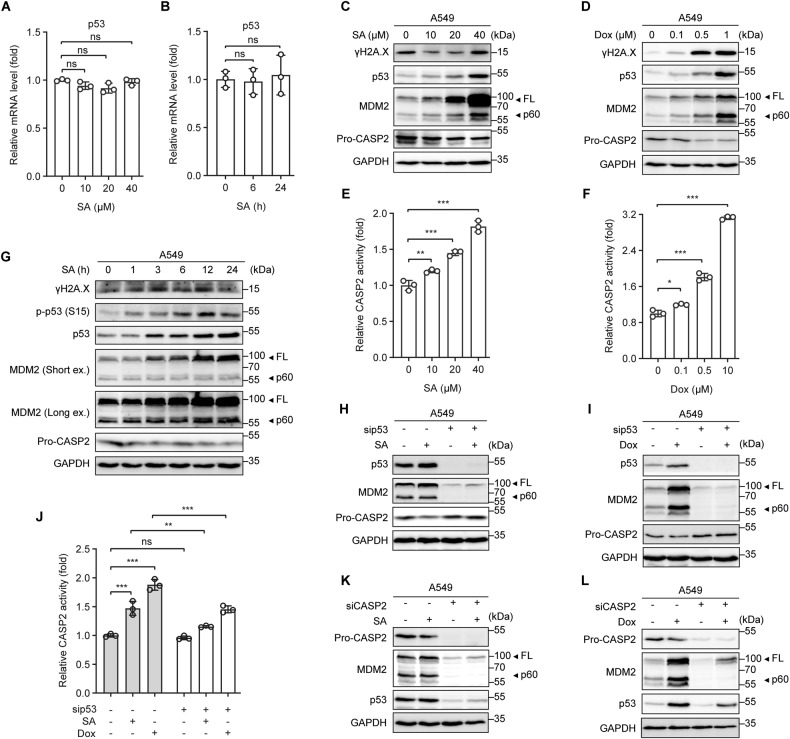
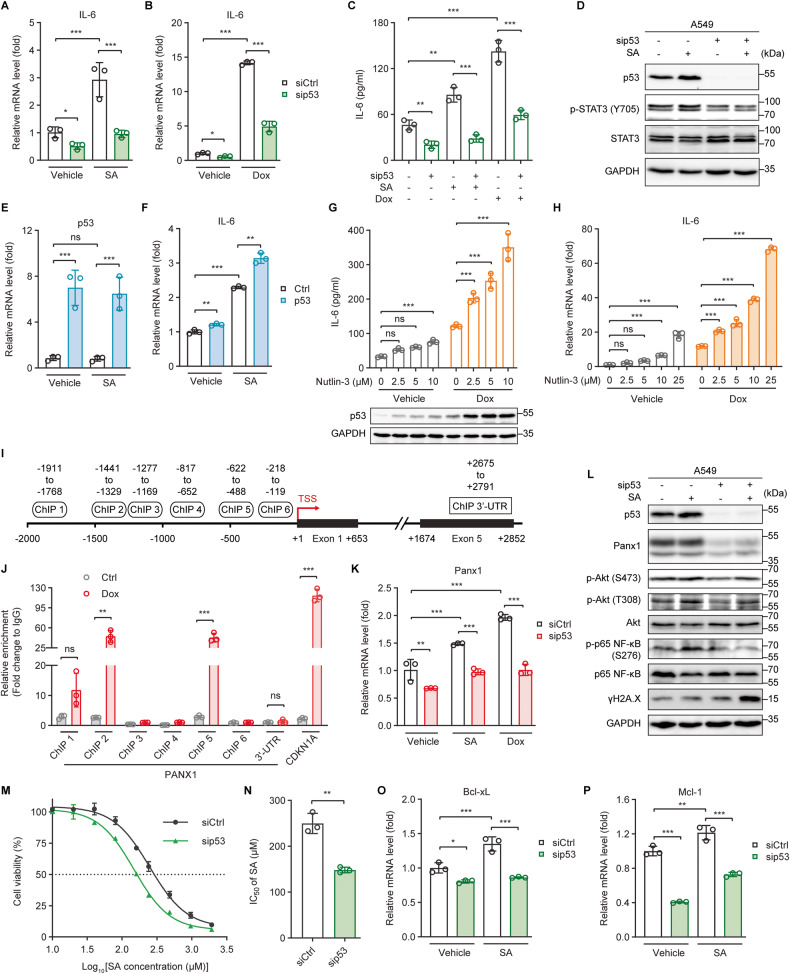
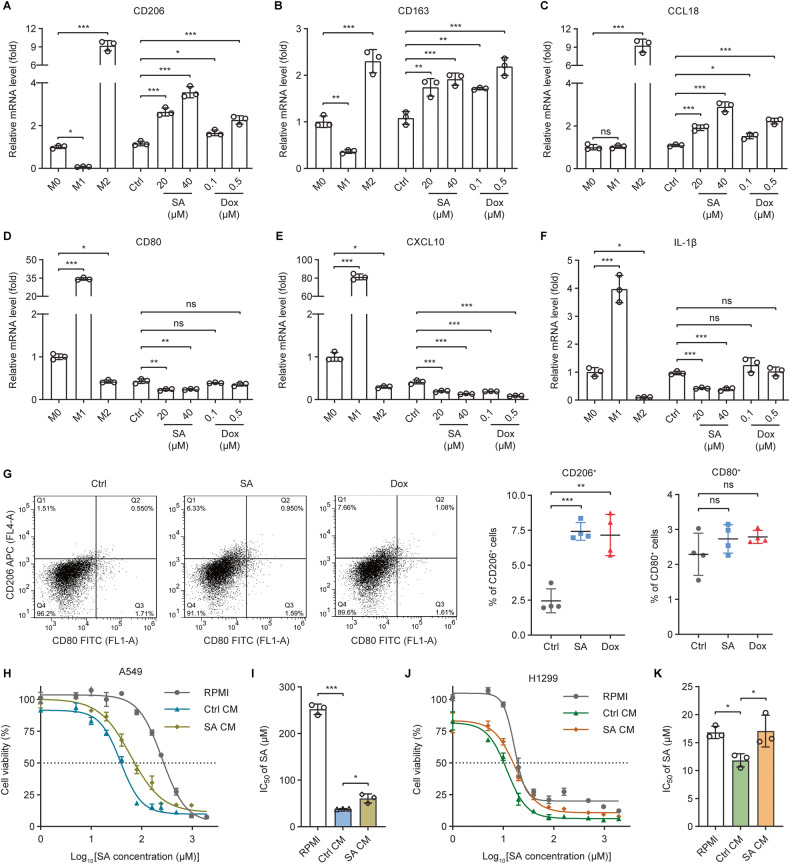
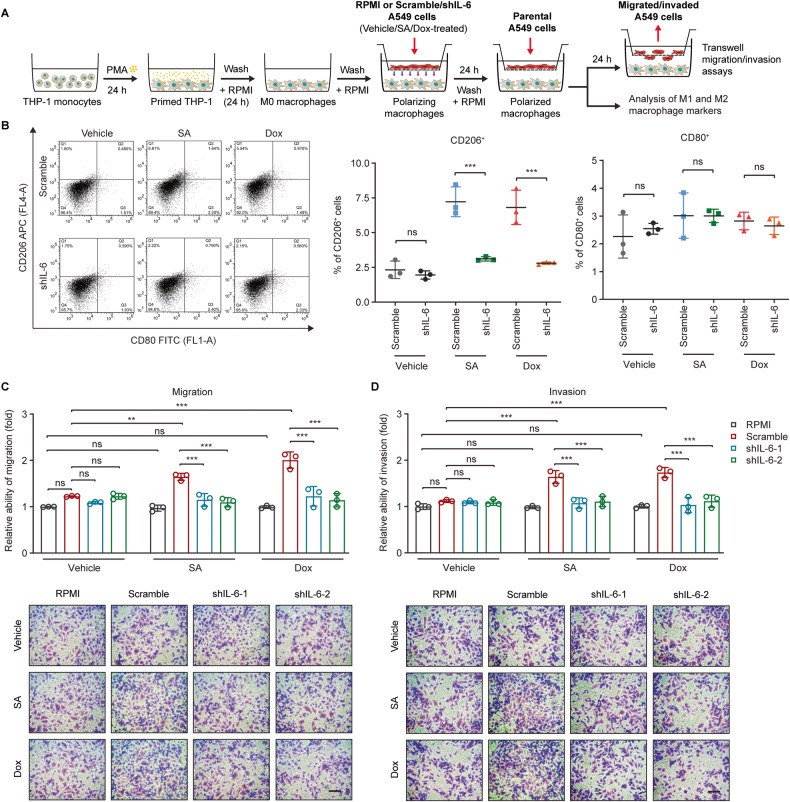
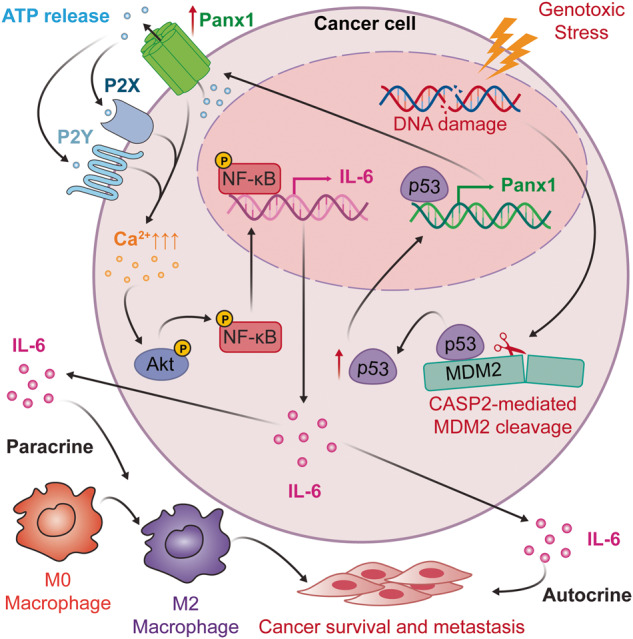
The tumor suppressor p53 primarily functions as a mediator of DNA damage-induced cell death, thereby contributing to the efficacy of genotoxic anticancer therapeutics. Here, we show, on the contrary, that cancer cells can employ genotoxic stress-induced p53 to acquire treatment resistance through the production of the pleiotropic cytokine interleukin (IL)-6. Mechanistically, DNA damage, either repairable or irreparable, activates p53 and stimulates Caspase-2-mediated cleavage of its negative regulator mouse double minute 2 (MDM2) creating a positive feedback loop that leads to elevated p53 protein accumulation. p53 transcriptionally controls the major adenosine triphosphate (ATP) release channel pannexin 1 (Panx1), which directs IL-6 induction via a mechanism dependent on the extracellular ATP-activated purinergic P2 receptors as well as their downstream intracellular calcium (iCa2+)/PI3K/Akt/NF-ĸB signaling pathway. Thus, p53 silencing impairs Panx1 and IL-6 expression and renders cancer cells sensitive to genotoxic stress. Moreover, we confirm that IL-6 hampers the effectiveness of genotoxic anticancer agents by mitigating DNA damage, driving the expression of anti-apoptotic Bcl-2 family genes, and maintaining the migratory and invasive properties of cancer cells. Analysis of patient survival and relevant factors in lung cancer and pan-cancer cohorts supports the prognostic and clinical values of Panx1 and IL-6. Notably, IL-6 secreted by cancer cells during genotoxic treatments promotes the polarization of monocytic THP-1-derived macrophages into an alternative (M2-like) phenotype that exhibits impaired anti-survival activities but enhanced pro-metastatic effects on cancer cells as compared to nonpolarized macrophages. Our study reveals the precise mechanism for genotoxic-induced IL-6 and suggests that targeting p53-mediated IL-6 may improve the responsiveness of cancer cells to genotoxic anticancer therapy.


Conflict of interest statement

The authors declare no competing interests.

Figures

Fig. 1
Fig. 1. Downregulation of IL-6 renders cancer cells sensitive to genotoxic treatments.
A IL-6 mRNA levels in lung adenocarcinomas with different histological grades were investigated using the GSE68465 dataset and their log2-transformed values were compared among well (n = 60), moderately (n = 209), and poorly (n = 167) differentiated tumors. B Kaplan–Meier analysis of the relationship between IL-6 gene expression and disease-free survival (DFS) in lung cancer patients from the GSE30219 cohort. C, D Kaplan–Meier analysis of the relationship between IL-6 gene expression and overall survival (OS) in cancer patients from The Cancer Genome Atlas (TCGA) (C) lung cancer (LUNG) or (D) Pan-Cancer datasets. E, F The concentration of IL-6 present in the culture supernatants of A549 or H1299 cells treated with the indicated concentrations of (E) sodium arsenite (SA) or (F) doxorubicin (Dox) for 24 h was determined by ELISA. G Western blot analysis of IL-6, phosphorylated STAT3 (Y705), and total STAT3 protein levels in A549 cells treated with increasing concentrations of SA for 24 h. H, J Dose-response curves showing the survival of control (scramble) and IL-6-silenced (shIL-6-1 and shIL-6-2) A549 cells in response to increasing concentrations of (H) SA or (J) Dox treatments for 24 h. I, K The IC50 values of (I) SA or (K) Dox against scramble, shIL-6-1, and shIL-6-2 A549 cells were calculated from the nonlinear regression curves in Fig. 1H or J, respectively. Cell viability was measured by MTT assays. L Phosphorylated STAT3 (Y705), total STAT3, and γH2A.X protein levels in control (scramble) and IL-6-silenced (shIL-6) A549 cells untreated or treated with 20 µM SA for 24 h were determined by western blot analysis. M, N The mRNA levels of the anti-apoptotic genes (M) Bcl-xL and (N) Mcl-1 in scramble, shIL-6-1, and shIL-6-2 A549 cells untreated or treated with 20 µM SA for 24 h were measured by qRT-PCR. O, P The (O) migratory and (P) invasive abilities of scramble, shIL-6-1, and shIL-6-2 A549 cells untreated or treated with 20 µM SA or 0.1 µM Dox for 24 h were measured with transwell migration and invasion assays, respectively. Scale bar: 100 µm. Error bars represent mean ± SD, n = 3. Statistical analysis was performed using one-way ANOVA with Tukey’s multiple comparisons test (A), log-rank test (BD), unpaired two-tailed Student’s t test (E, F, I, K), or two-way ANOVA with Tukey’s multiple comparisons test (MP). *p ≤ 0.05; **p ≤ 0.01; ***p ≤ 0.001. The full length uncropped original western blots related to this figure are provided in the Supplemental Material file.
Fig. 2
Fig. 2. Panx1 contributes to genotoxic stress-induced IL-6 and has clinical relevance.
A, B Panx1 gene expression in A549 cells treated with increasing concentrations of (A) SA or (B) Dox for 24 h was measured by qRT-PCR. C Panx1 mRNA levels in primary human liposarcoma cell cultures were analyzed using the GSE12972 dataset and their log2-transformed values were compared between control (n = 19) and paired Dox-treated (n = 19) cells. D, E Pearson’s correlation analysis of IL-6 and Panx1 gene expression in (D) primary human liposarcoma cell cultures or (E) lung adenocarcinomas using the (D) GSE12972 (n = 38) or (E) GSE68465 (n = 443) dataset, respectively. F Heatmap of Pearson’s correlation coefficients (r) between IL-6 and Panx1 or between IL-6 or Panx1 versus factors relevant to DNA damage repair (ATM, ATR, BRCA1, BRCA2, Chk1, and PRKDC), anti-apoptosis (Mcl-1), pro-apoptosis (Bad), EMT stimulation (Snail, Slug, Vimentin, N-cadherin, TWIST1, TWIST2, and MMP9), or EMT suppression (E-Cadherin, EPCAM, TJP3, and Occludin) in the TCGA LUNG cohort (n = 994). G qRT-PCR analysis of IL-6 gene expression in A549 cells untreated or treated with 20 µM SA or 0.5 µM Dox in the absence or presence of the Panx1 inhibitor CBX (50 µM) for 24 h. H The concentration of IL-6 present in the culture supernatants of A549 cells untreated or treated with 20 µM SA or 0.5 µM Dox in the absence or presence of 50 µM CBX for 24 h was determined by ELISA. I Panx1 mRNA levels in lung adenocarcinomas with different histological grades were investigated using the GSE68465 dataset and their log2-transformed values were compared among well (n = 60), moderately (n = 209), and poorly (n = 167) differentiated tumors. J Kaplan–Meier analysis of the relationship between Panx1 gene expression and disease-free survival (DFS) in lung cancer patients from the GSE30219 cohort. K, L Kaplan-Meier analysis of the relationship between Panx1 gene expression and overall survival (OS) in cancer patients from The Cancer Genome Atlas (TCGA) (K) lung cancer (LUNG) or (L) Pan-Cancer datasets. Error bars represent mean ± SD, n = 3. Statistical analysis was performed using unpaired two-tailed Student’s t test (A, B), paired two-tailed Student’s t test (C), two-way ANOVA with Tukey’s multiple comparisons test (G, H), one-way ANOVA with Tukey’s multiple comparisons test (I), or log-rank test (JL). *p ≤ 0.05; **p ≤ 0.01; ***p ≤ 0.001; ns not significant.
Fig. 3
Fig. 3. ATP-activated purinergic P2 receptors and the iCa2+/PI3K/Akt/NF-ĸB signaling pathway contribute to genotoxic stress-induced IL-6 expression.
A, B The concentration of ATP released into the culture medium of A549 cells treated with the indicated concentrations of (A) SA or (B) Dox for 24 h was measured by a bioluminescence assay. C, E qRT-PCR analysis of IL-6 gene expression in A549 cells untreated or treated with 20 µM SA or 0.5 µM Dox in the absence or presence of (C) the broad-spectrum P2 receptor antagonist Suramin (50 µM) or (E) the intracellular calcium chelator BAPTA-AM (10 µM) for 24 h. D, F The concentration of IL-6 present in the culture supernatants of A549 cells untreated or treated with 20 µM SA or 0.5 µM Dox in the absence or presence of (D) 50 µM Suramin or (F) 10 µM BAPTA-AM for 24 h was determined by ELISA. G Dose-response curves showing the survival of control and 10 µM BAPTA-AM-pretreated A549 cells in response to increasing concentrations of SA treatment for 24 h. H The IC50 values of SA against control and 10 µM BAPTA-AM-pretreated A549 cells were calculated from the nonlinear regression curves in Fig. 3G. Cell viability was measured by MTT assays. I The migratory and invasive abilities of A549 cells untreated or treated with 20 µM SA in the absence or presence of 10 µM BAPTA-AM for 24 h were measured with transwell assays. Scale bar: 100 µm. J, M Western blot analysis of phosphorylated Akt (S473), total Akt, phosphorylated p65 NF-ĸB (S276), and total p65 NF-ĸB protein levels in A549 cells untreated or treated with 20 µM SA in the absence or presence of (J) 10 µM BAPTA-AM or (M) 10 µM LY294002 for 24 h. K IL-6 gene expression in A549 cells untreated or treated with 20 µM SA in the absence or presence of the PI3K inhibitor LY294002 (10 µM) or the Akt Inhibitor IV (Akti IV, 10 µM) for 24 h was measured by qRT-PCR. L The concentration of IL-6 protein present in the culture supernatants of A549 cells untreated or treated with 20 µM SA or 0.5 µM Dox in the absence or presence of 10 µM LY294002 for 24 h was determined by ELISA. N Dose-response curves showing the survival of control and 10 µM LY294002-pretreated A549 cells in response to increasing concentrations of SA treatment for 24 h. O The IC50 values of SA against control and 10 µM LY294002-pretreated A549 cells were calculated from the nonlinear regression curves in Fig. 3N. Cell viability was measured by the MTT assay. P, Q The mRNA levels of the anti-apoptotic genes (P) Bcl-xL and (Q) Mcl-1 in A549 cells untreated or treated with 20 µM SA in the absence or presence of 10 µM LY294002 for 24 h were measured by qRT-PCR. Error bars represent mean ± SD, n = 3. Statistical analysis was performed using unpaired two-tailed Student’s t test (A, B, H, O), two-way ANOVA with Tukey’s multiple comparisons test (CF, I, J, L, P, Q), or one-way ANOVA with Tukey’s multiple comparisons test (K). *p ≤ 0.05; **p ≤ 0.01; ***p ≤ 0.001; ns not significant. The full length uncropped original western blots related to this figure are provided in the Supplemental Material file.
Fig. 4
Fig. 4. Genotoxic stress induces p53-dependent Caspase 2-mediated MDM2 cleavage to promote p53 protein accumulation.
A, B p53 gene expression in A549 cells treated (A) with increasing concentrations of SA for 24 h or (B) with 20 µM SA for the indicated time periods was measured by qRT-PCR. C, D Western blot analysis of γH2A.X, p53, MDM2, and pro-Caspase-2 (Pro-CASP2) protein levels in A549 cells treated with increasing concentrations of (C) SA or (D) Dox for 24 h. E, F Caspase-2 (CASP2) activity in A549 cells treated with increasing concentrations of (E) SA or (F) Dox for 24 h. G Western blot analysis of γH2A.X, phosphorylated p53 (S15), total p53, MDM2, and Pro-CASP2 protein levels in A549 cells treated with 20 µM SA for the indicated time periods. H, I p53, MDM2, and Pro-CASP2 protein levels in control and p53-silenced A549 cells untreated or treated with (H) 20 µM SA or (I) 0.5 µM Dox for 24 h were determined by western blot analysis. J CASP2 activity in control and p53-silenced A549 cells untreated or treated with 20 µM SA or 0.5 µM Dox for 24 h. K, L p53, MDM2, and Pro-CASP2 protein levels in control and CASP2-silenced A549 cells untreated or treated with (K) 20 µM SA or (L) 0.5 µM Dox for 24 h were determined by western blot analysis. Error bars represent mean ± SD, n = 3. Statistical analysis was performed using unpaired two-tailed Student’s t test (A, B, E, F) or two-way ANOVA with Tukey’s multiple comparisons test (J). *p ≤ 0.05; **p ≤ 0.01; ***p ≤ 0.001; ns, not significant. The full length uncropped original western blots related to this figure are provided in the Supplemental Material file.
Fig. 5
Fig. 5. p53 transactivates Panx1 to drive IL-6 induction.
A, B qRT-PCR analysis of IL-6 gene expression in control (siCtrl) and p53-silenced (sip53) A549 cells untreated or treated with (A) 20 µM SA or (B) 0.5 µM Dox for 24 h. C The concentration of IL-6 present in the culture supernatants of siCtrl and sip53 A549 cells untreated or treated with 20 µM SA or 0.5 µM Dox for 24 h was determined by ELISA. D Western blot analysis of p53, phosphorylated STAT3 (Y705), and total STAT3 protein levels in siCtrl and sip53 A549 cells untreated or treated with 20 µM SA for 24 h. E, F qRT-PCR analysis of (E) p53 and (F) IL-6 gene expression in control (Ctrl) and p53-overexpressing (p53) A549 cells untreated or treated with 20 µM SA for 24 h. G The concentration of IL-6 present in the culture supernatants (upper panel) or the p53 protein levels (lower panel) of A549 cells untreated or treated with 0.5 µM Dox in the presence of increasing concentrations of the MDM2 inhibitor Nutlin-3 for 24 h was determined by ELISA or western blot, respectively. H qRT-PCR analysis of IL-6 gene expression in A549 cells untreated or treated with 0.5 µM Dox in the presence of increasing concentrations of Nutlin-3 for 24 h. I Schematic diagram of the human PANX1 gene locus with six potential p53 binding regions, −1911 to −1768 (ChIP 1), −1441 to −1329 (ChIP 2), −1277 to −1169 (ChIP 3), −817 to −652 (ChIP 4), −622 to −488 (ChIP 5), and −218 to −119 (ChIP 6), on the PANX1 promoter (upstream of TSS) and a 3′-untranslated region (ChIP 3′-UTR, +2675 to +2791, downstream of TSS), identified with the JASPAR program [46]. TSS, transcription start site. J Chromatin immunoprecipitation and quantitative real-time PCR (ChIP-qPCR) analysis of the relative enrichment of p53 at the indicated PANX1 promoter regions in A549 cells with or without 0.5 µM Dox treatment for 24 h. The relative enrichments of p53 at the CDKN1A (p21) promoter region (−2292 to −2169, upstream of TSS) and the 3′-untranslated (3′-UTR) region of the PANX1 gene were measured as positive and negative controls, respectively. K Panx1 gene expression in siCtrl and sip53 A549 cells untreated or treated with 20 µM SA or 0.5 µM Dox for 24 h was measured by qRT-PCR. L Western blot analysis of p53, Panx1, phosphorylated Akt (S473 and T308), total Akt, phosphorylated p65 NF-ĸB (S276), total p65 NF-ĸB, and γH2A.X protein levels in siCtrl and sip53 A549 cells untreated or treated with 20 µM SA for 24 h. M Dose-response curves showing the survival of siCtrl and sip53 A549 cells in response to increasing concentrations of SA treatment for 24 h. N The IC50 values of SA against siCtrl and sip53 A549 cells were calculated from the nonlinear regression curves in Fig. 5M. Cell viability was measured by MTT assays. O, P The mRNA levels of the anti-apoptotic genes (O) Bcl-xL and (P) Mcl-1 in siCtrl and sip53 A549 cells untreated or treated with 20 µM SA for 24 h were measured by qRT-PCR. Error bars represent mean ± SD, n = 3. Statistical analysis was performed using two-way ANOVA with Tukey’s multiple comparisons test (AC, EH, K, O, P) or unpaired two-tailed Student’s t test (J, N). *p ≤ 0.05; **p ≤ 0.01; ***p ≤ 0.001; ns not significant. The full length uncropped original western blots related to this figure are provided in the Supplemental Material file.
Fig. 6
Fig. 6. Conditioned medium from genotoxic-exposed cancer cells stimulates alternative (M2-like) polarization of macrophages.
AF The mRNA levels of (AC) M2- (CD206, CD163, and CCL18) and (DF) M1-associated (CD80, CXCL10, and IL-1β) macrophage markers were analyzed in THP-1-derived M0 and positive control M1/M2-polarized macrophages as well as in macrophages stimulated with conditioned medium from control (Ctrl), SA-treated (20 or 40 µM), or Dox-treated (0.1 or 0.5 µM) A549 cells using qRT-PCR. G Flow cytometric analysis of cell surface expressions of the M1- (CD80) and M2-associated (CD206) macrophage markers in macrophages stimulated with conditioned medium from control (Ctrl), SA-treated (20 µM), or Dox-treated (0.1 µM) A549 cells. Cells were double-stained with FITC-labeled anti-CD80 and APC-labeled anti-CD206 antibodies. H, J Dose-response curves showing the survival of (H) A549 or (J) H1299 cells cultured in RPMI medium (RPMI) or the conditioned medium, Ctrl CM or SA CM, from macrophages stimulated with the conditioned medium of control or 20 µM SA-treated A549 cells, respectively, in response to increasing concentrations of SA treatment for 24 h. I, K The IC50 values of SA against (I) A549 or (K) H1299 cells cultured in RPMI, Ctrl CM, or SA CM were calculated from the nonlinear regression curves in Fig. 6H or J, respectively. Cell viability was measured by MTT assays. Error bars represent mean ± SD, n = 3. Statistical analysis was performed using one-way ANOVA with Tukey’s multiple comparisons test. *p ≤ 0.05; **p ≤ 0.01; ***p ≤ 0.001; ns not significant.
Fig. 7
Fig. 7. IL-6 secreted by cancer cells plays a critical role in M2-like macrophage polarization.
A THP-1 monocytes were differentiated into M0 macrophages, co-cultured with control or IL-6-silenced A549 cells with and without SA/Dox treatment to induce macrophage polarization, and co-cultured with parental A549 cells to stimulate cancer cell migration and invasion as depicted. B Flow cytometric analysis of cell surface expression of the M1- (CD80) and M2-associated (CD206) macrophage markers in macrophages co-cultured with control (scramble) or IL-6-silenced (shIL-6) A549 cells with and without 20 µM SA or 0.1 µM Dox treatment for 24 h. Cells were double-stained with FITC-labeled anti-CD80 and APC-labeled anti-CD206 antibodies. C, D The (C) migratory and (D) invasive abilities of A549 cells co-cultured with macrophages stimulated with RPMI, control (scramble), or IL-6-silenced (shIL-6-1 and shIL-6-2) A549 cells with and without 20 µM SA or 0.1 µM Dox treatment for 24 h were measured with transwell assays. Scale bar: 100 µm. Error bars represent mean ± SD, n = 3. Statistical analysis was performed using two-way ANOVA with Tukey’s multiple comparisons test. *p ≤ 0.05; **p ≤ 0.01; ***p ≤ 0.001; ns not significant.
Fig. 8
Fig. 8. A putative schematic presentation of tumor suppressor p53-mediated IL-6 expression under genotoxic stress.
Wild-type p53 transcriptionally controls the major ATP release channel Panx1 that mediates IL-6 induction via the P2Rs/iCa2+/PI3K/Akt/NF-κB signaling axis. IL-6 mitigates cancer cell sensitivity to genotoxic treatments and maintains the metastatic abilities of cancer cells via both autocrine (cell response to its own secreted IL-6) and paracrine (action of IL-6 secreted by cancer cells to promote M2-like macrophage polarization) mechanisms.

Similar articles

Cited by

References

    1. Seddon B, Strauss SJ, Whelan J, Leahy M, Woll PJ, Cowie F, et al. Gemcitabine and docetaxel versus doxorubicin as first-line treatment in previously untreated advanced unresectable or metastatic soft-tissue sarcomas (GeDDiS): a randomised controlled phase 3 trial. Lancet Oncol. 2017;18:1397–410. doi: 10.1016/S1470-2045(17)30622-8. - DOI - PMC - PubMed
    1. Chen L, Zhu H-M, Li Y, Liu Q-F, Hu Y, Zhou J-F, et al. Arsenic trioxide replacing or reducing chemotherapy in consolidation therapy for acute promyelocytic leukemia (APL2012 trial) Proc Natl Acad Sci USA. 2021;118:e2020382118. doi: 10.1073/pnas.2020382118. - DOI - PMC - PubMed
    1. Gridelli C, Morabito A, Cavanna L, Luciani A, Maione P, Bonanno L, et al. Cisplatin-based first-line treatment of elderly patients with advanced non–small-cell lung cancer: joint analysis of MILES-3 and MILES-4 phase III trials. J Clin Oncol. 2018;36:2585–92. doi: 10.1200/JCO.2017.76.8390. - DOI - PubMed
    1. Woods D, Turchi JJ. Chemotherapy induced DNA damage response. Cancer Biol Ther. 2013;14:379–89. doi: 10.4161/cbt.23761. - DOI - PMC - PubMed
    1. Holohan C, Van Schaeybroeck S, Longley DB, Johnston PG. Cancer drug resistance: an evolving paradigm. Nat Rev Cancer. 2013;13:714–26. doi: 10.1038/nrc3599. - DOI - PubMed