. 2023 Sep 11:12:e85561.
doi: 10.7554/eLife.85561.

Tomosyn affects dense core vesicle composition but not exocytosis in mammalian neurons

Affiliations

Tomosyn affects dense core vesicle composition but not exocytosis in mammalian neurons

Aygul Subkhangulova et al. Elife. .

Abstract

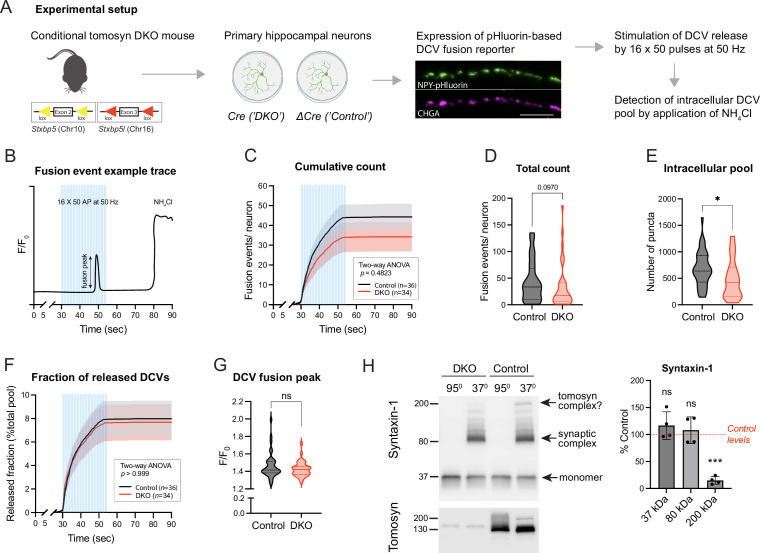
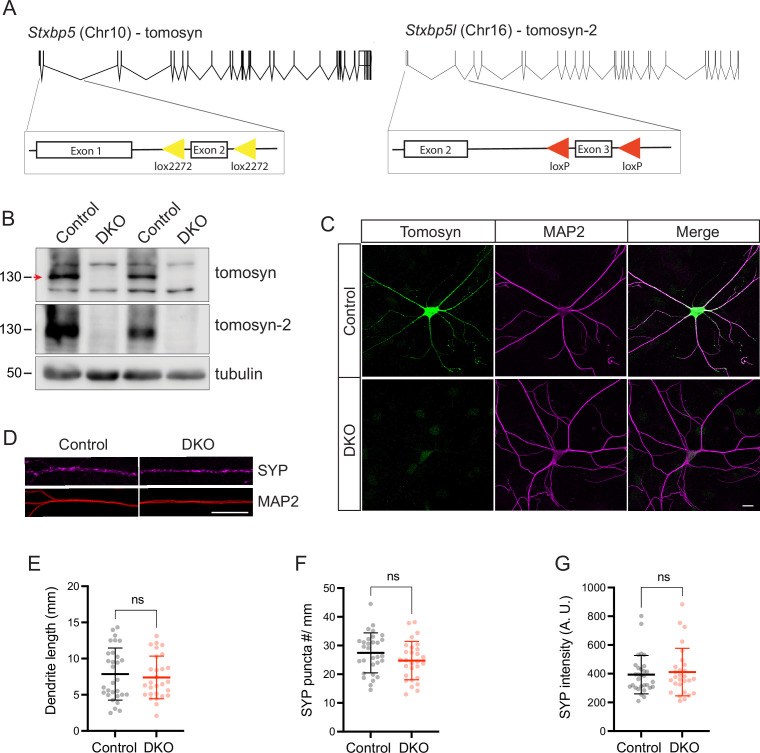
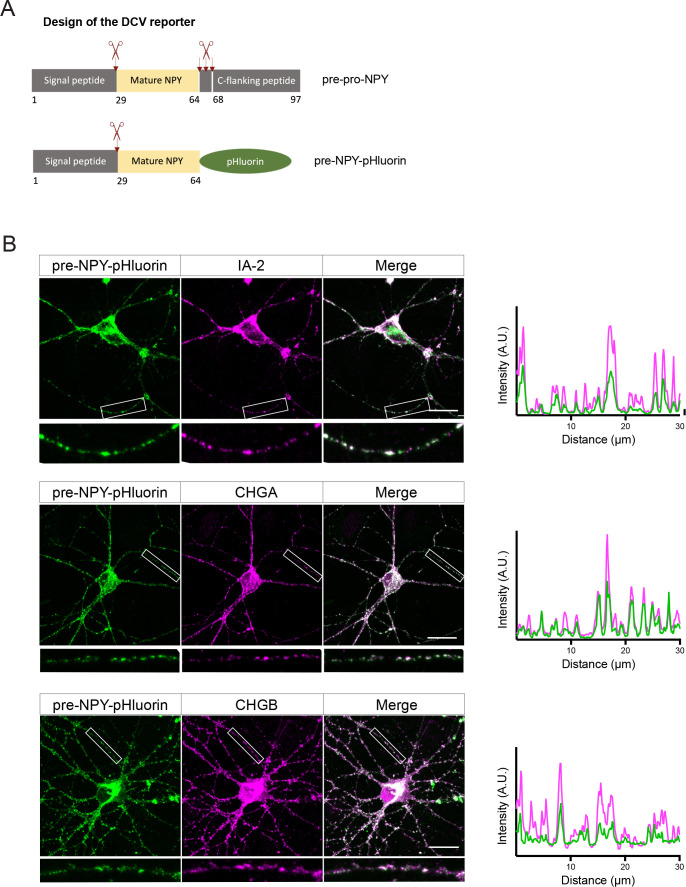
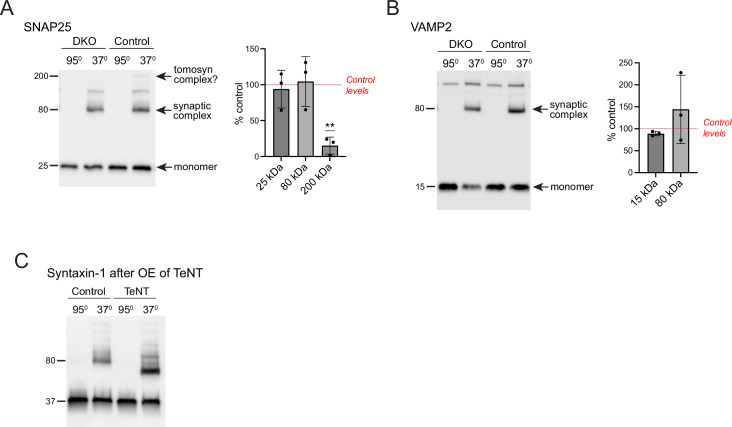
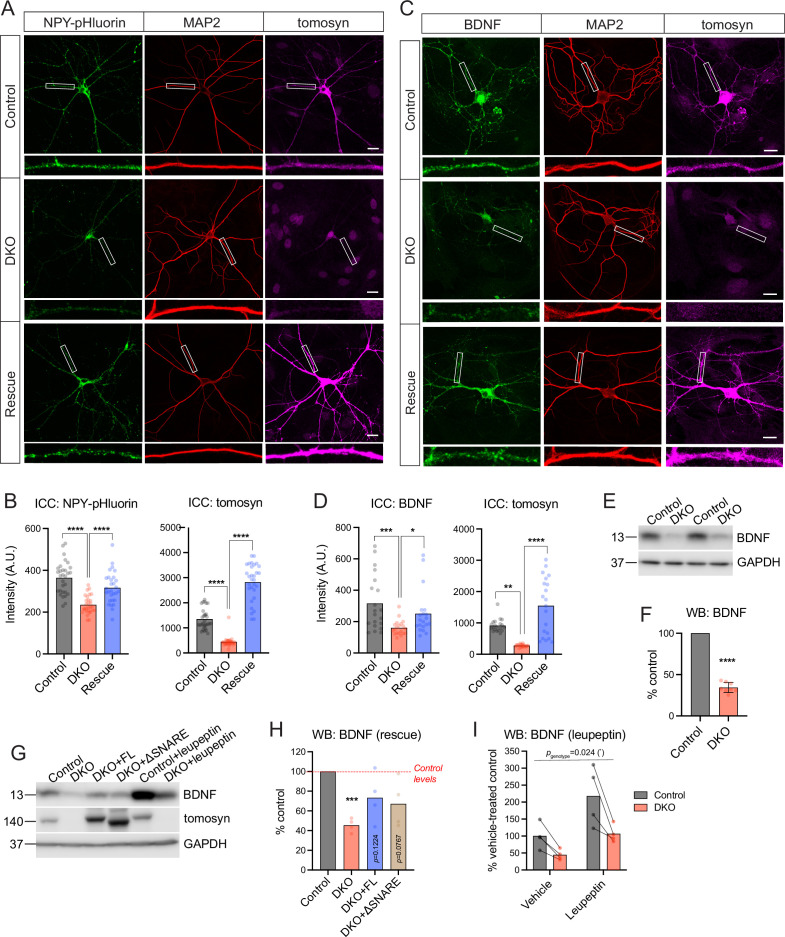
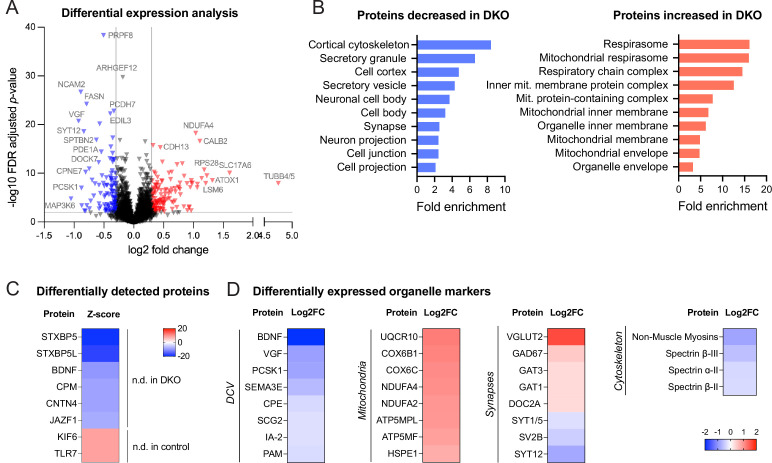
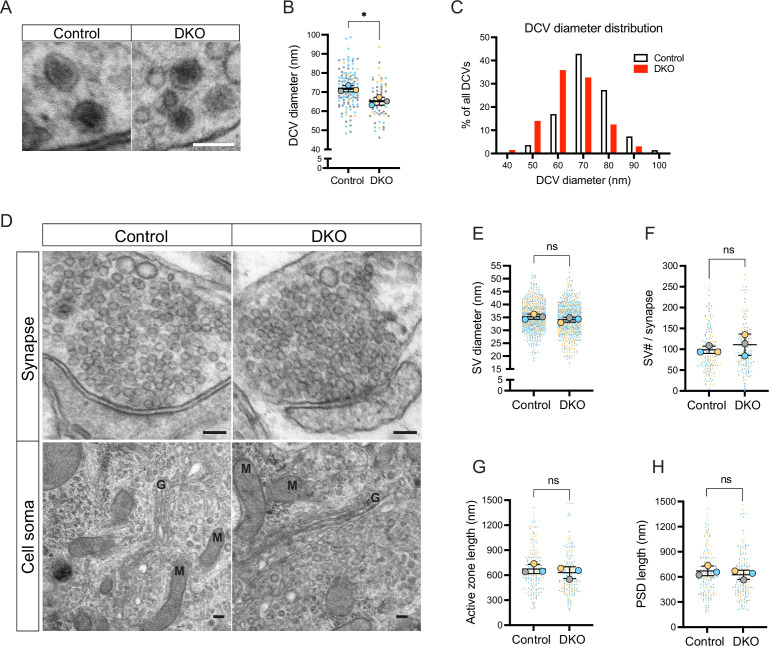
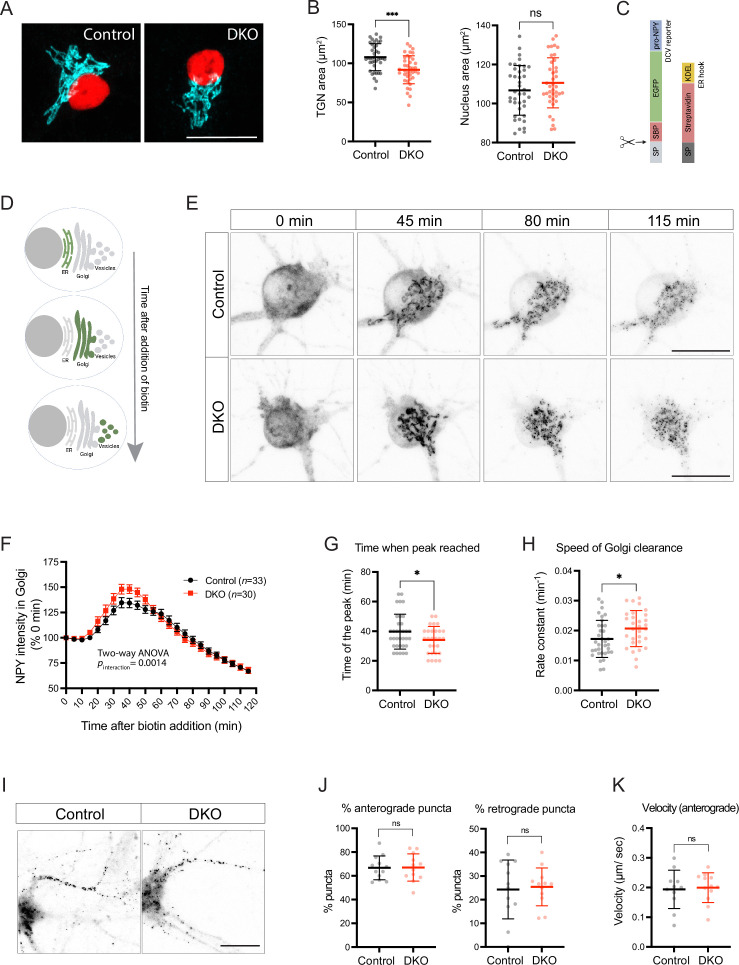
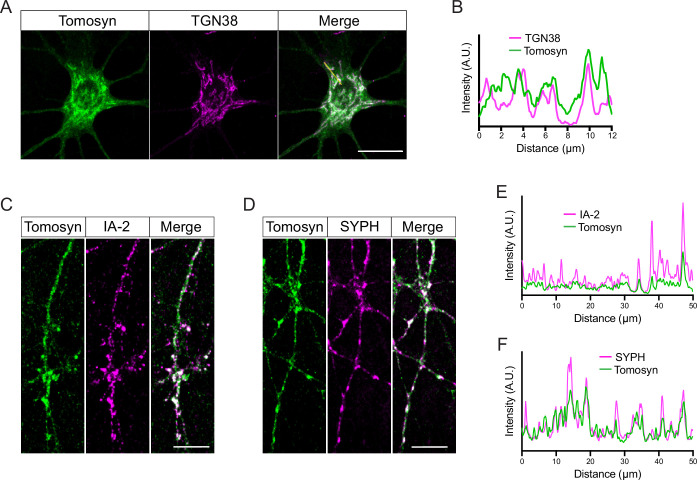
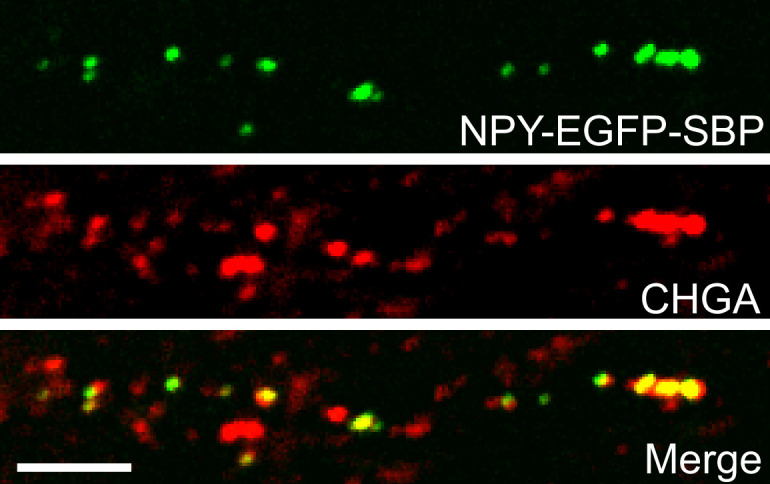
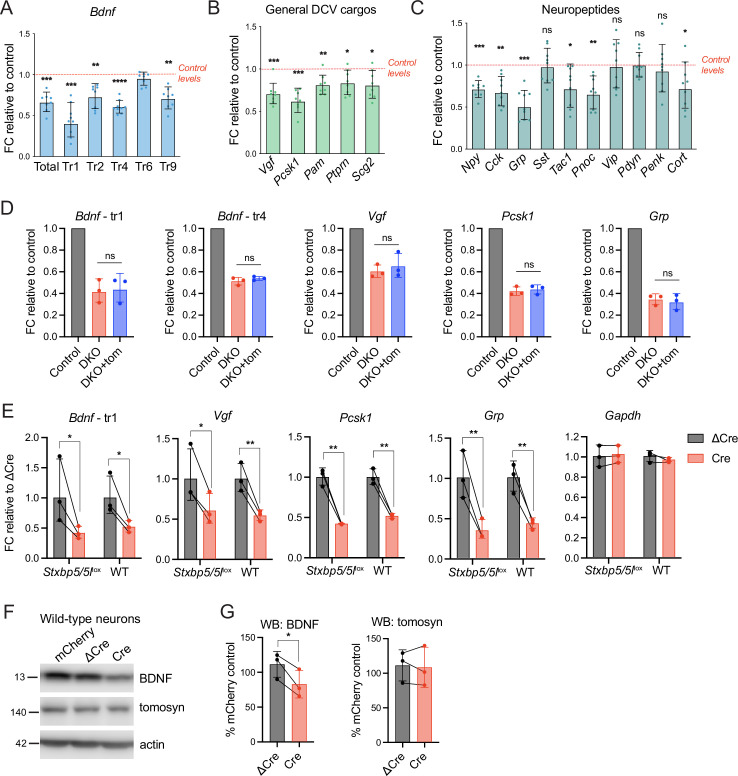
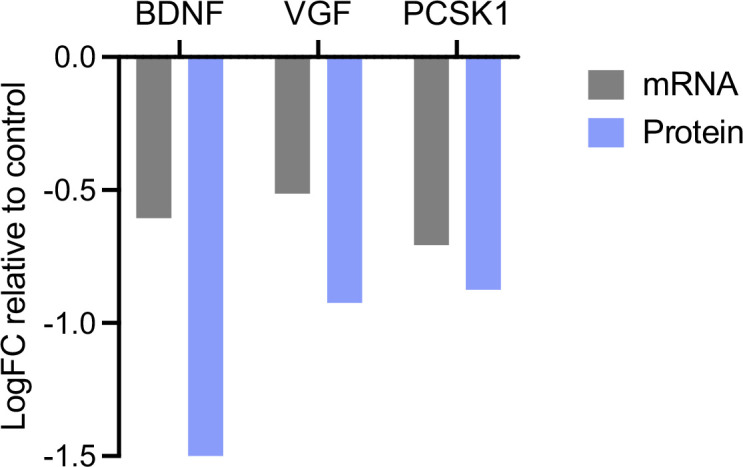
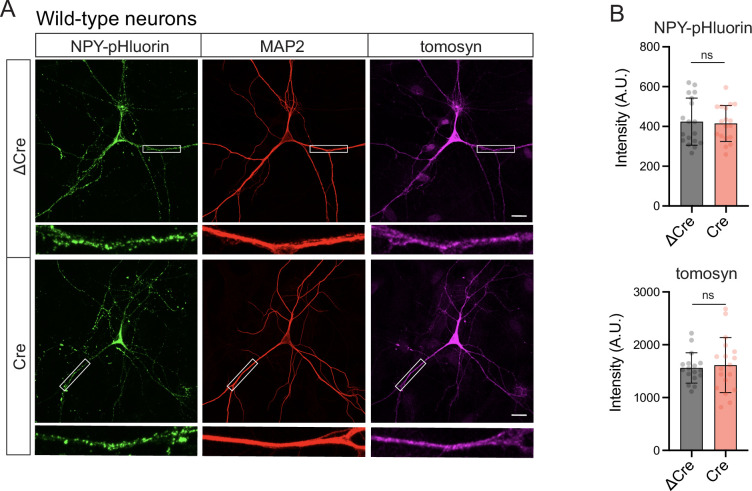
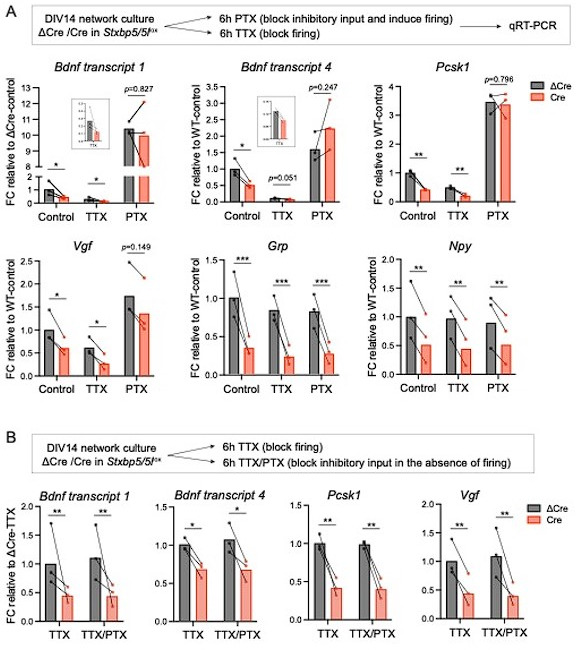
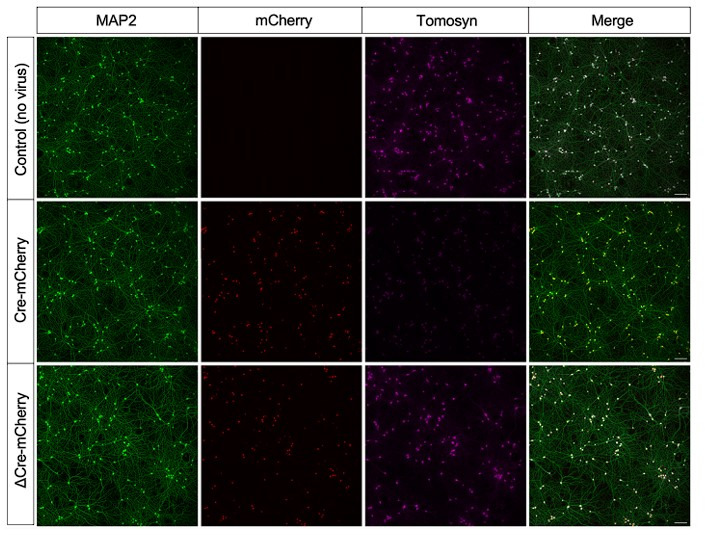
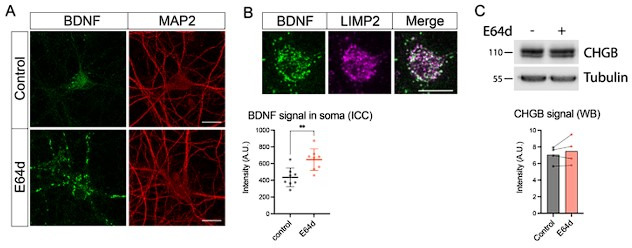
Tomosyn is a large, non-canonical SNARE protein proposed to act as an inhibitor of SNARE complex formation in the exocytosis of secretory vesicles. In the brain, tomosyn inhibits the fusion of synaptic vesicles (SVs), whereas its role in the fusion of neuropeptide-containing dense core vesicles (DCVs) is unknown. Here, we addressed this question using a new mouse model with a conditional deletion of tomosyn (Stxbp5) and its paralogue tomosyn-2 (Stxbp5l). We monitored DCV exocytosis at single vesicle resolution in tomosyn-deficient primary neurons using a validated pHluorin-based assay. Surprisingly, loss of tomosyns did not affect the number of DCV fusion events but resulted in a strong reduction of intracellular levels of DCV cargos, such as neuropeptide Y (NPY) and brain-derived neurotrophic factor (BDNF). BDNF levels were largely restored by re-expression of tomosyn but not by inhibition of lysosomal proteolysis. Tomosyn's SNARE domain was dispensable for the rescue. The size of the trans-Golgi network and DCVs was decreased, and the speed of DCV cargo flux through Golgi was increased in tomosyn-deficient neurons, suggesting a role for tomosyns in DCV biogenesis. Additionally, tomosyn-deficient neurons showed impaired mRNA expression of some DCV cargos, which was not restored by re-expression of tomosyn and was also observed in Cre-expressing wild-type neurons not carrying loxP sites, suggesting a direct effect of Cre recombinase on neuronal transcription. Taken together, our findings argue against an inhibitory role of tomosyns in neuronal DCV exocytosis and suggests an evolutionary conserved function of tomosyns in the packaging of secretory cargo at the Golgi.

Keywords: SNARE; cell biology; dense core vesicle; mouse; neuropeptides; neuroscience; secretion; tomosyn.


Conflict of interest statement

AS, MG, AG, Jv, AS, RT, MV No competing interests declared

Figures

Figure 1.
Figure 1.. Loss of tomosyns does not affect the fusion of dense core vesicles (DCVs) in mouse hippocampal neurons.
(A) Experimental strategy for measuring DCV fusion in single isolated neurons. (B) Exemplified fluorescence intensity trace of a neuronal DCV fusion event evoked by electric stimulation (shown as blue bars). Stimulation paradigm consisted of 16 bursts of 50 pulses (‘AP’) delivered at 50 Hz. Transient increase in relative fluorescence intensity (F/F0) indicates a fusion event during the stimulation. At the end of a recording session, neurons were flushed with 50 mM NH4Cl to visualize not fused DCVs. (C) Cumulative count of fusion events detected per single neuron. Data are shown as mean ± SEM and were analyzed by two-way ANOVA. n=34–36 neurons/genotype from three culture preparations. (D) Total count of fusion events detected per single neuron. Data are shown as violin plots with median (dashed line) and quartiles (dotted lines) and analyzed using the Mann-Whitney test. (E) Intracellular pool of pHluorin-labeled DCVs determined by application of 50 mM NH4Cl after the stimulation. Data are shown as violin plots with median (dashed line) and quartiles (dotted lines) and analyzed using a two-tailed unpaired t-test. *p<0.05. (F) Cumulative count of fusion events normalized to the intracellular pool of DCVs (released fraction). Data are shown as mean ± SEM and were analyzed by two-way ANOVA. (G) Peak in fluorescence intensity that results from a single fusion event (averaged per neuron). Data are shown as violin plots with median (dashed line) and quartiles (dotted lines) and analyzed using the Mann-Whitney test. ns: not significant. (H) Levels of syntaxin-1 containing SDS-resistant 80 kDa SNARE complexes are unchanged in Double knockout (DKO) neurons. Boiled and non-boiled lysates were subjected to SDS-PAGE and membranes were probed with an antibody against syntaxin-1 (STX1). Temperature-sensitive complexes were detected at 80 kDa (synaptic SNARE complex) and 200 kDa (possibly complex of syntaxin-1 and SNAP25 with tomosyn). Smear at >80 kDa represents complex multimers. Band intensities in DKO were normalized to the control, plotted as mean ± SD, and analyzed using a one-sample t-test. Dots represent independent culture preparations (n=4). ns: not significant; ***p<0.001.
Figure 1—figure supplement 1.
Figure 1—figure supplement 1.. Validation of the mouse model with the conditional deletion of tomosyn and tomosyn-2.
(A) Schematic depiction of mouse Stxbp5 (encoding tomosyn) and Stxbp5l (encoding tomosyn-2) genes with exons as vertical lines and introns as bridging gaps. To generate conditional double knockout (DKO) of Stxbp5/5 l, exon 2 of Stxbp5, and exon 3 of Stxbp5l were flanked with Lox2272 and LoxP sites, respectively (shown as triangles). Expression of Cre-recombinase results in the excision of the flanked exons in both genes, predicted to cause frameshift mutations and nonsense-mediated mRNA decay of gene transcripts. Proportional gene graphics were made using Exon-Intron Graphic Maker developed by Nikhil Bhatla. (B) Western blot showing loss of tomosyn and tomosyn-2 expression in Cre-expressing primary hippocampal neurons (‘DKO‘). As a control, neurons expressing Cre lacking the DNA-binding domain (ΔCre) were used. Arrow indicates tomosyn, which is flanked by two unspecific bands. Numbers on the left indicate the approximate molecular weight of the bands in kDa. (C) Immunostaining of tomosyn and MAP2 showing loss of tomosyn expression in DKO neurons. Scale bar 20 µm. (D) Example cropped images of control and DKO neurons immunostained for the synaptic marker synaptophysin (‘SYP’) showing normal synapse number and distribution in the DKO neurons (quantified in E-G). Scale bar 20 µm. (E) Total length of MAP2-positive neurites per single neuron. (F) Number of synaptophysin puncta normalized to the length of MAP2-positive neurites. (G) Mean intensity of synaptophysin signal on MAP2-positive neurites. Data in E-G are shown as mean ± SD and were analyzed using a two-tailed unpaired t-test. n=28–30 neurons/genotype. ns: not significant.
Figure 1—figure supplement 2.
Figure 1—figure supplement 2.. Design and validation of the pHluorin-based dense core vesicle (DCV) fusion reporter.
(A) DCV fusion reporter used in this study is based on the human pre-pro-NPY (NPY precursor), which structure is shown in the upper panel with processing sites depicted as scissors. In the DCV fusion reporter, the C-flanking peptide (aa 64–97) was replaced by super-ecliptic pHluorin. (B) DCV fusion reporter localizes to endogenous DCVs in cultured neurons, as shown by co-localization of pre-NPY-pHluorin with the endogenous DCV markers IA-2, chromogranin A (CHGA), and chromogranin B (CHGB). White frames indicate zoomed areas used to generate intensity profiles shown on the right. Scale bar 20 µm.
Figure 1—figure supplement 3.
Figure 1—figure supplement 3.. Levels of SNAP25- and VAMP2-containing SDS-resistant SNARE complexes are unchanged in double knockout (DKO) neurons.
(A) and (B) Results of the SDS-PAGE on boiled and non-boiled lysates of control and DKO cultures. Membranes were probed with antibodies against SNAP25 (A) and VAMP2 (B). Temperature-sensitive complexes were detected at 80 kDa. Additionally, a 200 kDa band was detected in non-boiled lysates of control, but not DKO neurons, with the anti-SNAP25 antibody. Band intensities in DKO were normalized to the control, plotted as mean ± SD, and analyzed using a one-sample t-test. Dots represent independent culture preparations (n=4). ns: not significant; ***p<0.001. (C) Loss of VAMP2 due to overexpression (OE) of tetanus-toxin light chain (TeNT) results in the shift of the 80 kDa band detected with the antibody against syntaxin-1 in non-boiled lysates, indicating that the 80 kDa band represents a complex of syntaxin-1 with VAMP2.
Figure 2.
Figure 2.. Tomosyns regulate the number and/or composition of neuronal dense core vesicles (DCVs).
(A) Representative images of the DCV reporter (NPY-pHluorin) in control, double knockout (DKO), and DKO re-expressing tomosyn (Stxbp5 isoform m, ‘Rescue’) neurons. Neurons were grown in mass cultures, silenced with sodium channel blocker tetrodotoxin (TTX, 1 µM) for 48 hr, and fixed on DIV14. White boxes indicate zoomed-in segments of neurites shown under every image. Scale bar 20 µm. (B) Mean intensity of NPY-pHluorin and tomosyn immunostaining in control, DKO, and rescued neurons exemplified in (A). Data were analyzed using one-way ANOVA with Tukey’s multiple comparisons post hoc test. n=29–30 neurons (plotted as dots)/ genotype. ****p<0.0001. (C) Representative images of BDNF immunostaining in control, DKO, and DKO re-expressing tomosyn neurons. Neurons were grown on glial microislands and fixed on DIV16. White boxes indicate zoomed-in segments of neurites shown under every image. Scale bar 20 µm. (D) Quantification of the mean BDNF and tomosyn intensity in control, DKO and rescued neurons exemplified in (C). Data were analyzed using the Kruskal-Wallis test with Dunn’s multiple comparisons post hoc test (BDNF) and one-way ANOVA with Tukey’s multiple comparisons post hoc test (tomosyn). n=20 neurons (plotted as dots)/ genotype. ****p<0.0001. (E) BDNF levels as detected by western blot (WB) in lysates of control and DKO neuronal cultures. Equal loading was verified by immunodetection of GAPDH. (F) Quantification of the BDNF band intensity from WB exemplified in (E). BDNF levels in DKO neurons were normalized to control levels in the corresponding culture. DKO data are plotted as mean ± SD and were analyzed using one-sample t-test. n=8 samples/genotype from four culture preparations. ****p<0.0001. (G) Re-expression of tomosyn (either full length, ‘FL,’ or a truncated mutant lacking the SNARE domain, ‘ΔSNARE’) partially restores BDNF levels in DKO neurons as detected by WB. Same WB shows that an inhibition of lysosomal proteolysis by leupeptin (50 μM for 24 hr) does not equalize BDNF levels between control and DKO neurons. Immunodetection of tomosyn was used to validate the expression and the correct size of the rescue constructs. Equal loading was verified by immunodetection of GAPDH. (H) Quantification of the BDNF band intensity from WB exemplified in (G). BDNF levels in DKO neurons are shown as the mean % of control levels. Data were analyzed using one-sample t-test comparing to 100% (control levels). n=4 samples/genotype from two culture preparations. ***p<0.001. (I) Quantification of the BDNF band intensity in leupeptin-treated samples from WB exemplified in (G). BDNF levels in all groups are shown as % of the averaged vehicle-treated control levels. Bars indicate mean values. Data were analyzed using a two-way repeated measures ANOVA. n=4 samples/genotype from two culture preparations.
Figure 2—figure supplement 1.
Figure 2—figure supplement 1.. Expression of enhanced green fluorescent protein (EGFP) under the control of synapsin promoter is not affected in double knockout (DKO) neurons.
(A) Representative images of EGFP expressed under the control of synapsin promoter in fixed control and DKO neurons. Scale bar 20 µm. (B) Quantification of the mean EGFP intensity in control and DKO neurons from confocal microscopy images as exemplified in (A). Data are shown as mean ± SD and were analyzed using a two-tailed unpaired t-test. N=28–30 neurons/genotype. Ns: not significant.
Figure 2—figure supplement 2.
Figure 2—figure supplement 2.. Levels of a transmembrane dense core vesicle (DCV) marker, IA-2 (PTPRN), are decreased in double knockout (DKO) neurons.
(A) Representative images of the IA-2 immunostaining in control and DKO neurons. Neurons were grown in mass cultures, silenced with sodium channel blocker tetrodotoxin (TTX, 1 µM) for 48 hr, and fixed on DIV14. White boxes indicate zoomed-in segments of neurites shown under every image. Scale bar 20 µm. (B) Quantification of the mean IA-2 intensity in control and DKO neurons from images exemplified in (A). Data are shown as mean ± SD and were analyzed using a two-tailed unpaired t-test. n=24 neurons/genotype. *p<0.05; ****p<0.0001. (C) Levels of IA-2 as detected by WB in control and DKO neuronal lysates. Proteolytically processed (mature) form of IA-2 was detected at 65 kDa. Equal loading was verified by the detection of total protein stained with trichloroethanol (TCE) and by immunodetection of actin. Amount of mature IA-2 in DKO neurons was normalized to control levels in the corresponding culture. DKO data are presented as mean ± SD and were analyzed using one sample t-test. n=9 samples/genotype from three culture preparations. ****p<0.0001.
Figure 2—figure supplement 3.
Figure 2—figure supplement 3.. Loss of tomosyns does not affect levels of endo-lysosomal proteins.
(A) Representative images of LAMP1 immunostaining in DIV14 neurons. Scale bar 20 µm. (B) Quantification of the mean LAMP1 intensity in control and double knockout (DKO) neurons from confocal microscopy images as exemplified in (A). Data are shown as mean ± SD and were analyzed using a two-tailed unpaired t-test. n=10 neurons/genotype. ns: not significant. (C) Levels of LAMP1 and LIMP2 as detected by western blot (WB) are normal in DKO neurons. Equal loading was verified by immunodetection of actin. (D) Quantification of LAMP1 and LIMP2 signal from WB images exemplified in (C). Levels of LAMP1 and LIMP2 in DKO were normalized to control levels in the corresponding culture. DKO data are presented as mean ± SD and were analyzed using one sample t-test. n=9 samples/genotype from three culture preparations. ns: not significant.
Figure 3.
Figure 3.. Proteomic analysis shows the downregulation of dense core vesicle (DCV) and cytoskeletal proteins in double knockout (DKO) neurons.
(A) Volcano plot showing results of the differential expression analysis of control and DKO proteome. Gray lines indicate chosen thresholds for log2 fold change (0.3) and false discovery (FDR) adjusted p-value (0.01). Proteins decreased or increased in DKO are shown in blue and red, respectively. (B) Enriched gene ontology (GO cellular component) terms of the proteins significantly affected in DKO neurons as analyzed by ShinyGO v0.75 (http://bioinformatics.sdstate.edu/go/) with the FDR-adjusted p-value cutoff ≤0.05. (C) List of proteins reliably detected in one of the genotypes only and, therefore, not included in the differential expression analysis shown in (A). Proteins are sorted by the z-score, which reflects the total number of peptides detected per genotype. (D) Examples of proteins that are significantly affected in DKO neurons grouped by subcellular compartment. Heat maps show the degree of down- or upregulation in the DKO.
Figure 4.
Figure 4.. Loss of tomosyns results in a decrease of dense core vesicle (DCV) but not of synaptic vesicle (SV) size.
(A) Example EM images show the normal appearance of DCVs with a typical dense core in double knockout (DKO) neurons. Scale bar 100 nm. (B) DCV diameter is reduced in DKO neurons, as quantified from EM images exemplified in (A). Data are shown as a SuperPlot, where averages from three independent cultures (biological replicates) are shown as large circles and single observations (DCV profiles) as dots. Data from each culture are shown in a different color. Horizontal bars represent the means of the averages from the three cultures, which were compared using a two-tailed unpaired t-test. Error bars are SD. Number of DCV profiles analyzed: 135 (control) and 64 (DKO). *p<0.05. (C) Frequency distribution of DCVs by diameter is skewed to the left in DKO neurons, indicating a higher proportion of smaller DCVs in DKO neurons than in control. (D) Example EM images show normal ultrastructure of synapses and other cellular organelles in DKO neurons. Golgi cisternae and selected mitochondria are labeled with 'G' and 'M,' respectively. Scale bar 100 nm. (E–H) Quantification of SV diameter, SV number per synapse, length of the active zone, and length of postsynaptic density (PSD) from EM images exemplified in (D). Data are shown as SuperPlots and analyzed as described in (B). Number of individual observations: 617–621 SV profiles (E) and 148–152 synapses (F–H). ns: not significant.
Figure 5.
Figure 5.. Loss of tomosyns results in the accelerated trafficking of a dense core vesicle (DCV) cargo through Golgi.
(A) Trans-Golgi network (TGN) area is decreased in double knockout (DKO) neurons. Representative images of immunostained TGN marker, TMEM87A (shown in cyan). Nuclei are labeled in red due to the expression of mCherry-tagged Cre or ΔCre. Scale bar 20 µm. (B) Quantification of the area of the TGN and nuclei from confocal microscopy images exemplified in (A). Data are shown as mean ± SD and were analyzed using a two-tailed unpaired t-test. n=39–40 neurons/ genotype. ***p<0.001; ns: not significant. (C) Design of the construct for the Retention Using Selective Hooks (RUSH) assay. As a DCV cargo, human pre-pro-NPY fused to streptavidin-binding peptide (SBP) and enhanced green fluorescent protein (EGFP) was used. The cargo was immobilized at the endoplasmic reticulum (ER) due to interaction with the ER hook, consisting of streptavidin fused to the ER-retention/retrieval signal KDEL. (D) Scheme illustrating synchronized trafficking of a DCV cargo through the secretory pathway upon the addition of biotin in the RUSH assay. (E) Snapshots of time-lapse videos taken after the addition of biotin in the RUSH assay. Time passed after the addition of biotin is shown on top. DCV cargo passes through the Golgi in roughly 45 min after the addition of biotin and gets concentrated in fine puncta that eventually leave cell soma. Scale bar 20 µm. (F) NPY-EGFP intensity in the Golgi area plotted against time after the addition of biotin. Intensity values were normalized to the basal levels (before the addition of biotin). Data are shown as mean ± SEM and were analyzed by two-way ANOVA. n=30–34 neurons/genotype. (G) Time required to reach maximum NPY-EGFP intensity at the Golgi, quantified from (F), is reduced in DKO. Data are shown as mean ± SD and were analyzed by a two-tailed unpaired t-test. *p<0.05. (H) Speed of NPY-EGFP export from the Golgi is increased in DKO neurons. Rate constants were calculated from first-order decay curves fitted to the data shown in (F). Data are shown as mean ± SD and were analyzed by a two-tailed unpaired t-test. *p<0.05. (I) Snapshots of time-lapse videos taken 90 min after the addition of biotin in the RUSH assay with the focus on neurites, where newly made DCVs trafficked after exit from the Golgi. (J) Proportion of newly made DCVs trafficking in anterograde and retrograde directions as quantified from the time-lapse videos exemplified in (I). Majority of vesicles are trafficked anterogradely in neurons of both genotypes. Data are shown as mean ± SD and were analyzed by a two-tailed unpaired t-test. n=12 neurons/genotype. ns: not significant. (K) Speed of anterogradely trafficking vesicles as quantified from the time-lapse videos exemplified in (I). Data are shown as mean ± SD and were analyzed by a two-tailed unpaired t-test. n=12 neurons/genotype. ns: not significant.
Figure 5—figure supplement 1.
Figure 5—figure supplement 1.. Localization of tomosyn to the trans-Golgi network (TGN), dense core vesicles (DCVs), and synapses.
(A) Example confocal microscopy images showing partial co-localization of tomosyn with the TGN marker, TGN38. Scale bar 20 µm. (B) Intensity profile generated from the yellow line indicated in (A) showing partial colocalization of tomosyn and TGN38. (C) Example confocal microscopy images showing partial co-localization of tomosyn with the DCV marker, IA-2. Scale bar 10 µm. (D) Example confocal microscopy images showing partial co-localization of tomosyn with the synapse marker, synaptophysin (SYPH). Scale bar 10 µm. (E) Intensity profile generated from the neurite imaged in (C) showing partial colocalization of tomosyn and IA-2. (F) Intensity profile generated from the neurite imaged in (D) showing partial colocalization of tomosyn and synaptophysin (SYPH).
Figure 5—figure supplement 2.
Figure 5—figure supplement 2.. Retention Using Selective Hooks (RUSH)-generated vesicles contain endogenous dense core vesicle (DCV) marker, chromogranins (CHGA).
Example confocal microscopy images showing co-localization of NPY-EGFP-SBP with CHGA. Scale bar 5 µm.
Figure 6.
Figure 6.. Decreased mRNA expression of some dense core vesicle (DCV) cargos in double knockout (DKO) is caused by Cre recombinase expression and not by the loss of tomosyns.
(A) mRNA levels of different Bdnf transcript isoforms as assessed by quantitative RT-PCR and normalized to Gapdh. Data are shown as fold changes (FC) relative to control levels in the corresponding culture preparation. n=8 culture preparations/genotype. Dots represent individual cultures, bar graphs are geometric means, and error bars are geometric SD. Log2FC (ΔΔCt) were analyzed by one-sample t-test. **p<0.01; ***p<0.001; ****p<0.0001. (B) mRNA levels of general DCV cargos as assessed by quantitative RT-PCR and normalized to Gapdh. Data are shown and analyzed as described in (A). *p<0.05; **p<0.01; ***p<0.001. (C) mRNA levels of most abundant hippocampal neuropeptides as assessed by quantitative RT-PCR and normalized to Gapdh. Neuropeptides are sorted by their abundance in hippocampal neurons. Data are shown and analyzed as described in (A). *p<0.05; **p<0.01; ***p<0.001, ns: not significant. (D) Re-expression of tomosyn does not restore mRNA expression of DCV cargos in DKO neurons. mRNA levels of Bdnf, Vgf, Pcsk1, and Grp were normalized to Gapdh and plotted as described in (A). Comparison between DKO and DKO re-expressing tomosyn (DKO +tom) is performed using a two-tailed paired t-test on Log2FC (ΔΔCt). n=3 culture preparations/ genotype. ns: not significant. (E) Expression of Cre-recombinase in wild-type (WT) neurons results in the decreased mRNA expression of DCV cargos. Effects of Cre on Stxbp5/5llox neurons are shown for the direct comparison. mRNA levels of the DCV cargos were normalized to Gapdh and plotted as fold changes (FC) relative to ΔCre. Comparisons between ΔCre and Cre conditions in each genotype were performed using a two-tailed paired t-test. n=8 culture preparations/genotype. *p<0.05; **p<0.01. (F) brain-derived neurotrophic factor (BDNF) and tomosyn levels as detected by western blot (WB) in lysates of ΔCre-mCherry and Cre-mCherry-expressing wild-type neurons. mCherry expression was used as a control. Equal loading was verified by immunodetection of GAPDH. (G) Quantification of BDNF and tomosyn bands intensity from WB exemplified in (F). BDNF and tomosyn levels in (Δ)Cre-expressing wild-type neurons are shown as mean % of control (mCherry-expressing neurons). Error bars represent SD. Data were analyzed using a two-tailed paired t-test. n=3 samples/ genotype. *p<0.05.
Figure 6—figure supplement 1.
Figure 6—figure supplement 1.. Comparison of mRNA and protein levels of brain-derived neurotrophic factor (BDNF), VGF, and PCSK1 in double knockout (DKO) neurons.
Data are shown as mean log2FC. mRNA expression was analyzed by quantitative RT-PCR analysis, as described in Figure 6A–B. Protein levels of BDNF were analyzed by western blot (WB) shown in Figure 2E. Protein levels of VGF and PCSK1 were analyzed by mass spectrometry (Figure 3). Description of the analyses is provided in the corresponding figures.
Figure 6—figure supplement 2.
Figure 6—figure supplement 2.. Cre recombinase does not affect levels of the overexpressed dense core vesicle (DCV) reporter (NPY-pHluorin) in wild-type neurons.
(A) Representative images of NPY-pHluorin in ΔCre- and Cre-expressing neurons. Neurons were grown in mass cultures, silenced with sodium channel blocker tetrodotoxin (TTX, 1 µM) for 48 hr, and fixed on DIV14. White boxes indicate zoomed-in segments of neurites shown under every image. Scale bar 20 μm. (B) Mean intensity of NPY-pHluorin and tomosyn immunostaining in ΔCre- and Cre-expressing neurons exemplified in (A). Data are shown as mean ± SD and were analyzed using a two-tailed unpaired t-test. n=18 neurons (plotted as dots)/ genotype. ns: not significant.
Author response image 1.
Author response image 1.. Effects of tetrodotoxin (TTX) and picrotoxin (PTX) on the mRNA levels of DCV cargos in (Δ)Cre-expressing neurons.
(A) mRNA levels of DCV cargo genes upon treatment of (Δ)Cre-expressing cultures with either 1 μM TTX or 50 μM PTX. (B) mRNA levels of DCV cargo genes upon treatment of (Δ)Cre-expressing cultures with a combination of 1 μM TTX and 50 μM PTX. Data are shown as fold changes (FC) relative to the averaged ΔCre-untreated control levels. n=3 culture preparations/ genotype. Dots represent individual cultures; bars are geometric means. Log2FC were analyzed using two-way ANOVA with Holm-Šídák's multiple comparisons test. *p < 0.05; **p < 0.01; ***p < 0.001.
Author response image 2.
Author response image 2.. Immunostaining of DIV14 network cultures transduced with (Δ)Cre-mCherry at DIV0.
Expression of Cre, but not ΔCre lacking the catalytic domain, resulted in a loss of specific tomosyn staining in nearly all imaged neurons. Scale bar 100 μM.
Author response image 3.
Author response image 3.. Effect of lysosomal proteolysis inhibition by E64d (30 μM for 24h) on levels of BDNF and CHGB.
(A) Representative images of the BDNF immunostaining and quantification of the somatic BDNF signal in control- and E64d-treated neurons. Scale bar 20 μm. Data were analyzed using a two-tailed unpaired t-test. n=8 neurons/ condition. **p < 0.01. (B) Colocalization of BDNF with the endolysosomal marker LIMP2 in E64d-treated neurons. Scale bar 20 μm. (C) Levels of CHGB as detected by WB in control and E64d-treated neurons. Equal loading was verified by immunodetection of tubulin. Data were analyzed using a two-tailed paired t-test. n=4 culture preparations.

Update of

  • doi: 10.1101/2022.12.18.520925

Similar articles

Cited by

References

    1. Arora S, Saarloos I, Kooistra R, van de Bospoort R, Verhage M, Toonen RF. SNAP-25 gene family members differentially support secretory vesicle fusion. Journal of Cell Science. 2017;130:1877–1889. doi: 10.1242/jcs.201889. - DOI - PubMed
    1. Baba T, Sakisaka T, Mochida S, Takai Y. PKA-catalyzed phosphorylation of tomosyn and its implication in Ca2+-dependent exocytosis of neurotransmitter. The Journal of Cell Biology. 2005;170:1113–1125. doi: 10.1083/jcb.200504055. - DOI - PMC - PubMed
    1. Barak B, Williams A, Bielopolski N, Gottfried I, Okun E, Brown MA, Matti U, Rettig J, Stuenkel EL, Ashery U. Tomosyn expression pattern in the mouse hippocampus suggests both presynaptic and postsynaptic functions. Frontiers in Neuroanatomy. 2010;4:149. doi: 10.3389/fnana.2010.00149. - DOI - PMC - PubMed
    1. Ben-Simon Y, Rodenas-Ruano A, Alviña K, Lam AD, Stuenkel EL, Castillo PE, Ashery U. A combined optogenetic-knockdown strategy reveals a major role of Tomosyn in Mossy fiber synaptic plasticity. Cell Reports. 2015;12:396–404. doi: 10.1016/j.celrep.2015.06.037. - DOI - PMC - PubMed
    1. Bielopolski N, Lam AD, Bar-On D, Sauer M, Stuenkel EL, Ashery U. Differential interaction of tomosyn with syntaxin and SNAP25 depends on domains in the WD40 β-propeller core and determines its inhibitory activity. The Journal of Biological Chemistry. 2014;289:17087–17099. doi: 10.1074/jbc.M113.515296. - DOI - PMC - PubMed

Publication types

Grants and funding

The funders had no role in study design, data collection and interpretation, or the decision to submit the work for publication.