. 2023 Sep 9;14(1):5551.
doi: 10.1038/s41467-023-41188-8.

Dominance vs epistasis: the biophysical origins and plasticity of genetic interactions within and between alleles

Affiliations

Dominance vs epistasis: the biophysical origins and plasticity of genetic interactions within and between alleles

Xuan Xie et al. Nat Commun. .

Abstract

An important challenge in genetics, evolution and biotechnology is to understand and predict how mutations combine to alter phenotypes, including molecular activities, fitness and disease. In diploids, mutations in a gene can combine on the same chromosome or on different chromosomes as a "heteroallelic combination". However, a direct comparison of the extent, sign, and stability of the genetic interactions between variants within and between alleles is lacking. Here we use thermodynamic models of protein folding and ligand-binding to show that interactions between mutations within and between alleles are expected in even very simple biophysical systems. Protein folding alone generates within-allele interactions and a single molecular interaction is sufficient to cause between-allele interactions and dominance. These interactions change differently, quantitatively and qualitatively as a system becomes more complex. Altering the concentration of a ligand can, for example, switch alleles from dominant to recessive. Our results show that intra-molecular epistasis and dominance should be widely expected in even the simplest biological systems but also reinforce the view that they are plastic system properties and so a formidable challenge to predict. Accurate prediction of both intra-molecular epistasis and dominance will require either detailed mechanistic understanding and experimental parameterization or brute-force measurement and learning.


Conflict of interest statement

The authors declare no competing interests.

Figures

Fig. 1
Fig. 1. Quantifying within-allele, between-allele genetic interactions and dominance.
ad Two single mutations each on a chromosome of the same gene can combine within the same allele (a), quantified as within-allele interactions (intra-molecular epistasis) (b) or combine between two different alleles of the same gene (c), quantified as between-allele interactions (d), based on the additive or log-additive expectations (b, d). For within-allele mutation combinations, the lower bound of the expected phenotype is set to 0.5 AU (arbitrary unit), with the dotted grey empty circle indicating the expected phenotype below 0.5 AU and the solid grey circle indicating the new expected phenotype set to 0.5 AU. e, f How two homozygous mutations combine (e) is quantified as dominance based on the additive expectation (f).
Fig. 2
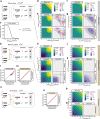
Fig. 2. Protein folding generates intra-molecular epistasis but not dominance.
a, b Two-state protein folding system (Model 1) with two mutations within- (a) or between alleles (b). Phenotypes are determined by the folded protein concentration marked with grey-shaded boxes. c The relationship between the free energy changes of protein folding and folded protein fraction of homozygotes. The grey dashed line marks the wild-type protein free energy of folding. dk Heatmaps show how two mutations combine within- (dg) or between alleles (hk) when they are ordered by free energy changes (d, e, h, i) or phenotypes (f, g, j, k). Black lines indicate phenotypic iso-chores. l, m Relationships between the observed and expected phenotypes with additive expectation when combining two detrimental mutants within- (l) or between alleles (m). The darker the colour, the higher the density of the simulated data points. n Compound heterozygotes derived from two homozygous mutations within a two-state protein folding system (Model 1). o Relationships between the observed and expected phenotypes with additive expectation when combining two detrimental homozygous mutants. p, q Heatmaps show how two homozygous mutations combine when they are ordered by phenotypes either calculated (p) or expected based on the phenotype additivity (q). Black lines indicate phenotypic iso-chores.
Fig. 3
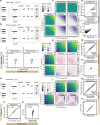
Fig. 3. Ligand binding generates between-allele interactions and dominance.
a, b Three-state protein system with unfolded, folded, and ligand-bound states (Model 2), with two mutations of the same gene within- (a) or between alleles (b). Phenotypes are determined by the ligand-bound protein concentration marked with grey-shaded boxes. c, d Heatmaps showing how two mutations both affect the same biophysical parameters combine: protein-folding (the second column) or ligand-binding (the third column) when they are ordered by the phenotype. e, g Relationships between the observed and expected phenotypes with additive expectation when combining two detrimental mutants within (e) or between alleles (g). fhj Comparisons of interaction scores between different types of double mutant combinations: protein-folding vs. ligand-binding mutants within- (f) or between-alleles (h), between- vs. within-allele interactions of the protein-folding (i) or ligand-binding (j) mutants. The darker the colour, the higher the density of the simulated data points at the given between- vs. within-allele interactions. k Compound heterozygotes derived from two homozygous mutations within a three-state protein system (Model 2). l Heatmaps showing how two mutations both affect the same biophysical parameters combine: protein-folding (the second column) or ligand-binding (the third column) when they are ordered by the homozygous phenotype. m Relationships between the observed and expected phenotypes when combining two detrimental homozygous mutants. n Comparison of dominance between different types of double mutant combinations: protein-folding vs. ligand-binding mutants. o, p Comparisons of expected phenotypes (o) and dominance vs. between-allele interaction scores (p) for the same compound heterozygote mutants. The darker the colour, the higher the density of the simulated data points.
Fig. 4
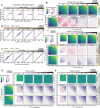
Fig. 4. Changes in ligand concentration switch between-allele interactions.
a, b, c The relationships between the observed and expected phenotypes with additive expectation when combining two detrimental mutants within- (a), between (b) heterozygous alleles or homozygous alleles (c) at different ligand-protein ratios. dg Heatmaps show how two mutations combine within - (d, e) between heterozygous alleles (f), or homozygous alleles (g) when they both affect the same biophysical parameters: protein-folding (d, f, g) or ligand-binding (ef, g). For both between-allele mutant combinations, folding or binding double mutants are shown together since they are not distinguishable (f, g). Black lines indicate phenotypic iso-chores.
Fig. 5
Fig. 5. Nonlinear concentration-phenotype functions differentially transform dominance and epistasis.
a Linear, concave, convex and sigmoidal linking functions are used to transform protein concentrations into phenotypes. b Interaction scores based on the additive expectation for double mutants within- or between alleles with linear (Model 2), concave, convex, or sigmoidal protein concentration – phenotype relationships. c With vs. without nonlinear linking function comparisons of interaction scores based on the additive expectation. d Between- vs. within-allele double mutants’ interaction scores based on the additive expectation, with nonlinear linking functions. e Distribution of interaction scores based on additive expectation before and after nonlinear linking functions. The green arrow indicates the distribution shifting towards negative values while the magenta arrow indicates the distribution shifting towards positive values; the arrowheads point at the range after applying the nonlinear linking functions to the phenotype. f, g, h Dominance scores before and after nonlinear linking functions (f), distribution (g), and with vs. without nonlinear linking function comparisons (h).

Similar articles

Cited by

References

    1. Domingo J, Baeza-Centurion P, Lehner B. The causes and consequences of genetic interactions (Epistasis) Annu. Rev. Genom. Hum. Genet. 2019;20:433–460. doi: 10.1146/annurev-genom-083118-014857. - DOI - PubMed
    1. Frazer, et al. Disease variant prediction with deep generative models of evolutionary data. Nature. 2021;599:91–95. doi: 10.1038/s41586-021-04043-8. - DOI - PubMed
    1. Van Hout CV, et al. Exome sequencing and characterization of 49,960 individuals in the UK Biobank. Nature. 2020;586:749–756. doi: 10.1038/s41586-020-2853-0. - DOI - PMC - PubMed
    1. Mani RS, et al. Defining genetic interaction. Proc. Natl. Acad. Sci. USA. 2008;105:3461–3466. doi: 10.1073/pnas.0712255105. - DOI - PMC - PubMed
    1. Phillips PC. Epistasis-the essential role of gene interactions in the structure and evolution of genetic systems. Nat. Rev. Genet. 2008;9:855–867. doi: 10.1038/nrg2452. - DOI - PMC - PubMed

Publication types