. 2023 Aug 31;24(17):13514.
doi: 10.3390/ijms241713514.

Ryanodine Receptor Staining Identifies Viable Cardiomyocytes in Human and Rabbit Cardiac Tissue Slices

Affiliations

Ryanodine Receptor Staining Identifies Viable Cardiomyocytes in Human and Rabbit Cardiac Tissue Slices

Ann-Katrin M Pfeuffer et al. Int J Mol Sci. .

Abstract

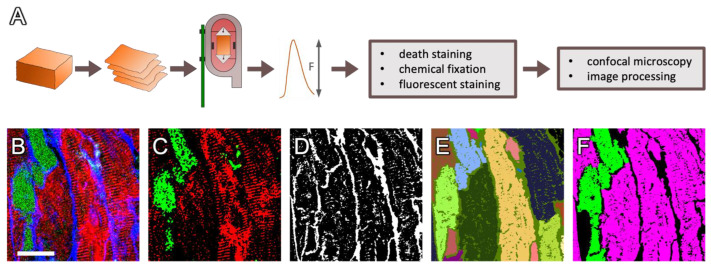
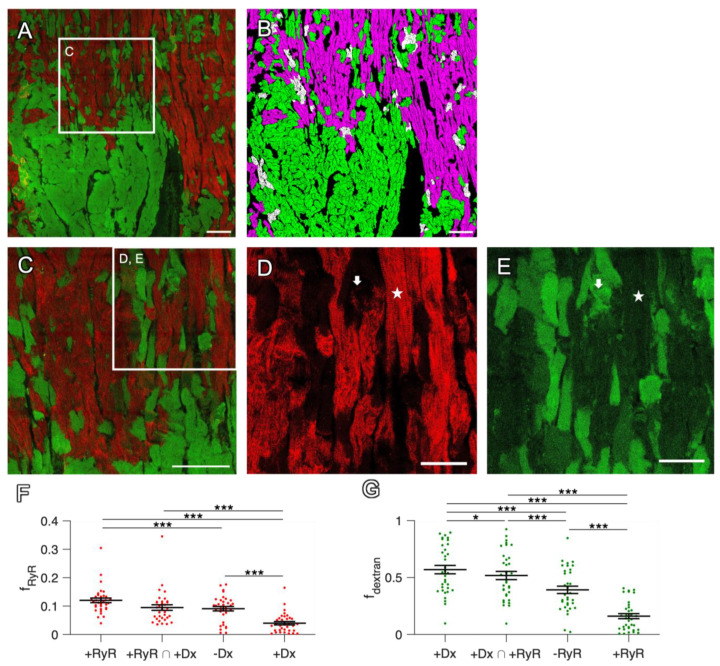
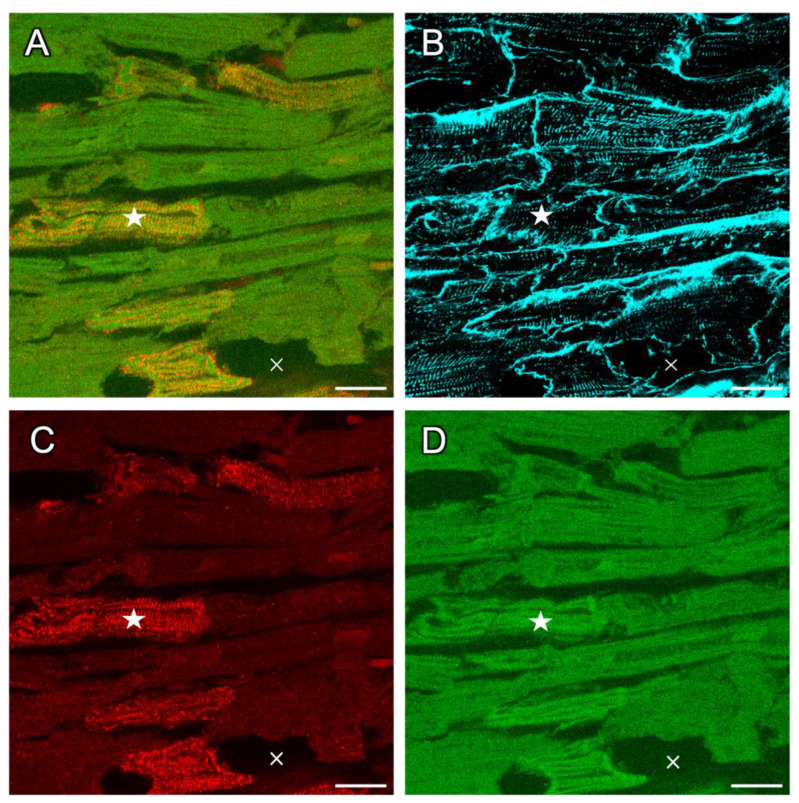
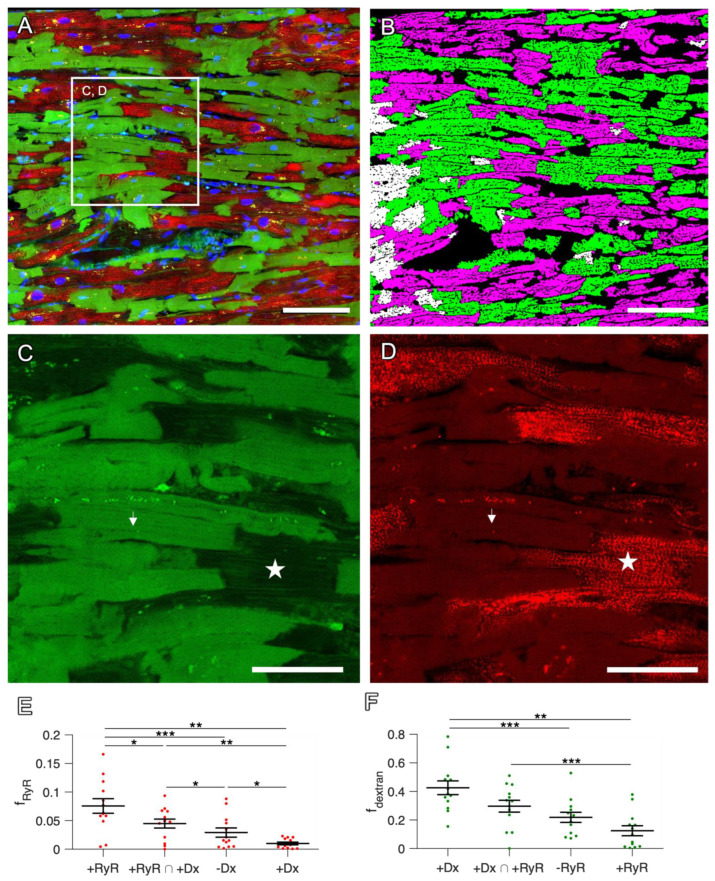
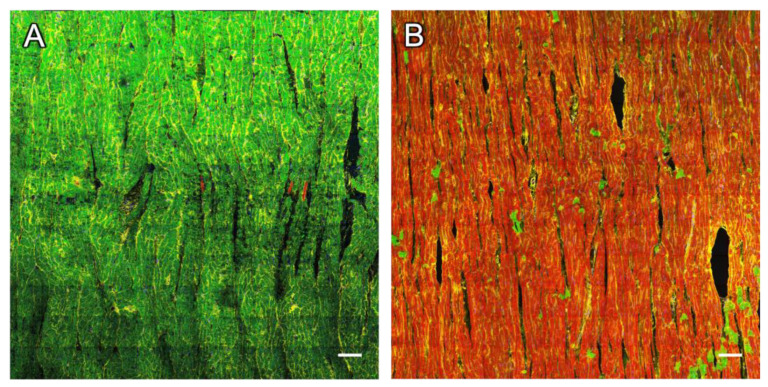
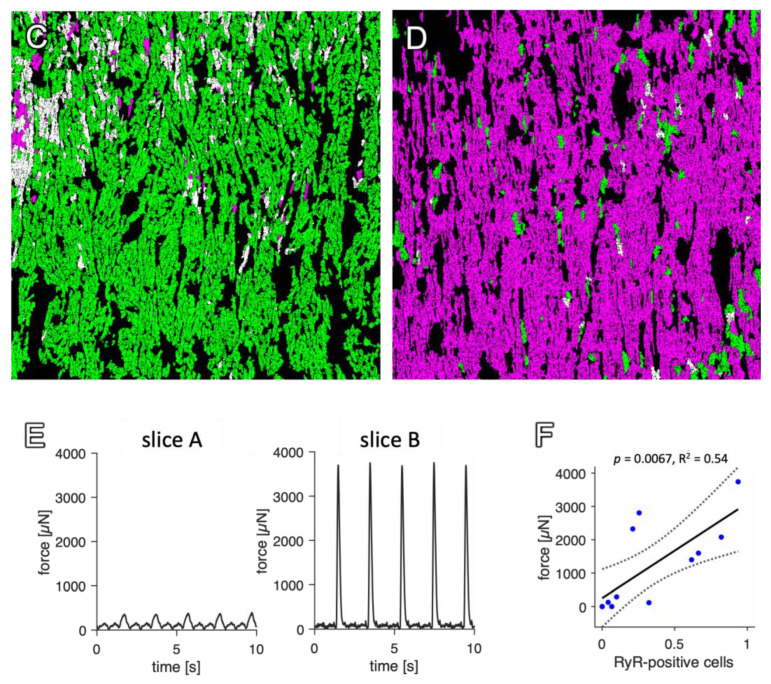
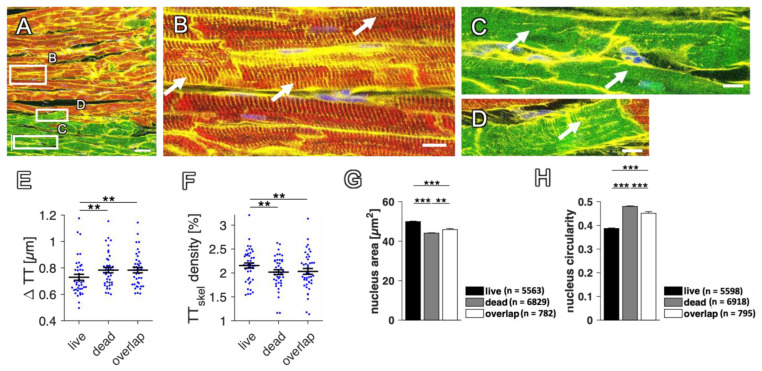
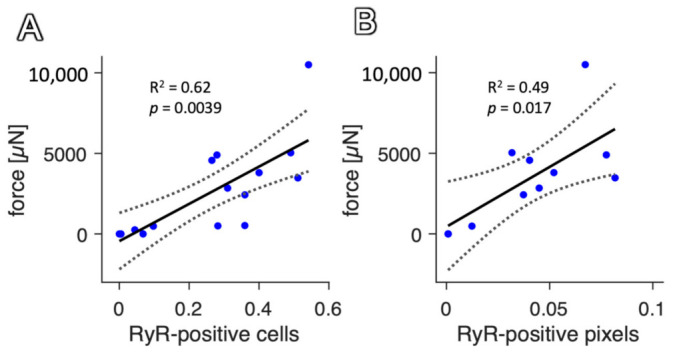
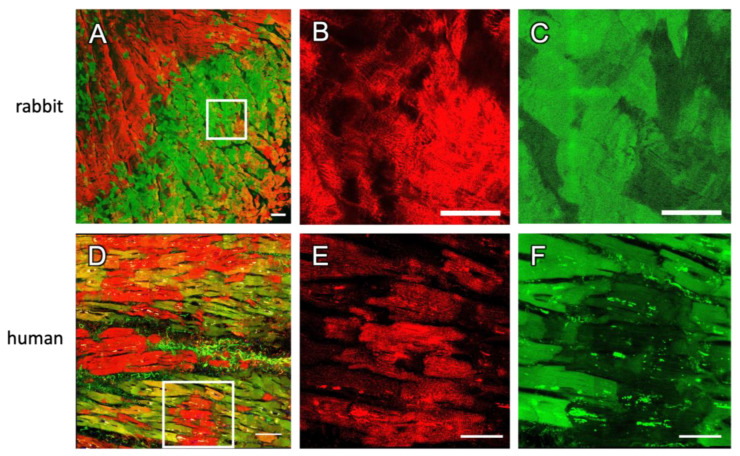
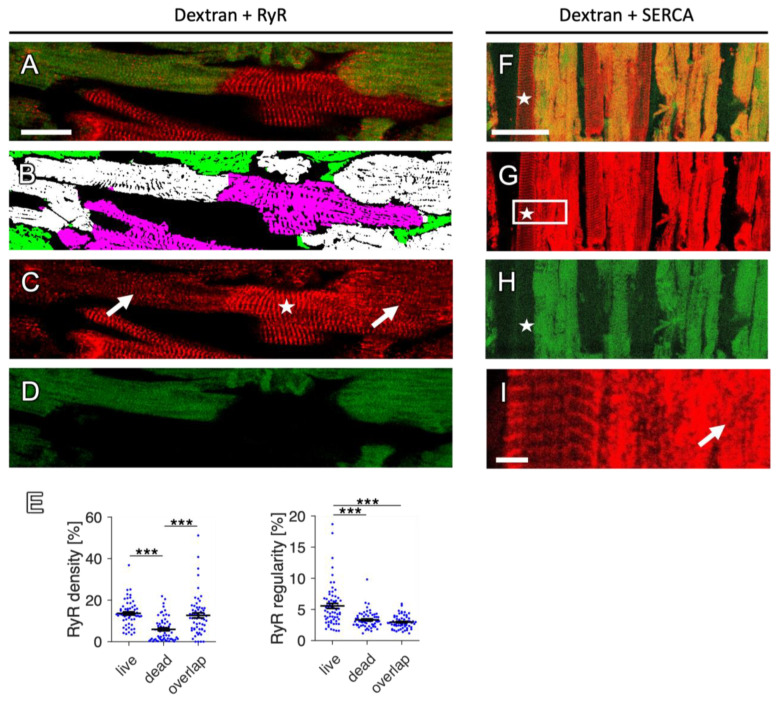
In terms of preserving multicellularity and myocardial function in vitro, the cultivation of beating myocardial slices is an emerging technique in basic and translational cardiac research. It can be used, for example, for drug screening or to study pathomechanisms. Here, we describe staining for viable cardiomyocytes based on the immunofluorescence of ryanodine receptors (RyRs) in human and rabbit myocardial slices. Biomimetic chambers were used for culture and measurements of contractile force. Fixable fluorophore-conjugated dextran, entering cells with a permeable membrane, was used for death staining. RyRs, nuclei and the extracellular matrix, including the t-system, were additionally stained and analyzed by confocal microscopy and image processing. We found the mutual exclusion of the RyR and dextran signals in cultivated slices. T-System density and nucleus size were reduced in RyR-negative/dextran-positive myocytes. The fraction of RyR-positive myocytes and pixels correlated with the contractile force. In RyR-positive/dextran-positive myocytes, we found irregular RyR clusters and SERCA distribution patterns, confirmed by an altered power spectrum. We conclude that RyR immunofluorescence indicates viable cardiomyocytes in vibratome-cut myocardial slices, facilitating the detection and differential structural analysis of living vs. dead or dying myocytes. We suggest the loss of sarcoplasmic reticulum integrity as an early event during cardiomyocyte death.

Keywords: cardiac tissue slices; death staining; ryanodine receptor; sarcoplasmic reticulum; viability assay.


Conflict of interest statement

T.S. is a shareholder of InVitroSys GmbH.

Figures

Figure 1
Figure 1
Methodological approach. (A) Human and rabbit myocardial slices were created from left-ventricular transmural samples with a vibratome and then cultivated for up to seven days in biomimetic cultivation chambers containing stimulation electrodes and a force transducer. Subsequently, dextran-based death staining was applied, followed by chemical fixation, fluorescent staining, confocal microscopy and image processing. (B) Example image of a rabbit cardiac slice stained with fixable, fluorescent dextran (green), for ryanodine receptors (RyR, red) and with wheat germ agglutinin (WGA, blue). (C) Histogram-based local thresholds were applied to identify the dextran-positive (green) and RyR-positive (red) pixels, as well as (D) the WGA-positive pixels (white). (E) Using the WGA distance map, a watershed transform was applied to segment individual myocytes (different colors). (F) For each cell segment, the number of RyR- and dextran-positive pixels was counted. If the fraction of these pixels within the segment exceeded a defined threshold, segments were classified as RyR-positive, i.e., living, myocytes (magenta) and dextran-positive, i.e., dead, myocytes (green). Scale bar length in (B) is 20 µm and also applies to (CF).
Figure 2
Figure 2
Mutual exclusion of dextran and RyR signals in confocal tile scans of rabbit cardiac slices. (A) Overview with complementary dextran (green) and RyR staining (red) of a slice after 7 d in culture. For clarity, the WGA signal is not shown. (B) Segmented image of (A) with 50.3% of all CM classified as RyR-positive (magenta), 54.2% as dextran-positive (green) and 4.5% double-positive for RyR and dextran (white). (C) Magnification of the box in (A). (D,E) Magnifications of the box in (C), showing dextran-negative and RyR-positive cells (star) with regularly aligned RyR signal, as well as dextran-positive and RyR-negative cells (arrow). Scale bar lengths: (AC) 100 µm, (D,E) 50 µm. (F) The fraction of RyR-positive pixels (fRyR) in cell segments that were classified as RyR-positive (+RyR), RyR-positive and dextran-positive (+RyR ∩ +Dx), dextran-negative (−Dx) or dextran-positive (+Dx). (G) The fraction of dextran-positive pixels (fdextran) in cell segments that were classified as dextran-positive (+Dx), RyR-positive and dextran-positive (+Dx ∩ +RyR), RyR-negative (−RyR) or RyR-positive (+RyR). Data points represent confocal images (n = 35) obtained from 22 slices. Statistical test: paired t-test. p values after correction for multiple comparisons: * p < 0.05, *** p < 0.001.
Figure 3
Figure 3
Dextran-RyR co-staining of rabbit tissue permeabilized with saponin. (A) Region of a 2D confocal tile scan showing that all cardiac myocytes contain dextran (green), while only some myocytes exhibit RyR immunofluorescent signals (red). The overlay of green and red signals appears as yellow (example marked by a star). (B) WGA signal (cyan) showing the extracellular matrix (ECM) and cell membranes. Note that image regions devoid of dextran signal belong the ECM or to areas without any cells (cross). (C) RyR signal only. (D) Dextran signal only. The cell marked with a star is RyR-positive and displays a regular alignment of RyR clusters despite the uptake of dextran due to the permeabilization of the membrane by saponin. Length of the scale bars is 20 µm.
Figure 4
Figure 4
Mutual exclusion of dextran and RyR signals in confocal tile scans of human cardiac slices. (A) Overview with signals of dextran (green), RyR staining (red) and DAPI (blue) of a slice after 6 d in culture. For clarity, the WGA signal is not shown. (B) Segmented image of (A) with 46.0% of all CM classified as RyR-positive (magenta), 45.8% as dextran-positive (green) and 8.6% double-positive for RyR and dextran (white). (C,D) Magnifications of the box in (A), showing dextran-negative and RyR-positive cells (star) with regularly aligned RyR signal, as well as dextran-positive and RyR-negative cells (arrow). Scale bar lengths: (A,B) 100 µm, (C,D) 50 µm. (E) The fraction of RyR-positive pixels (fRyR) in cell segments that were classified as RyR-positive (+RyR), RyR-positive and dextran-positive (+RyR ∩ +Dx), dextran-negative (−Dx) or dextran-positive (+Dx). (F) The fraction of dextran-positive pixels (fdextran) in cell segments that were classified as dextran-positive (+Dx), RyR-positive and dextran-positive (+Dx ∩ +RyR), RyR-negative (−RyR) or RyR-positive (+RyR). Data points represent confocal images (n = 13) obtained from 4 slices. Statistical test: paired t-test. p values after correction for multiple comparisons: * p < 0.05, ** p < 0.01, *** p < 0.001.
Figure 5
Figure 5
Correlation of RyR-positive myocytes with contraction amplitude in rabbit slices after 1d in culture. (A) 2D confocal tile scan image of a tissue slice with low contraction force. Dextran signal (green) and RyR signal (red) are shown. Overlay appears in yellow. (B) Image of a slice with higher contraction force than (A). (C,D) Segmented images of (A,B), respectively, classified into RyR-positive (living, magenta) and dextran-positive (dead, green) cells. Double-positive cells appear white. Scale bar length is 100 µm. (E) Example traces of contraction force measurements corresponding to the slices shown in (A,B). Pacing frequency was 0.5 Hz. (F) Linear regression model with contraction force as dependent variable and fraction of RyR-positive cells as predicting variable (n = 12 observations). F-statistic vs. constant model: p = 0.0067; coefficient of determination: R2 = 0.54.
Figure 5
Figure 5
Correlation of RyR-positive myocytes with contraction amplitude in rabbit slices after 1d in culture. (A) 2D confocal tile scan image of a tissue slice with low contraction force. Dextran signal (green) and RyR signal (red) are shown. Overlay appears in yellow. (B) Image of a slice with higher contraction force than (A). (C,D) Segmented images of (A,B), respectively, classified into RyR-positive (living, magenta) and dextran-positive (dead, green) cells. Double-positive cells appear white. Scale bar length is 100 µm. (E) Example traces of contraction force measurements corresponding to the slices shown in (A,B). Pacing frequency was 0.5 Hz. (F) Linear regression model with contraction force as dependent variable and fraction of RyR-positive cells as predicting variable (n = 12 observations). F-statistic vs. constant model: p = 0.0067; coefficient of determination: R2 = 0.54.
Figure 6
Figure 6
Analysis and comparison of microstructural parameters in living and dead rabbit cardiomyocytes. (A) WGA (yellow), RyR (red), dextran (green) and DAPI (blue) signals in a confocal scan of a rabbit slice after 1 day in culture. (B) Magnified region indicated in (A) with RyR-positive (living) myocytes. Arrows point to t-tubules with high density and regularity. (C,D) Magnified regions indicated in (A) with dextran-positive (dead) myocytes. (C) Arrows point to remodeled t-tubules and regions with low t-tubule density and regularity. (D) Arrow points to dense t-system. Scale bar length in (A) is 50 µm. Scale bar length in (B–D) is 10 µm. (E) Mean intracellular t-tubule distance (ΔTT) was analyzed in living (live), dead and double-positive (overlap) cardiomyocytes. Note that higher values indicate fewer t-tubules. (F) Density of the skeletonized (to one-pixel width reduced) t-tubules in living, dead and double-positive cardiomyocytes. n = 62 images, 35 slices, N = 8 animals, paired t-test. p values after multiple comparison correction: ** p < 0.01. (G) Mean nucleus area in the different myocyte compartments; n indicates the number of analyzed nuclei. (H) Circularity of the nuclei, calculated by dividing the short axis by the long axis of each nucleus. p values after multiple comparison correction: ** p < 0.01, *** p < 0.001, unpaired t-test.
Figure 7
Figure 7
Correlation of contraction force with RyR-positive myocytes and pixels in rabbit tissue slices stained solely for RyR. (A) Linear regression model with contraction force as dependent variable and fraction of RyR-positive cells as predicting variable (N = 11). F-statistic vs. constant model: p = 0.0067; coefficient of determination: R2 = 0.54. (B) Linear regression model with contraction force as dependent variable and fraction of RyR-positive pixels as predicting variable (N = 11). F-statistic vs. constant model: p = 0.017; coefficient of determination: R2 = 0.49.
Figure 8
Figure 8
Two-dimensional tile scans of non-cultivated rabbit and human tissue slices after cutting with a vibratome. The tissue was stained directly after slicing with dextran (green) and for RyRs (red). (AC) Rabbit slices with magnifications of the indicated region in (A) shown in (B,C). (D–F) Human slices with magnifications of the indicated region in (D) shown in (E,F). Scale bar length: (A,D) 100 µm, (B,C,E,F) 50 µm.
Figure 9
Figure 9
RyR and SERCA patterns in dextran-stained rabbit cardiomyocytes. (A) RyR (red) and dextran signal (green) shown as overlay. (B) Segmented image with myocytes classified as dextran-positive (green), RyR-positive (magenta) or double-positive (white). (C) RyR signal only, showing a regular z-line pattern in dextran-negative myocytes (star) and a blurred, less clustered pattern in double-positive myocytes (arrows). (D) Dextran signal only. Scale bar length in (A) is 20 µm and also applies to (BD). (E) Quantitative analysis of RyR density (percentage of RyR-positive pixels within myocytes) and regularity, measured by the percentage of the image energy explained by the spectral density in the frequency domain 1/(2.5 µm) through 1/(1.5 µm). These parameters were calculated in RyR-positive (live), dextran-positive (dead) and double-positive (overlap) myocytes. p values after multiple comparison correction: *** p < 0.001 (paired t-test, n = 62 images from 35 slices, N = 8 rabbit hearts). (F) Overlay of SERCA (red) and dextran (green) signals showing dextran-positive cells that also contain SERCA signal (appearing yellow). A dextran-negative cell with regularly aligned structure of the SERCA signal (z-line pattern) is highlighted (star), while, in dextran-positive cells, the SERCA pattern is irregular. A larger image region is provided in the Supplementary Materials (Figure S2). (G) SERCA signal only. (H) Dextran signal only. (I) Magnification of the region indicated in (G). The arrow points to a dextran-positive cell with loss of the regular SERCA distribution. Scale bar length in (F) is 50 µm and also applies to (G,H). Scale bar length in (I) is 5 µm.

Similar articles

Cited by

References

    1. Fischer C., Milting H., Fein E., Reiser E., Lu K., Seidel T., Schinner C., Schwarzmayr T., Schramm R., Tomasi R., et al. Long-term functional and structural preservation of precision-cut human myocardium under continuous electromechanical stimulation in vitro. Nat. Commun. 2019;10:117. doi: 10.1038/s41467-018-08003-1. - DOI - PMC - PubMed
    1. Abu-Khousa M., Fiegle D.J., Sommer S.T., Minabari G., Milting H., Heim C., Weyand M., Tomasi R., Dendorfer A., Volk T., et al. The Degree of t-System Remodeling Predicts Negative Force-Frequency Relationship and Prolonged Relaxation Time in Failing Human Myocardium. Front. Physiol. 2020;11:182. doi: 10.3389/fphys.2020.00182. - DOI - PMC - PubMed
    1. Watson S.A., Duff J., Bardi I., Zabielska M., Atanur S.S., Jabbour R.J., Simon A., Tomas A., Smolenski R.T., Harding S.E., et al. Biomimetic electromechanical stimulation to maintain adult myocardial slices in vitro. Nat. Commun. 2019;10:2168. doi: 10.1038/s41467-019-10175-3. - DOI - PMC - PubMed
    1. Ou Q., Jacobson Z., Abouleisa R.R.E., Tang X.-L., Hindi S.M., Kumar A., Ivey K.N., Giridharan G., El-Baz A., Brittian K., et al. Physiological Biomimetic Culture System for Pig and Human Heart Slices. Circ. Res. 2019;125:628–642. doi: 10.1161/CIRCRESAHA.119.314996. - DOI - PMC - PubMed
    1. Lother A., Kohl P. The heterocellular heart: Identities, interactions, and implications for cardiology. Basic Res. Cardiol. 2023;118:30. doi: 10.1007/s00395-023-01000-6. - DOI - PMC - PubMed

Substances

LinkOut - more resources