Human Mast Cells Upregulate Cathepsin B, a Novel Marker of Itch in Psoriasis
- PMID: 37681909
- PMCID: PMC10486964
- DOI: 10.3390/cells12172177
Human Mast Cells Upregulate Cathepsin B, a Novel Marker of Itch in Psoriasis
Abstract
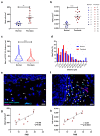
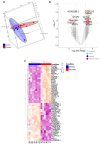
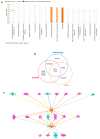
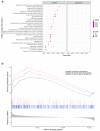
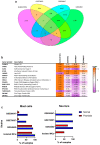
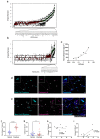
Mast cells (MCs) contribute to skin inflammation. In psoriasis, the activation of cutaneous neuroimmune networks commonly leads to itch. To dissect the unique contribution of MCs to the cutaneous neuroinflammatory response in psoriasis, we examined their density, distribution, relation to nerve fibres and disease severity, and molecular signature by comparing RNA-seq analysis of MCs isolated from the skin of psoriasis patients and healthy volunteers. In involved psoriasis skin, MCs and Calcitonin Gene-Related Peptide (CGRP)-positive nerve fibres were spatially associated, and the increase of both MC and nerve fibre density correlated with disease severity. Gene set enrichment analysis of differentially expressed genes in involved psoriasis skin showed significant representation of neuron-related pathways (i.e., regulation of neuron projection along with dendrite and dendritic spine morphogenesis), indicating MC engagement in neuronal development and supporting the evidence of close MC-nerve fibre interaction. Furthermore, the analysis of 208 identified itch-associated genes revealed that CTSB, TLR4, and TACR1 were upregulated in MCs in involved skin. In both whole-skin published datasets and isolated MCs, CTSB was found to be a reliable indicator of the psoriasis condition. Furthermore, cathepsin B+ cells were increased in psoriasis skin and cathepsin B+ MC density correlated with disease severity. Therefore, our study provides evidence that cathepsin B could serve as a common indicator of the MC-dependent itch signature in psoriasis.
Keywords: cathepsin B; itch; mast cells; psoriasis.
Conflict of interest statement
The authors declare no conflict of interest. C.T. and R.B. were supported by funding from the Medical Research Council (UK). R.B.W. is supported by the Manchester NIHR Biomedical Research Centre.
Figures

Similar articles
-
Pruritogenic mediators in psoriasis vulgaris: comparative evaluation of itch-associated cutaneous factors.Br J Dermatol. 2003 Oct;149(4):718-30. doi: 10.1046/j.1365-2133.2003.05586.x. Br J Dermatol. 2003. PMID: 14616362
-
Mast cells and tryptase are linked to itch and disease severity in mycosis fungoides: Results of a pilot study.Front Immunol. 2022 Aug 10;13:930979. doi: 10.3389/fimmu.2022.930979. eCollection 2022. Front Immunol. 2022. PMID: 36032167 Free PMC article.
-
Altered gene expression signatures by calcitonin gene-related peptide promoted mast cell activity in the colon of stress-induced visceral hyperalgesia mice.Neurogastroenterol Motil. 2021 Jun;33(6):e14073. doi: 10.1111/nmo.14073. Epub 2020 Dec 31. Neurogastroenterol Motil. 2021. PMID: 33382180
-
Mast Cells and Sensory Nerves Contribute to Neurogenic Inflammation and Pruritus in Chronic Skin Inflammation.Front Cell Neurosci. 2019 Sep 18;13:422. doi: 10.3389/fncel.2019.00422. eCollection 2019. Front Cell Neurosci. 2019. PMID: 31619965 Free PMC article. Review.
-
Role of PAR-2 in Neuroimmune Communication and Itch.In: Carstens E, Akiyama T, editors. Itch: Mechanisms and Treatment. Boca Raton (FL): CRC Press/Taylor & Francis; 2014. Chapter 11. In: Carstens E, Akiyama T, editors. Itch: Mechanisms and Treatment. Boca Raton (FL): CRC Press/Taylor & Francis; 2014. Chapter 11. PMID: 24829999 Free Books & Documents. Review.
Cited by
-
Pathogenesis of Inflammation in Skin Disease: From Molecular Mechanisms to Pathology.Int J Mol Sci. 2024 Sep 21;25(18):10152. doi: 10.3390/ijms251810152. Int J Mol Sci. 2024. PMID: 39337637 Free PMC article. Review.
-
The MRGPRX2-substance P pathway regulates mast cell migration.iScience. 2024 Sep 16;27(10):110984. doi: 10.1016/j.isci.2024.110984. eCollection 2024 Oct 18. iScience. 2024. PMID: 39435146 Free PMC article.
-
Cysteine cathepsins and autoimmune diseases: A bidirectional Mendelian randomization.Medicine (Baltimore). 2024 Oct 25;103(43):e40268. doi: 10.1097/MD.0000000000040268. Medicine (Baltimore). 2024. PMID: 39470488 Free PMC article.
References
-
- Egan C.L., Viglione-Schneck M.J., Walsh L.J., Green B., Trojanowski J.Q., Whitaker-Menezes D., Murphy G.F. Characterization of unmyelinated axons uniting epidermal and dermal immune cells in primate and murine skin. J. Cutan. Pathol. 1998;25:20–29. doi: 10.1111/j.1600-0560.1998.tb01685.x. - DOI - PubMed
-
- Arizono N., Matsuda S., Hattori T., Kojima Y., Maeda T., Galli S.J. Anatomical variation in mast cell nerve associations in the rat small intestine, heart, lung, and skin. Similarities of distances between neural processes and mast cells, eosinophils, or plasma cells in the jejunal lamina propria. Lab. Investig. 1990;62:626–634. - PubMed
-
- Botchkarev V.A., Eichmüller S., Peters E.M., Pietsch P., Johansson O., Maurer M., Paus R. A simple immunofluorescence technique for simultaneous visualization of mast cells and nerve fibers reveals selectivity and hair cycle—Dependent changes in mast cell—Nerve fiber contacts in murine skin. Arch. Dermatol. Res. 1997;289:292–302. doi: 10.1007/s004030050195. - DOI - PubMed
Publication types
MeSH terms
Substances
Grants and funding
LinkOut - more resources
Full Text Sources
Medical
Molecular Biology Databases
Research Materials
Miscellaneous

