An Alzheimer's disease risk variant in TTC3 modifies the actin cytoskeleton organization and the PI3K-Akt signaling pathway in iPSC-derived forebrain neurons
- PMID: 37677864
- PMCID: PMC10538380
- DOI: 10.1016/j.neurobiolaging.2023.07.007
An Alzheimer's disease risk variant in TTC3 modifies the actin cytoskeleton organization and the PI3K-Akt signaling pathway in iPSC-derived forebrain neurons
Abstract
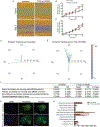
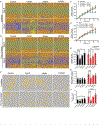
A missense variant in the tetratricopeptide repeat domain 3 (TTC3) gene (rs377155188, p.S1038C, NM_003316.4:c 0.3113C>G) was found to segregate with disease in a multigenerational family with late-onset Alzheimer's disease. This variant was introduced into induced pluripotent stem cells (iPSCs) derived from a cognitively intact individual using CRISPR genome editing, and the resulting isogenic pair of iPSC lines was differentiated into cortical neurons. Transcriptome analysis showed an enrichment for genes involved in axon guidance, regulation of actin cytoskeleton, and GABAergic synapse. Functional analysis showed that the TTC3 p.S1038C iPSC-derived neuronal progenitor cells had altered 3-dimensional morphology and increased migration, while the corresponding neurons had longer neurites, increased branch points, and altered expression levels of synaptic proteins. Pharmacological treatment with small molecules that target the actin cytoskeleton could revert many of these cellular phenotypes, suggesting a central role for actin in mediating the cellular phenotypes associated with the TTC3 p.S1038C variant.
Keywords: Alzheimer’s disease (AD); Induced pluripotent stem cells (iPSCs); Tetratricopeptide repeat domain 3 (TTC3) gene.
Copyright © 2023 The Authors. Published by Elsevier Inc. All rights reserved.
Conflict of interest statement
Disclosure statement The authors report no conflict of interest.
Figures


Update of
-
An Alzheimer's disease risk variant in TTC3 modifies the actin cytoskeleton organization and the PI3K-Akt signaling pathway in iPSC-derived forebrain neurons.bioRxiv [Preprint]. 2023 May 25:2023.05.25.542316. doi: 10.1101/2023.05.25.542316. bioRxiv. 2023. Update in: Neurobiol Aging. 2023 Nov;131:182-195. doi: 10.1016/j.neurobiolaging.2023.07.007. PMID: 37292815 Free PMC article. Updated. Preprint.
Similar articles
-
An Alzheimer's disease risk variant in TTC3 modifies the actin cytoskeleton organization and the PI3K-Akt signaling pathway in iPSC-derived forebrain neurons.bioRxiv [Preprint]. 2023 May 25:2023.05.25.542316. doi: 10.1101/2023.05.25.542316. bioRxiv. 2023. Update in: Neurobiol Aging. 2023 Nov;131:182-195. doi: 10.1016/j.neurobiolaging.2023.07.007. PMID: 37292815 Free PMC article. Updated. Preprint.
-
Derivation of stem cell line UMi028-A-2 containing a CRISPR/Cas9 induced Alzheimer's disease risk variant p.S1038C in the TTC3 gene.Stem Cell Res. 2021 Apr;52:102258. doi: 10.1016/j.scr.2021.102258. Epub 2021 Feb 18. Stem Cell Res. 2021. PMID: 33626494
-
Segregation of a rare TTC3 variant in an extended family with late-onset Alzheimer disease.Neurol Genet. 2016 Jan 14;2(1):e41. doi: 10.1212/NXG.0000000000000041. eCollection 2016 Feb. Neurol Genet. 2016. PMID: 27066578 Free PMC article.
-
TTC3-Mediated Protein Quality Control, A Potential Mechanism for Cognitive Impairment.Cell Mol Neurobiol. 2022 Aug;42(6):1659-1669. doi: 10.1007/s10571-021-01060-z. Epub 2021 Feb 27. Cell Mol Neurobiol. 2022. PMID: 33638766 Free PMC article. Review.
-
The PI3K/Akt signaling axis in Alzheimer's disease: a valuable target to stimulate or suppress?Cell Stress Chaperones. 2021 Nov;26(6):871-887. doi: 10.1007/s12192-021-01231-3. Epub 2021 Aug 13. Cell Stress Chaperones. 2021. PMID: 34386944 Free PMC article. Review.
Cited by
-
Post-stroke hippocampal neurogenesis is impaired by microvascular dysfunction and PI3K signaling in cerebral amyloid angiopathy.Cell Rep. 2024 Oct 22;43(10):114848. doi: 10.1016/j.celrep.2024.114848. Epub 2024 Oct 10. Cell Rep. 2024. PMID: 39392753 Free PMC article.
-
Ang-1 and VEGF: central regulators of angiogenesis.Mol Cell Biochem. 2025 Feb;480(2):621-637. doi: 10.1007/s11010-024-05010-3. Epub 2024 Apr 23. Mol Cell Biochem. 2025. PMID: 38652215 Review.
References
Publication types
MeSH terms
Substances
Grants and funding
LinkOut - more resources
Full Text Sources
Medical
Research Materials

