Lymphocyte subset phenotyping for the prediction of progression to inflammatory arthritis in anti-citrullinated-peptide antibody-positive at-risk individuals
- PMID: 37676828
- PMCID: PMC11147546
- DOI: 10.1093/rheumatology/kead466
Lymphocyte subset phenotyping for the prediction of progression to inflammatory arthritis in anti-citrullinated-peptide antibody-positive at-risk individuals
Abstract
Objectives: Inflammatory arthritis (IA) is considered the last stage of a disease continuum, where features of systemic autoimmunity can appear years before clinical synovitis. Time to progression to IA varies considerably between at-risk individuals, therefore the identification of biomarkers predictive of progression is of major importance. We previously reported on the value of three CD4+T cell subsets as biomarkers of progression. Here, we aim to establish the value of 18 lymphocyte subsets (LS) for predicting progression to IA.
Methods: Participants were recruited based on a new musculoskeletal complaint and being positive for anti-citrullinated-peptide antibody. Progression (over 10 years) was defined as the development of clinical synovitis. LS analysis was performed for lymphocyte lineages, naive/memory subsets, inflammation-related cells (IRC) and regulatory cells (Treg/B-reg). Modelling used logistic/Cox regressions.
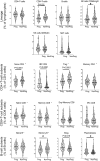
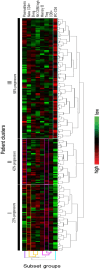
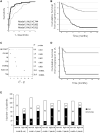
Results: Of 210 patients included, 93 (44%) progressed to IA, 41/93 (44%) within 12 months (rapid progressors). A total of 5/18 LS were associated with progression [Treg/CD4-naïve/IRC (adjusted P < 0.0001), CD8 (P = 0.021), B-reg (P = 0.015)] and three trends (NK-cells/memory-B-cells/plasmablasts). Unsupervised hierarchical clustering using these eight subsets segregated three clusters of patients, one cluster being enriched [63/109(58%)] and one poor [10/45(22%)] in progressors. Combining all clinical and LS variables, forward logistic regression predicted progression with accuracy = 85.7% and AUC = 0.911, selecting smoking/rheumatoid-factor/HLA-shared-epitope/tender-joint-count-78 and Treg/CD4-naive/CD8/NK-cells/B-reg/plasmablasts. To predict rapid progression, a Cox regression was performed resulting in a model combining smoking/rheumatoid factor and IRC/CD4-naive/Treg/NK-cells/CD8+T cells (AUC = 0.794).
Conclusion: Overall, progression was predicted by specific LS, suggesting potential triggers for events leading to the development of IA, while rapid progression was associated with a different set of subsets.
Keywords: RA; T cells; biomarkers; immunological techniques; laboratory diagnosis; lymphocytes; rheumatic diseases.
© The Author(s) 2023. Published by Oxford University Press on behalf of the British Society for Rheumatology.
Figures


Similar articles
-
T cell subsets: an immunological biomarker to predict progression to clinical arthritis in ACPA-positive individuals.Ann Rheum Dis. 2016 Oct;75(10):1884-9. doi: 10.1136/annrheumdis-2015-207991. Epub 2015 Dec 1. Ann Rheum Dis. 2016. PMID: 27613874 Free PMC article.
-
A predictive model for progression to clinical arthritis in at-risk individuals with arthralgia based on lymphocyte subsets and ACPA.Rheumatology (Oxford). 2024 Nov 1;63(11):3155-3163. doi: 10.1093/rheumatology/keae383. Rheumatology (Oxford). 2024. PMID: 39120892
-
T-cell subset abnormalities predict progression along the Inflammatory Arthritis disease continuum: implications for management.Sci Rep. 2020 Feb 28;10(1):3669. doi: 10.1038/s41598-020-60314-w. Sci Rep. 2020. PMID: 32111870 Free PMC article. Clinical Trial.
-
Determining in which pre-arthritis stage HLA-shared epitope alleles and smoking exert their effect on the development of rheumatoid arthritis.Ann Rheum Dis. 2022 Jan;81(1):48-55. doi: 10.1136/annrheumdis-2021-220546. Epub 2021 Jul 20. Ann Rheum Dis. 2022. PMID: 34285049 Free PMC article. Review.
-
[Anti-cyclic citrullinated peptide antibodies in rheumatoid arthritis: relation with clinical features, cytokines and HLA-DRB1].Biomedica. 2004 Jun;24(2):140-52. Biomedica. 2004. PMID: 15495594 Review. Spanish.
Cited by
-
Arthritis progressors have a decreased frequency of circulating autoreactive T cells during the at-risk phase of rheumatoid arthritis.RMD Open. 2024 Nov 18;10(4):e004510. doi: 10.1136/rmdopen-2024-004510. RMD Open. 2024. PMID: 39557489 Free PMC article.
References
-
- Hunt L, Emery P. Defining populations at risk of rheumatoid arthritis: the first steps to prevention. Nat Rev Rheumatol 2014;10:521–30. - PubMed
-
- Finckh A, Liang MH, van Herckenrode CM, de Pablo P. Long-term impact of early treatment on radiographic progression in rheumatoid arthritis: a meta-analysis. Arthritis Rheum 2006;55:864–72. - PubMed
-
- Nam JL, Hunt L, Hensor EM, Emery P. Enriching case selection for imminent RA: the use of anti-CCP antibodies in individuals with new non-specific musculoskeletal symptoms - a cohort study. Ann Rheum Dis 2016;75:1452–6. - PubMed
-
- Mankia K, Siddle H, Di Matteo A et al. A core set of risk factors in individuals at risk of rheumatoid arthritis: a systematic literature review informing the EULAR points to consider for conducting clinical trials and observational studies in individuals at risk of rheumatoid arthritis. RMD Open 2021;7:1–16. - PMC - PubMed
MeSH terms
Substances
LinkOut - more resources
Full Text Sources
Research Materials

