[Preprint]. 2023 Aug 22:2023.08.21.554166.
doi: 10.1101/2023.08.21.554166.

A suppressor screen in C. elegans identifies a multi-protein interaction interface that stabilizes the synaptonemal complex

Affiliations

A suppressor screen in C. elegans identifies a multi-protein interaction interface that stabilizes the synaptonemal complex

Lisa E Kursel et al. bioRxiv. .

Update in

Abstract

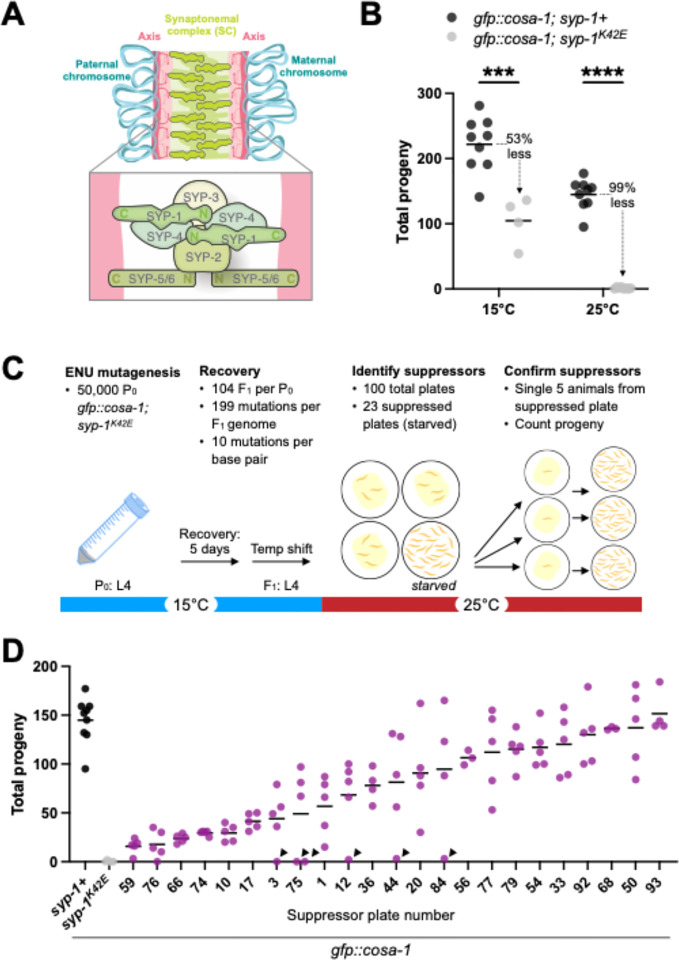
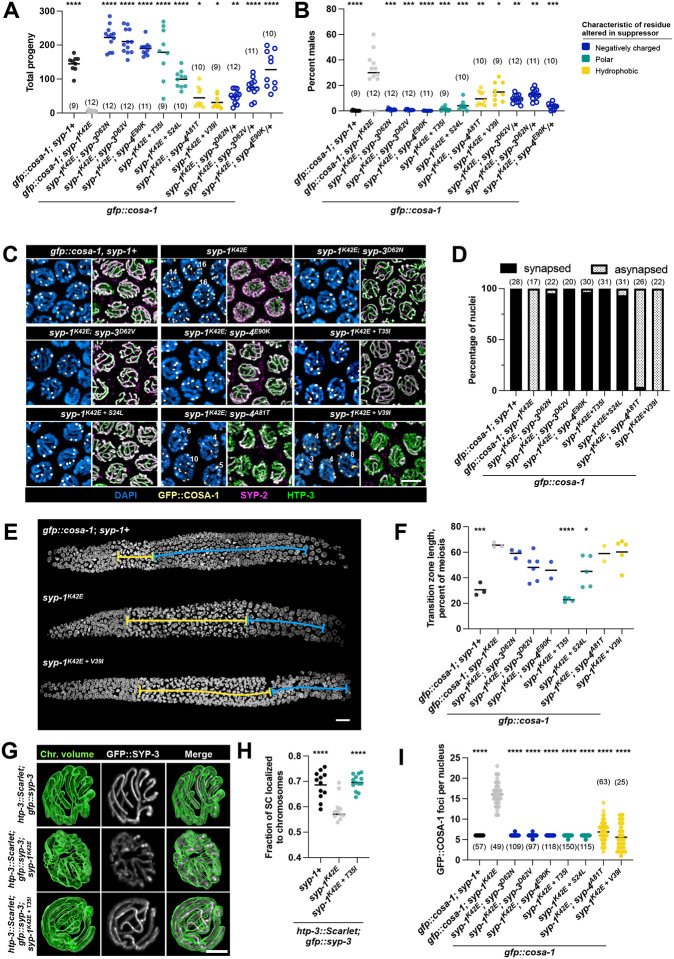
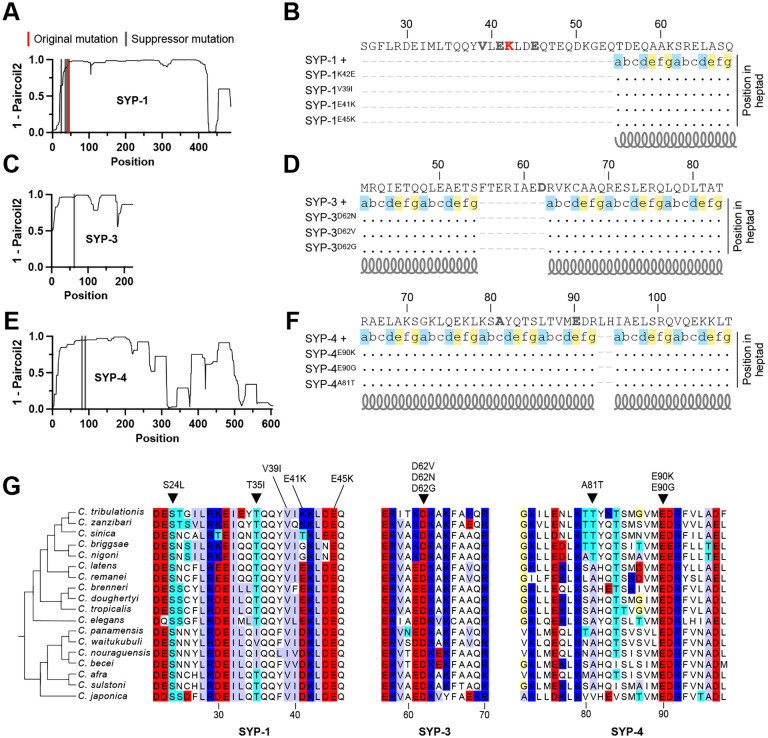
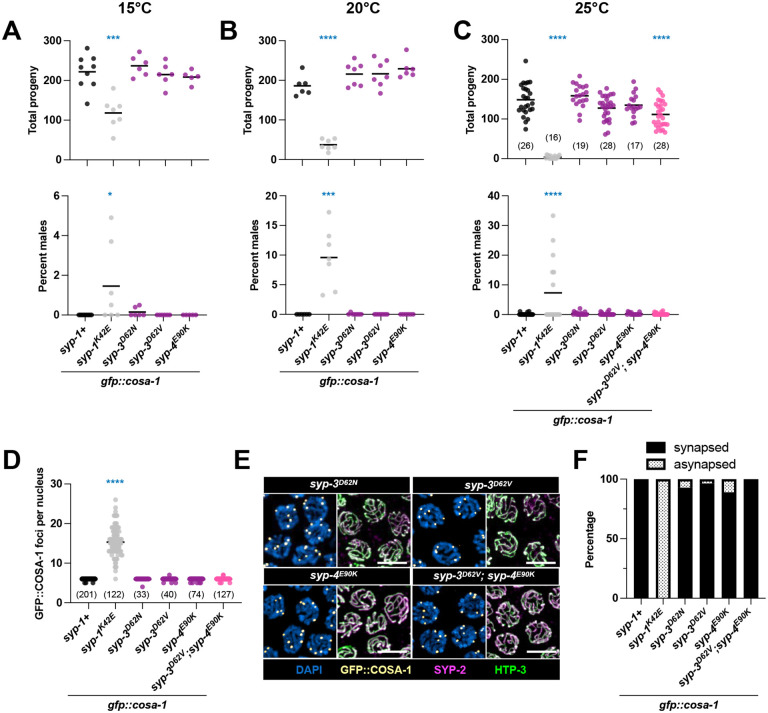
Successful chromosome segregation into gametes depends on tightly-regulated interactions between the parental chromosomes. During meiosis, chromosomes are aligned end-to-end by an interface called the synaptonemal complex, which also regulates exchanges between them. However, despite the functional and ultrastructural conservation of this essential interface, how protein-protein interactions within the synaptonemal complex regulate chromosomal interactions remains poorly understood. Here we describe a novel interaction interface in the C. elegans synaptonemal complex, comprised of short segments of three proteins, SYP-1, SYP-3 and SYP-4. We identified the interface through a saturated suppressor screen of a mutant that destabilizes the synaptonemal complex. The specificity and tight distribution of suppressors point to a charge-based interface that promotes interactions between synaptonemal complex subunits and, in turn, allows intimate interactions between chromosomes. Our work highlights the power of genetic studies to illuminate the mechanisms that underly meiotic chromosome interactions.

Keywords: BIOLOGICAL SCIENCES; C. elegans; Genetics; crossover; meiosis; suppressor screen; synaptonemal complex.


Conflict of interest statement

Competing Interest Statement: The authors declare no competing interests.

Figures

Figure 1:
Figure 1:. Mutagenesis screen identifies suppressors of syp-1K42Efertility defect.
(A) Top, cartoon of paired homologous chromosomes (blue) with the synaptonemal complex (SC, green) assembled between them. Bottom, cartoon depicting six SC proteins from C. elegans with the N- and C- termini of SYP-1 and SYP-5/6 labeled. (B) Total self-progeny from syp-1+ and syp-1K42E animals in a gfp::cosa-1 background at 15°C and 25°C. Asterisks indicate statistical significance of the comparison of total progeny between gfp::cosa-1; syp-1+ and gfp::cosa-1; syp-1K42E at 15°C and 25°C using an unpaired t-test. (C) Schematic of suppressor screen. We mutagenized 50,000 gfp::cosa-1; syp-1K42E animals (P0) using ENU and allowed them to recover at 15°C. After five days, when most F1s were at the L4 developmental stage, we shifted the worms to 25°C to apply selection. Suppressed plates were able to consume all of the bacterial lawn and starve the plate. We confirmed the suppression phenotype by picking five single worms from each suppressed plate and counting self-progeny at 25°C (quantified in D). (D) Total self-progeny from worms singled from 23 suppressed plates sorted by degree of suppression. Arrowheads indicate plates with zero to three total self-progeny. These plates likely contained non-suppressed animals, suggesting that when the worms were singled the selective sweep by the suppressors was still incomplete. In (A) and (C), mean values are shown by a horizontal black line and asterisks indicate p-values as follows: *** < 0.001, **** < 0.0001.
Figure 2:
Figure 2:. All suppressor strains contain mutations in SC proteins.
(A) Pipeline used to identify suppressor mutations. We performed Sanger sequencing on portions of syp-1 and syp-3 in all suppressed lines to confirm the presence of the original syp-1K42E mutation and to identify possible suppressor mutations. We performed whole genome sequencing on 16 suppressor strains and controls. We used GATK to call variants unique to each suppressor strain and found an additional 14 unique mutations in in SC proteins, some of which occurred multiple times independently. (B) Chromatograph traces from Sanger sequencing of syp-1 in gfp::cosa-1; syp-1K42E and the revertant strain identified in the screen (gfp::cosa-1; syp-1E42K) aligned to the reference genome. The reference genome and revertant strain each encode the lysine (K) at position 42 (yellow box) with a different codon (AAG and AAA, respectively). In addition, the silent T->C mutation in the codon encoding a lysine at position 40, which was introduced while creating the original syp-1K42E mutation, is present in the revertant. (C) Schematic depicting the strategy used for variant calling. We identified SNPs and indels in gfp::cosa-1; syp-1K42E and in the suppressed lines. Mutations present in gfp::cosa-1; syp-1K42E but not in the reference genome were considered background mutations. We subtracted these background mutations from the mutations in each suppressed strain to generate a list of putative suppressor mutations. (D) Bar graph showing the number of unique, non-background mutations in each sequenced suppressed line. Average number of mutations per genome = 199. (E) Histogram of Poisson distribution for λ = 10, the average number of ENU-generated mutations per base pair in the screen. The likelihood that substitution in a base pair was not screened for suppression is < 5×10⁻⁵.
Figure 3:
Figure 3:. Strength of suppression correlates with amino acid charge.
Total progeny (A), and percent male self-progeny (B), for seven representative suppressors at 25°C. Phenotype of the heterozygous state of the three strongest suppressors is also shown in (A) and (B). Number of replicates are listed in parentheses. Throughout the figure, suppressor strains are colored according to the characteristic of the residue that was mutated in the screen. (C) Immunofluorescence images of pachytene nuclei showing the extent of synapsis and GFP::COSA-1 foci for representative suppressed genotypes at 25°C. The number of foci is indicated in nuclei with more or less than the six expected GFP::COSA-1 foci. Scale bar = 5 μm. (D) Bar graphs showing percentage of early pachytene nuclei with partially or completely asynapsed chromosomes at 25°C. N values in parentheses indicate the number of nuclei examined. (E) Example images of whole gonads stained with DAPI used to measure transition zone length. Transition zones are marked with a yellow line, pachytene is marked with a blue line. Scale bar = 10 μm. (F) Quantification of transition zone length as percent of meiosis at 25°C. (G) Images of chromosome volumes generated using HTP-3::wrmScarlet fluorescence signal and live fluorescence images of GFP::SYP-3 taken at 20°C. (H) Dot plot showing percent SC signal localized to chromosomes relative to total nucleoplasmic fluorescence in a single nucleus at 20°C. (I) Number of GFP::COSA-1 foci per nucleus in suppressed strains at 25°C. Note that only the two weak suppressors, syp-1K42E; syp-4A81T and syp-1K42E + V39I, have an elevated standard deviation (stdev = 2.38 and 3.11, respectively) compared with syp-1+ (stdev = 0). For panels (A – C), (H) and (I), asterisks (black) indicate statistical significance compared to gfp::cosa-1; syp-1K42E and horizontal black lines show mean values. Asterisks are representative of p-values as follows: * < 0.05, ** < 0.01, *** < 0.001, **** < 0.0001. See methods for detailed description of statistical analyses.
Figure 4:
Figure 4:. Suppressors alter conserved, charged residues in SYP-1, −3 and −4, but do not disrupt coiled-coils.
(A) Coiled-coil scores per position for SYP-1. The location of original and suppressor mutation is indicated by vertical red and gray lines, respectively. A higher score implies that the region is more likely to form a coiled-coil. (B) Impact of suppressor mutations on the heptad repeats that underly coiled-coils in SYP-1. Continuous heptad repeats are indicated by their positional nomenclature, a – g, and by a grey coil. Important positions in the heptad repeats are highlighted. Position a and d (blue) are typically hydrophobic, position e and g (yellow) are typically charged or polar. Note: in SYP-1, the original and suppressor mutations occur outside the coiled-coil domain. The heptad structure is shown for SYP-1+ and is aligned to SYP-1 mutants. Dots indicate the position has the same heptad structure in the mutants. (C – F), same as (A) and (B) except for SYP-3 and SYP-4. In (B), (D), and (F), the sequence shown is from the wild-type protein and suppressor and original mutations are colored in bold gray or red letters, respectively. (G) Partial alignment of SYP-1, −3 and −4 from 18 Caenorhabditis species. Suppressor mutations are indicated above the alignment. Amino acids are highlighted accordingly: negatively charged = red, positively charged = blue, serine or threonine (polar) = cyan, valine, isoleucine or alanine (hydrophobic) = lilac, glycine = yellow. Note that suppressor residues are either completely conserved (e.g., SYP-1S24 SYP-3D62 and SYP-4E90) or have been sampled by evolution (e.g., SYP-1T35C. panamensis, C. nouraguensis and C. becei all encode isoleucine (I) at position 35).
Figure 5.
Figure 5.. Suppressors alone do not affect the SC.
Total progeny and percent male progeny for suppressors alone at 15°C (A), 20°C (B) and 25°C (C). Note that (C) also contains a strain with two suppressor mutations combined (gfp::cosa-1; syp-3D62V, syp-4E90K). We used an ordinary one-way ANOVA with Dunnett’s test for multiple comparison to test for a difference of means for total progeny (A – C, top), and we use a Kruskal-Wallis test with Dunn’s test for multiple comparison to test for differences in percent males among genotypes (A – C, bottom). (D) Number of GFP::COSA-1 foci per nucleus. (E) Immunofluorescence images of mid-pachytene nuclei showing GFP::COSA-1 foci and extent of synapsis. (F) Bar graphs showing percentage of early pachytene nuclei with partially or completely asynapsed chromosomes. For panels (A – D), asterisks (blue) indicate statistical significance compared to gfp::cosa-1 and horizontal black lines indicate mean values. Asterisks are representative of p-values as follows: * < 0.05, ** < 0.01, *** < 0.001, **** < 0.0001. See methods for detailed description of statistical analyses.

Similar articles

References

    1. Nagaoka S. I., Hassold T. J., Hunt P. A., Human aneuploidy: mechanisms and new insights into an age-old problem. Nat. Rev. Genet. 13, 493–504 (2012). - PMC - PubMed
    1. Hassold T., Sherman S., Hunt P., Counting cross-overs: characterizing meiotic recombination in mammals. Hum. Mol. Genet. 9, 2409–2419 (2000). - PubMed
    1. van Veen J. E., Hawley R. S., Meiosis: when even two is a crowd. Curr. Biol. 13, R831–3 (2003). - PubMed
    1. Zickler D., Kleckner N., Recombination, Pairing, and Synapsis of Homologs during Meiosis. Cold Spring Harb. Perspect. Biol. 7 (2015). - PMC - PubMed
    1. Page S. L., Hawley R. S., The genetics and molecular biology of the synaptonemal complex. Annu. Rev. Cell Dev. Biol. 20, 525–558 (2004). - PubMed

Publication types