. 2023 Aug 14:17:1232670.
doi: 10.3389/fnins.2023.1232670. eCollection 2023.

Age-related decline in cognitive flexibility is associated with the levels of hippocampal neurogenesis

Affiliations

Age-related decline in cognitive flexibility is associated with the levels of hippocampal neurogenesis

Evgeny M Amelchenko et al. Front Neurosci. .

Abstract

Aging is associated with impairments in learning, memory, and cognitive flexibility, as well as a gradual decline in hippocampal neurogenesis. We investigated the performance of 6-and 14-month-old mice (considered mature adult and late middle age, respectively) in learning and memory tasks based on the Morris water maze (MWM) and determined their levels of preceding and current neurogenesis. While both age groups successfully performed in the spatial version of MWM (sMWM), the older mice were less efficient compared to the younger mice when presented with modified versions of the MWM that required a reassessment of the previously acquired experience. This was detected in the reversal version of MWM (rMWM) and was particularly evident in the context discrimination MWM (cdMWM), a novel task that required integrating various distal cues, local cues, and altered contexts and adjusting previously used search strategies. Older mice were impaired in several metrics that characterize rMWM and cdMWM, however, they showed improvement and narrowed the performance gap with the younger mice after additional training. Furthermore, we analyzed the adult-born mature and immature neurons in the hippocampal dentate gyrus and found a significant correlation between neurogenesis levels in individual mice and their performance in the tasks demanding cognitive flexibility. These results provide a detailed description of the age-related changes in learning and memory and underscore the importance of hippocampal neurogenesis in supporting cognitive flexibility.

Keywords: adult-born neurons; aging; cognitive flexibility; hippocampal neurogenesis; neuronal maturation; search strategies; spatial learning.


Conflict of interest statement

The authors declare that the research was conducted in the absence of any commercial or financial relationships that could be construed as a potential conflict of interest.

Figures

Figure 1
Figure 1
Experimental timeline. Mice were trained in succession of three tasks: spatial MWM (sMWM) learning – days 1–5, sMWM memory test – day 6; reversal MWM (rMWM) learning – days 6–8, rMWM memory test – day 9; context discrimination (cdMWM) learning in daily alternating blue (B) and white (W) pools with a pair of local cues, that context-dependently signaled platform location – days 9–14, cdMWM memory tests in the blue and white pools – day 15. Blue ring represents the blue swimming pool, white ring represents the white swimming pool, small grey circle represents platform location, note different platform location in different tasks; yellow star and green triangle represents local cues introduced for training in the cdMWM task.
Figure 2
Figure 2
Average swim speed measured in course of training; no significant difference between the groups was found (Mann–Whitney t-test), data presented as Mean ± SEM.
Figure 3
Figure 3
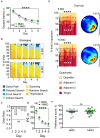
Behavior in spatial MWM (sMWM) of 6-month-old (6MO, n = 13) and 14-month-old (14MO, n = 15) mice. (A) Escape latencies (time to reach a hidden platform) during training; ****p < 0.0001 for each of two groups, ns – p > 0.05 (two-way ANOVA, multiple comparisons with Sidak’s correction), data presented as Mean ± SEM; (B) Search strategies in sMWM; each block of stacked bars indicates strategies used for the 5 trials for each day; (C) Odds ratio of spatially precise strategies use in 14MO compared with the 6MO in sMWM; ns – p > 0.05 (p values determined by fitting a generalized linear mixed effect model with binomial distribution); (D) Ideal path error (IPE) in sMWM; ****p < 0.0001 for each of two groups, ns – p > 0.05 for effect of age (two-way ANOVA, multiple comparisons with Sidak’s correction), data presented as Mean ± SEM; (E) Time spent in quadrants (in %) during test following sMWM training; each column represents an animal and each color represents the percent of time spent in each quadrant. Mean value for the fraction of time spent in each quadrant is represented by a black dash line and the error bar on the mean is approximated with the inverse Fisher information, ****p < 0.0001, in black symbols the results of Dirichlet distribution analysis are shown, in white symbols the results of post-hoc single sample t-test comparison (with Bonferroni correction) with the theoretical value 25% are shown; heatmaps represent average distribution of the track points (mouse locations) in the pool during test trial; (F) Preference score, relative time spent in T quadrant in test, dots represent individual values, ns – p > 0.05, data presented as Mean ± SEM.
Figure 4
Figure 4
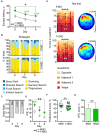
Behavior in reversal MWM (rMWM) of 6-month-old (6MO, n = 13) and 14-month-old (14MO, n = 15) mice. (A) Escape latencies (time to reach a hidden platform) during training; black asterisks: *p < 0.05 for day 6 vs day 8 for each of two groups, **p < 0.01 effect of age; green symbols: 14MO vs 6MO, *p < 0.05 (two-way ANOVA, multiple comparisons with Sidak’s correction), data presented as Mean ± SEM; (B) Search strategies in rMWM; each block of stacked bars indicates strategies used for the 5 trials for each training day; (C) Odds ratio of spatially precise strategies use in 14MO compared with the 6MO in rMWM; **p < 0.01 (p values determined by fitting a generalized linear mixed effect model with binomial distribution); (D) Ideal path error (IPE) in rMWM; black asterisks: both groups or between-group comparison **p < 0.01 for day 6 vs day 8 for each of two groups, **p < 0.01 effect of age; green asterisks: 14MO vs 6MO, *p < 0.05, **p < 0.01 (two-way ANOVA, multiple comparisons with Sidak’s correction), data presented as Mean ± SEM; (E) Time spent in quadrants (in %) during test following sMWM training; each column represents an animal and each color represents the percent of time spent in each quadrant. Mean value for the fraction of time spent in each quadrant is represented by a black dash line and the error bar on the mean is approximated with the inverse Fisher information, **p < 0.01, ****p < 0.0001, in black symbols the results of Dirichlet distribution analysis are shown, in white symbols the results of post-hoc single sample t-test comparison (with Bonferroni correction) with the theoretical value 25% are shown; heatmaps represent average distribution of the track points (mouse locations) in the pool during test trial; (F) Preference score, relative time spent in T quadrant in test, dots represent individual values, ns – p > 0.05, data presented as Mean ± SEM; (G) Correct first choice (CFC) score (latency to reach the false cue – latency to reach goal cue); ns – p > 0.05, data presented as Mean ± SEM.
Figure 5
Figure 5
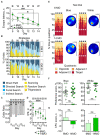
Behavior in context discrimination MWM (cdMWM) of 6-month-old (6MO, n = 13) and 14-month-old (14MO, n = 15) mice. (A) Escape latencies (time to reach a hidden platform) during training; black asterisks: both groups or effect of age, *p < 0.05, ###p < 0.001 day 9 vs day 13 for the 14MO group; green asterisk: comparison of 14MO vs 6MO on specific day, *p < 0.05 (two-way ANOVA, multiple comparisons with Sidak’s correction), data presented as Mean ± SEM; (B) Search strategies in cdMWM; each block of stacked bars indicates strategies used for the 5 trials for each training day; (C) Odds ratio of spatially precise strategies use by the 14MO group compared to the 6MO groups in cdMWM; *p < 0.05, **p < 0.01 (p values determined by fitting a generalized linear mixed effect model with binomial distribution); (D) Ideal path error (IPE) in cdMWM; black symbols: *p < 0.05 for effect of age, ##p < 0.01, ###p < 0.001 day 9 vs day 13 or day 10 vs day 14 for the 14MO group; green asterisk: 14MO vs 6MO, *p < 0.05 (two-way ANOVA, multiple comparisons with Sidak’s correction), data presented as Mean ± SEM; (E) Time spent in quadrants (in %) during test following sMWM training; each column represents an animal and each color represents the percent of time spent in each quadrant. Mean value for the fraction of time spent in each quadrant is represented by a black dash line and the error bar on the mean is approximated with the inverse Fisher information, ****p < 0.0001, ns – p > 0.05, in black symbols the results of Dirichlet distribution analysis are shown, in white symbols the results of post-hoc single sample t-test comparison (with Bonferroni correction) with the theoretical value 25% are shown; heatmaps represent average distribution of the track points (mouse locations) in the pool during test trial; (F) Preference score, relative time spent in T quadrant in test; dots represent individual values, ns – p > 0.05, data presented as Mean ± SEM; (G) Correct first choice (CFC) score (latency to reach the false cue – latency to reach goal cue); ns – p > 0.05, data presented as Mean ± SEM.
Figure 6
Figure 6
Neurogenesis in 6-and 14-month-old mice: (A) Images of sections from 6MO (left column) and 14MO (right column) mice stained for EdU, NeuN (top row), and DCX (bottom row); arrows on two top images indicate EdU+ cells; white dash line in lower right image outlines the borders of the granule cell layer of the DG; scale bar – 100 μm; (B) Example confocal images and cross sections representing EdU labeling co-localized with NeuN expression in the same cell of the granule cell layer of the DG of a 14MO mouse; scale bar – 10 μm; (C) number of EdU+-cells per DG; ****p < 0.0001; (D) Number of EdU+NeuN+DCX-cells (mature adult-born neurons) per DG, **p < 0.01; (E) Number of DCX+ cells (immature adult-born neurons) per DG. ****p < 0.0001; (C–E) Data presented as Mean ± SEM, all comparisons – Mann–Whitney t-tests.
Figure 7
Figure 7
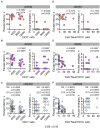
Correlation analysis (Spearman’s r) for mice individual performance parameters on the first days of training in: (A,D) – sMWM; (B,E) –rMWM, (C,F) – in cdMWM with the numbers of adult-born immature (DCX+) and mature (EdU+NeuN+DCX) neurons.

Similar articles

Cited by

References

    1. Aimone J. B., Li Y., Lee S. W., Clemenson G. D., Deng W., Gage F. H. (2014). Regulation and function of adult neurogenesis: from genes to cognition. Physiol. Rev. 94, 991–1026. doi: 10.1152/physrev.00004.2014, PMID: - DOI - PMC - PubMed
    1. Akers K. G., Martinez-Canabal A., Restivo L., Yiu A. P., De Cristofaro A., Hsiang H. L., et al. . (2014). Hippocampal neurogenesis regulates forgetting during adulthood and infancy. Science 344, 598–602. doi: 10.1126/science.1248903 - DOI - PubMed
    1. Amelchenko E., Bezrriadnov D. V., Chekhov O. A., Ivanova A., Kedrov A. V., Anokhin K. V., et al. . (2023). Cognitive flexibility is selectively impaired by radiation and is associated with differential recruitment of adult-born neurons. J. Neurosci. Press. doi: 10.1523/JNEUROSCI.0161-22.2023 - DOI - PMC - PubMed
    1. Anacker C., Hen R. (2017). Adult hippocampal neurogenesis and cognitive flexibility – linking memory and mood. Nat. Rev. Neurosci. 18, 335–346. doi: 10.1038/nrn.2017.45, PMID: - DOI - PMC - PubMed
    1. Arruda-Carvalho M., Sakaguchi M., Akers K. G., Josselyn S. A., Frankland P. W. (2011). Posttraining ablation of adult-generated neurons degrades previously acquired memories. J. Neurosci. 31, 15113–15127. doi: 10.1523/JNEUROSCI.3432-11.2011, PMID: - DOI - PMC - PubMed