. 2023 Aug 29;21(8):e3002281.
doi: 10.1371/journal.pbio.3002281. eCollection 2023 Aug.

In vivo recording of suprachiasmatic nucleus dynamics reveals a dominant role of arginine vasopressin neurons in circadian pacesetting

Affiliations

In vivo recording of suprachiasmatic nucleus dynamics reveals a dominant role of arginine vasopressin neurons in circadian pacesetting

Yusuke Tsuno et al. PLoS Biol. .

Abstract

The central circadian clock of the suprachiasmatic nucleus (SCN) is a network consisting of various types of neurons and glial cells. Individual cells have the autonomous molecular machinery of a cellular clock, but their intrinsic periods vary considerably. Here, we show that arginine vasopressin (AVP) neurons set the ensemble period of the SCN network in vivo to control the circadian behavior rhythm. Artificial lengthening of cellular periods by deleting casein kinase 1 delta (CK1δ) in the whole SCN lengthened the free-running period of behavior rhythm to an extent similar to CK1δ deletion specific to AVP neurons. However, in SCN slices, PER2::LUC reporter rhythms of these mice only partially and transiently recapitulated the period lengthening, showing a dissociation between the SCN shell and core with a period instability in the shell. In contrast, in vivo calcium rhythms of both AVP and vasoactive intestinal peptide (VIP) neurons in the SCN of freely moving mice demonstrated stably lengthened periods similar to the behavioral rhythm upon AVP neuron-specific CK1δ deletion, without changing the phase relationships between each other. Furthermore, optogenetic activation of AVP neurons acutely induced calcium increase in VIP neurons in vivo. These results indicate that AVP neurons regulate other SCN neurons, such as VIP neurons, in vivo and thus act as a primary determinant of the SCN ensemble period.


Conflict of interest statement

The authors have declared that no competing interests exist.

Figures

Fig 1
Fig 1. CaMKIIα-CK1δ−/− mice show lengthening of the free-running period in DD.
(A) Representative locomotor activity of control and CaMKIIα-CK1δ−/− mice (home-cage activity). Animals were initially housed in 12:12-h LD conditions and then transferred to DD. Gray shading indicates the time when lights were off. (B) Averaged daily profile of locomotor activity in LD (left) or DD (right). (C) The free-running period in DD. (D) The circadian amplitude of locomotor activity rhythms (Qp values obtained from periodogram analyses). Values are mean ± SEM; n = 10 for control, n = 13 for CaMKIIα-CK1δ−/− mice. The underlying data can be found in S1 Data. ***P < 0.001 by two-tailed Student t tests; ns, not significant. See also S1 and S2 Figs.
Fig 2
Fig 2. Vip-CK1δ−/− mice show no change in the free-running period in DD.
(A) Representative locomotor activity of control and Vip-CK1δ−/− mice (home-cage activity). Gray shading indicates the time when lights were off. (B) Averaged daily profile of locomotor activity in LD (left) or DD (right). (C) The free-running period in DD. (D) The circadian amplitude of locomotor activity rhythms (Qp values). Values are mean ± SEM; n = 9 for control, n = 9 for Vip-CK1δ−/− mice. ns, not significant. The underlying data can be found in S1 Data. See also S2 Fig.
Fig 3
Fig 3. Periods of PER2::LUC oscillations in the SCN shell rapidly changes in the SCN slices of Avp-CK1δ−/− and CaMKIIα-CK1δ−/− mice.
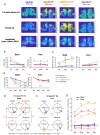
(A) Representative first peak phase (relative phase to the slice mean), period (the interval between the first and second peaks), and amplitude maps of PER2::LUC oscillation at the pixel level in coronal SCN slices prepared from control, Avp-CK1δ−/−, CaMKIIα-CK1δ−/−, and Vip-CK1δ−/− mice. Peak phases, periods, and amplitudes of PER2::LUC oscillations in the individual pixels covering the SCN were calculated for every cycle. White squares on the amplitude maps indicate regions (15 × 15 pixels) considered as the shell or core for further analyses. (B) The day-by-day change in the mean period of individual pixels’ PER2::LUC oscillations in the shell (left) and core (right) regions. The analyzed regions’ examples are shown in Fig 3A. Definitions of peaks, periods, and cycles are indicated in S3 Fig. The averaged values of 2 regions in the left and right SCN of individual slices were considered the representatives of individual mice. Blue, Control; Red, Avp-CK1δ−/−; Orange, CaMKIIα-CK1δ−/−; Purple, Vip-CK1δ−/−. (C) The day-by-day change in the standard deviation (SD) of individual pixels’ periods in the shell (left) and core (right) regions. (D) The day-by-day change in the mean peak amplitude (relative to the first peak amplitude) of individual pixels’ PER2::LUC oscillations in the shell (left) and core (right) regions. (E, F) The mean first peak phase (ZT) of the shell (E) and core (F) regions in different mouse lines were shown as Rayleigh plots. Individual dots indicate the mean peak phases of each mouse. (G) Peak phase differences between the SCN core of control mice and the shell or core of other mouse lines. Circle, shell; triangles, core. Values are mean ± SEM; n = 9 for Control, n = 7 for Avp-CK1δ−/−, n = 7 for CaMKIIα-CK1δ−/−, n = 6 for Vip-CK1δ−/−. The underlying data can be found in S1 Data. Letters indicate significant differences in the factor of genotype (g: compared with Control), day (d), or region (r). g: effect of genotype, P < 0.05 by Kruskal–Wallis rank sum test followed by Mann–Whitney U test with Bonferroni correction (B, C) or three-way repeated measures ANOVA with post hoc Ryan test (D); d: effect of day, P < 0.05 by Friedman rank sum test followed by Wilcoxon signed rank test with Bonferroni correction (B, C) or three-way repeated measures ANOVA with post hoc Ryan test (D); r: effect of region, P < 0.05 by Wilcoxon signed rank test (B, C) or three-way repeated measures ANOVA with post hoc Ryan test (D); g × d, interaction between genotype and day (D, Core); r × d, interaction between region and day (D, in all genotypes). *P < 0.05; **P < 0.01; ***P < 0.001 by Harrison–Kanji test followed by Watson–Williams test with Bonferroni correction (E, F) or Kruskal–Wallis rank sum test followed by Mann–Whitney U test with Bonferroni correction (G, effect of Genotype-Region compared with Control-Core). P values of Rayleigh test were < 0.01 for all circular data. See also S3 Fig.
Fig 4
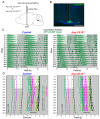
Fig 4. The in vivo circadian period of AVP-neuronal [Ca2+]i rhythm is lengthened in the SCN of Avp-CK1δ−/− mice.
(A) Schematic diagram of viral vector (AAV-CAG-DIO-jGCaMP7s) injection and optical fiber implantation at SCN in control (Avp-Cre; CK1δwt/flox) or Avp-CK1δ−/− (Avp-Cre; CK1δflox/flox) mice for fiber photometry recording. (B) A representative coronal section of mice with jGCaMP7s expression in SCN AVP neurons. A white dotted square shows the estimated position of implanted optical fiber. Green, jGCaMP7s; blue, DAPI. Scale bar, 1 mm. (C) Representative plots of the in vivo jGCaMP7s signal of SCN AVP neurons (green) overlaid with locomotor activity (home-cage activity) (black) in actograms. Control (Left) and Avp-CK1δ−/− (Right) mice were initially housed in LD (LD1 to LD5) and then in DD (DD1 to DD12). The dark periods are represented as gray shaded areas. (D) Plots of locomotor activity onset (black), activity offset (gray), GCaMP onset (green), GCaMP offset (light green), and GCaMP peak (magenta) of mean ± SEM (left column) and individual mice data (right column) in control and Avp-CK1δ−/− mice. Identical marker shapes indicate data from the same animal. n = 5 for control (n = 3 without Vip-tTA; n = 2 with Vip-tTA), n = 6 for Avp-CK1δ−/− (n = 4 without Vip-tTA; n = 2 with Vip-tTA). The underlying data can be found in S1 Data. See also S4 Fig.
Fig 5
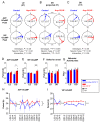
Fig 5. Periods of AVP-neuronal, VIP-neuronal, and behavior rhythms are similarly lengthened in Avp-CK1δ−/− mice in vivo.
(A-C) Peak phases of AVP and VIP GCaMP fluorescence rhythms in LD (LD1-5, A) or DD in projected ZT (DD8-10, B) or CT (C) were shown as Rayleigh plots. Individual dots indicate the peak phases of each mouse. (D) Periods of AVP-neuronal GCaMP fluorescence rhythm in LD (LD1-5, left) or DD (DD8-10, right). (E) Periods of VIP-neuronal GCaMP fluorescence rhythm in LD or DD. (F) Periods of locomotor activity onset in LD or DD. Black circle, data from AVP-GCaMP experiment; white circle, data from VIP-GCaMP experiment. Data from AVP-GCaMP and VIP-GCaMP experiments were combined for statistical analysis. (G) Activity time of locomotor activity rhythm in LD (LD1-5, left) or in DD (DD8-10, right). Blue, Control (Avp-CK1δ+/−, i.e., Avp-Cre; CK1δwt/flox); red, Avp-CK1δ−/−. Values are mean ± SEM. n = 5 for AVP-GCaMP: Control, n = 6 for AVP-GCaMP: Avp-CK1δ−/−, n = 6 for VIP-GCaMP: Control, n = 4 for VIP-GCaMP: Avp-CK1δ−/−. *P < 0.05; **P < 0.01; ***P < 0.001 by Harrison–Kanji test followed by Watson–Williams test (A to C), or by two-tailed Welch t test (D to G). P values of Rayleigh test were < 0.01 for all circular data. (H, I) Day-by-day changes in the period of AVP- (H) or VIP-neuronal (I) GCaMP fluorescence rhythms in LD (3 days) and in DD (9 days). Values are mean ± SEM. n = 3 for AVP-GCaMP: Control, n = 5 for AVP-GCaMP: Avp-CK1δ−/−, n = 5 for VIP-GCaMP: Control, n = 3 for VIP-GCaMP: Avp-CK1δ−/−. *P < 0.05; ***P < 0.001 by two-way repeated measures ANOVA. n.s., not significant. The underlying data can be found in S1 Data.
Fig 6
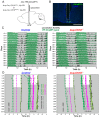
Fig 6. The in vivo circadian period of VIP-neuronal [Ca2+]i rhythm is lengthened in the SCN of Avp-CK1δ−/− mice.
(A) Schematic diagram of viral vector (AAV-TRE-jGCaMP7s) injection and optical fiber implantation at SCN in control (Avp-Cre; CK1δwt/flox; Vip-tTA) or Avp-CK1δ−/− (Avp-Cre; CK1δflox/flox; Vip-tTA) mice for fiber photometry recording. (B) A representative coronal section of mice with jGCaMP7s expression in SCN VIP neurons. A white dotted square shows the estimated position of implanted optical fiber. Green, jGCaMP7s; blue, DAPI. Scale bar, 1 mm. (C) Representative plots of the in vivo jGCaMP7s signal of SCN VIP neurons (green) overlaid with locomotor activity (home-cage activity) (black) in actograms. Control (Left) and Avp-CK1δ−/− (Right) mice were initially housed in LD (LD1 to LD5) and then in DD (DD1 to DD10). The dark periods are represented as gray shaded areas. (D) Plots of locomotor activity onset (black), activity offset (gray), GCaMP onset (green), GCaMP offset (light green), and GCaMP peak (magenta) of mean ± SEM (left column) and individual mice data (right column) in control and Avp-CK1δ−/− mice. Identical marker shapes indicate data from the same animal. n = 6 for control, n = 4 for Avp-CK1δ−/−. The underlying data can be found in S1 Data. See also S4 Fig.
Fig 7
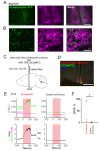
Fig 7. AVP neurons functionally connect to VIP neurons in the SCN.
(A, B) The fusion protein Synaptophysin::GFP is expressed in the axon terminals of AVP neurons by injecting AAV-EF1α-DIO-synaptophysin::GFP into the SCN of an Avp-Cre mouse. From the left, a representative coronal section of the SCN showing the native Synaptophysin::GFP fluorescence (green), VIP immunostaining (magenta), or the merged signals (white). The white rectangle in (A) indicates the position of the magnified images of (B). Some Synaptophysin::GFP-labeled AVP neuron axon terminals are present around VIP neurons in the SCN. Scale bars, 200 (A) or 20 μm (B). (C) Schematic diagram of viral vector (AAV-CAG-Flex-ChrimsonR-mCherry and AAV-TRE-jGCaMP7s) injection and optical fiber implantation at the SCN in Avp-Cre; Vip-tTA mice for fiber photometry recording of SCN VIP-neuronal [Ca2+]i and optogenetic stimulation of SCN AVP neurons. (D) A representative coronal section of mice with ChrimsonR-mCherry expression in SCN AVP neurons and jGCaMP7s expression in SCN VIP neurons. A white dotted square indicates the estimated position of the implanted optical fiber. Red, mCheery; green, jGCaMP7s; blue, DAPI. Scale bar, 1 mm. (E) Top: Representative traces of the jGCaMP7s signal of SCN VIP neurons upon optogenetic stimulation of AVP neurons at ZT22 in vivo (left, ChrimsonR; right, mCherry Control). Green traces indicate the fluorescence (F) value at the 470-nm light excitation (F470), Ca2+-dependent signal. Magenta traces indicate the fluorescence value at the 415-nm light excitation (F415), Ca2+-independent control signal. Red shading indicates the timing of optical stimulation (635 nm, 50 ms pulse, 5 Hz, 120 s). Bottom: Ratio (R) calculated by F470/F415 from the upper traces. The baseline ratio (R0) is the mean R-value of the prestimulation period (−30 s–0 s). ΔR is the difference between the mean R-value of the late phase during the stimulation period (90 s–120 s) and R0. a.u., arbitrary unit. Optogenetic stimulation of SCN AVP neurons increases VIP-neuronal [Ca2+]i in freely moving mice. (F) Comparison of the ΔR/R0% during the late stimulation period. n = 4. *P < 0.05 by Mann–Whitney U test.

Similar articles

Cited by

References

    1. Hastings MH, Maywood ES, Brancaccio M. Generation of circadian rhythms in the suprachiasmatic nucleus. Nat Rev Neurosci. 2018;19:453–469. doi: 10.1038/s41583-018-0026-z - DOI - PubMed
    1. Takahashi JS. Transcriptional architecture of the mammalian circadian clock. Nat Rev Genet. 2017;18:164–179. doi: 10.1038/nrg.2016.150 - DOI - PMC - PubMed
    1. Gallego M, Virshup DM. Post-translational modifications regulate the ticking of the circadian clock. Nat Rev Mol Cell Biol. 2007;8:139–148. doi: 10.1038/nrm2106 - DOI - PubMed
    1. Etchegaray JP, Yu EA, Indic P, Dallmann R, Weaver DR. Casein kinase 1 delta (CK1) regulates period length of the mouse suprachiasmatic circadian clock in vitro. PLoS ONE. 2010;5:e10303. doi: 10.1371/journal.pone.0010303 - DOI - PMC - PubMed
    1. Fustin J-M, Kojima R, Itoh K, Chang H-Y, Shiqi Y, Zhuang B, et al.. Two Ck1δ transcripts regulated by m6A methylation code for two antagonistic kinases in the control of the circadian clock. Proc Natl Acad Sci U S A. 2018;115:5980–5985. doi: 10.1073/pnas.1721371115 - DOI - PMC - PubMed

Publication types

Grants and funding

This work was supported in part by JSPS KAKENHI Grant Numbers JP20K07259, JP23K06345 (to Y.T.); JP22K20738 (to A.M.); JP18H04972, JP18K19421, JP20K21498, JP22H02802 (to M.M.) (Japan Society for the Promotion of Science: https://www.jsps.go.jp/english/index.html); JST SPRING Grant Number JPMJSP2135 (to Y.P., M.W.) (Japan Science and Technology Agency: https://www.jst.go.jp/EN/); the Takeda Science Foundation (to M.M.) (https://www.takeda-sci.or.jp/en/); the Naito Foundation (to M.M.) (https://www.naito-f.or.jp/en/); the Japan Foundation for Applied Enzymology (to M.M.) (https://www.jfae.or.jp/); and Kanazawa University CHOZEN project (to M.M.) (http://www.o-fsi.kanazawa-u.ac.jp/research/chozen/). The funders had no role in study design, data collection and analysis, decision to publish, or preparation of the manuscript.