Accelerated evolution of SARS-CoV-2 in free-ranging white-tailed deer
- PMID: 37640694
- PMCID: PMC10462754
- DOI: 10.1038/s41467-023-40706-y
Accelerated evolution of SARS-CoV-2 in free-ranging white-tailed deer
Abstract
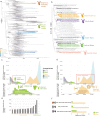
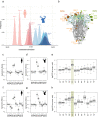
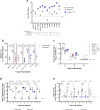
The zoonotic origin of the COVID-19 pandemic virus highlights the need to fill the vast gaps in our knowledge of SARS-CoV-2 ecology and evolution in non-human hosts. Here, we detected that SARS-CoV-2 was introduced from humans into white-tailed deer more than 30 times in Ohio, USA during November 2021-March 2022. Subsequently, deer-to-deer transmission persisted for 2-8 months, disseminating across hundreds of kilometers. Newly developed Bayesian phylogenetic methods quantified how SARS-CoV-2 evolution is not only three-times faster in white-tailed deer compared to the rate observed in humans but also driven by different mutational biases and selection pressures. The long-term effect of this accelerated evolutionary rate remains to be seen as no critical phenotypic changes were observed in our animal models using white-tailed deer origin viruses. Still, SARS-CoV-2 has transmitted in white-tailed deer populations for a relatively short duration, and the risk of future changes may have serious consequences for humans and livestock.
© 2023. Springer Nature Limited.
Conflict of interest statement
The authors declare no competing interests.
Figures


Update of
-
Accelerated evolution of SARS-CoV-2 in free-ranging white-tailed deer.Res Sq [Preprint]. 2023 Feb 16:rs.3.rs-2574993. doi: 10.21203/rs.3.rs-2574993/v1. Res Sq. 2023. Update in: Nat Commun. 2023 Aug 28;14(1):5105. doi: 10.1038/s41467-023-40706-y. PMID: 36824718 Free PMC article. Updated. Preprint.
Similar articles
-
Accelerated evolution of SARS-CoV-2 in free-ranging white-tailed deer.Res Sq [Preprint]. 2023 Feb 16:rs.3.rs-2574993. doi: 10.21203/rs.3.rs-2574993/v1. Res Sq. 2023. Update in: Nat Commun. 2023 Aug 28;14(1):5105. doi: 10.1038/s41467-023-40706-y. PMID: 36824718 Free PMC article. Updated. Preprint.
-
SARS-CoV-2 infection in free-ranging white-tailed deer.Nature. 2022 Feb;602(7897):481-486. doi: 10.1038/s41586-021-04353-x. Epub 2021 Dec 23. Nature. 2022. PMID: 34942632 Free PMC article.
-
Transmission of SARS-CoV-2 in free-ranging white-tailed deer in the United States.Nat Commun. 2023 Jul 10;14(1):4078. doi: 10.1038/s41467-023-39782-x. Nat Commun. 2023. PMID: 37429851 Free PMC article.
-
Transmission of severe acute respiratory syndrome coronavirus 2 from humans to animals: is there a risk of novel reservoirs?Curr Opin Virol. 2023 Dec;63:101365. doi: 10.1016/j.coviro.2023.101365. Epub 2023 Oct 2. Curr Opin Virol. 2023. PMID: 37793299 Review.
-
Infection Dynamics, Pathogenesis, and Immunity to SARS-CoV-2 in Naturally Susceptible Animal Species.J Immunol. 2023 Oct 15;211(8):1195-1201. doi: 10.4049/jimmunol.2300378. J Immunol. 2023. PMID: 37782853 Free PMC article. Review.
Cited by
-
Higher Frequency of SARS-CoV-2 RNA Shedding by Cats than Dogs in Households with Owners Recently Diagnosed with COVID-19.Viruses. 2024 Oct 11;16(10):1599. doi: 10.3390/v16101599. Viruses. 2024. PMID: 39459932 Free PMC article.
-
Cross-Species Susceptibility of Emerging Variants of SARS-CoV-2 Spike.Genes (Basel). 2024 Oct 14;15(10):1321. doi: 10.3390/genes15101321. Genes (Basel). 2024. PMID: 39457447 Free PMC article.
-
Study on sentinel hosts for surveillance of future COVID-19-like outbreaks.Sci Rep. 2024 Oct 19;14(1):24595. doi: 10.1038/s41598-024-76506-7. Sci Rep. 2024. PMID: 39427096 Free PMC article.
-
One Health collaboration is more effective than single-sector actions at mitigating SARS-CoV-2 in deer.Nat Commun. 2024 Oct 7;15(1):8677. doi: 10.1038/s41467-024-52737-0. Nat Commun. 2024. PMID: 39375325 Free PMC article.
-
Subsequent Waves of Convergent Evolution in SARS-CoV-2 Genes and Proteins.Vaccines (Basel). 2024 Aug 5;12(8):887. doi: 10.3390/vaccines12080887. Vaccines (Basel). 2024. PMID: 39204013 Free PMC article. Review.
References
-
- WHO Coronavirus (COVID-19) Dashboard. https://covid19.who.int.
-
- World Organisation for Animal Health. SARS-CoV-2 in Animals - Situation Report 20. https://www.woah.org/app/uploads/2023/01/sars-cov-2-situation-report-20.pdf (2022).
Publication types
MeSH terms
Supplementary concepts
Grants and funding
LinkOut - more resources
Full Text Sources
Medical
Miscellaneous

