. 2023 Aug 11:11:1231489.
doi: 10.3389/fcell.2023.1231489. eCollection 2023.

Nox1-based NADPH oxidase regulates the Par protein complex activity to control cell polarization

Affiliations

Nox1-based NADPH oxidase regulates the Par protein complex activity to control cell polarization

Alejandra Valdivia et al. Front Cell Dev Biol. .

Abstract

Cell migration is essential for many biological and pathological processes. Establishing cell polarity with a trailing edge and forming a single lamellipodium at the leading edge of the cell is crucial for efficient directional cell migration and is a hallmark of mesenchymal cell motility. Lamellipodia formation is regulated by spatial-temporal activation of the small GTPases Rac and Cdc42 at the front edge, and RhoA at the rear end. At a molecular level, partitioning-defective (Par) protein complex comprising Par3, Par6, and atypical Protein Kinase (aPKC isoforms ζ and λ/ι) regulates front-rear axis polarization. At the front edge, integrin clustering activates Cdc42, prompting the formation of Par3/Par6/aPKC complexes to modulate MTOC positioning and microtubule stabilization. Consequently, the Par3/Par6/aPKC complex recruits Rac1-GEF Tiam to activate Rac1, leading to lamellipodium formation. At the rear end, RhoA-ROCK phosphorylates Par3 disrupting its interaction with Tiam and inactivating Rac1. RhoA activity at the rear end allows the formation of focal adhesions and stress fibers necessary to generate the traction forces that allow cell movement. Nox1-based NADPH oxidase is necessary for PDGF-induced migration in vitro and in vivo for many cell types, including fibroblasts and smooth muscle cells. Here, we report that Nox1-deficient cells failed to acquire a normal front-to-rear polarity, polarize MTOC, and form a single lamellipodium. Instead, these cells form multiple protrusions that accumulate Par3 and active Tiam. The exogenous addition of H2O2 rescues this phenotype and is associated with the hyperactivation of Par3, Tiam, and Rac1. Mechanistically, Nox1 deficiency induces the inactivation of PP2A phosphatase, leading to increased activation of aPKC. These results were validated in Nox1y/- primary mouse aortic smooth muscle cells (MASMCs), which also showed PP2A inactivation after PDGF-BB stimulation consistent with exacerbated activation of aPKC. Moreover, we evaluated the physiological relevance of this signaling pathway using a femoral artery wire injury model to generate neointimal hyperplasia. Nox1y/- mice showed increased staining for the inactive form of PP2A and increased signal for active aPKC, suggesting that PP2A and aPKC activities might contribute to reducing neointima formation observed in the arteries of Nox1y/- mice.

Keywords: Nox1; PP2A; Par3; Polarity; migration.


Conflict of interest statement

The authors declare that the research was conducted in the absence of any commercial or financial relationships that could be construed as a potential conflict of interest.

Figures

FIGURE 1
FIGURE 1
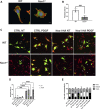
Nox1 is required for MTOC polarization. WT and Nox1y/- mouse embryonic fibroblast (MEFs) cells were seeded in 2 well silicone inserts (Ibidi) on Collagen-I-coated coverslips and allowed to grow to confluency overnight. Cells were serum starved for 2 h, and after removing the insert, they were allowed to migrate to the space in the presence of 10 ng/mL PDGF-BB. After 30 min, cells were fixed and stained for (A) γ-Tubulin (MTOC, green), (B) GM130 (Golgi, green), and nucleus (DAPI, Blue). Graphs show the quantification of cells that polarize the MTOC (A) or Golgi (B) in front of the nucleus facing the wound area. Differences between genotypes were analyzed with unpaired t-test (****p < 0.0001, n = 3 for MTOC, and n = 5 for Golgi. 50–80 cells were counted in each experiment). Scale bar = 50 μm.
FIGURE 2
FIGURE 2
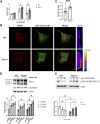
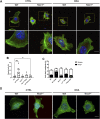
Nox1 is required for PDGF-induced polarized lamellipodia formation. WT and Nox1y/- mouse embryonic fibroblasts (MEFs) were seeded on collagen-I-coated coverslips, serum starved for 16 h, and stimulated with 10 ng/mL PDGF-BB for 30 min. Cells were fixed and stained for cortactin (green), F-actin (phalloidin, red), and nucleus (DAPI, blue). (A) Representative images of morphology observed for WT and Nox1y/- cells. Scale bar = 10 μm. (B) Quantification of cells that showed a polarized shape. Statistical significance was analyzed with an unpaired t-test (***p < 0.001, n = 4 and ∼150 cells analyzed per experiment). We considered the cells polarized when they showed a rear-to-front shape, including a tail and a single lamellipodium at the leading edge (as in A, WT panel). (C) Cells were infected with a control virus (CTRL) or a virus expressing Nox1-HA. After 24 h of infection, cells were plated and treated as described above. Staining was performed for F-actin (phalloidin, red), and infected cells showed green fluorescence. Arrowheads show cells with polar shapes (single lamellipodium), and stars show cells with multiple lamellipodia. Scale bar = 10 μm (D) Quantification of cells that showed a polarized shape. A two-way ANOVA test with multiple comparison was used to determine statistical significance from three independent experiments (n = 3) where ∼585 cells were analyzed in each experiment (***p < 0.001, ****p < 0.0001, ns: no significant). (E) Quantification of cells with single lamellipodium (black bars), multiple lamellipodia (white bars), or no lamellipodia (grey bars). Data were analyzed with a one-way ANOVA within each phenotype. Each group was compared with the control sample in basal (WT) (n = 4, ∼585 cells per experiment; **p <0.01).
FIGURE 3
FIGURE 3
Nox1 effect on polarity and lamellipodia number is rescued with H2O2. MEF cells were seeded on collagen-I-coated coverslips, serum starved for 16 h, and stimulated with 10 ng/mL PDGF-BB in the presence or absence of 10 μm H2O2. Cells were fixed and stained for cortactin (green), F-actin (phalloidin, red), and nucleus (DAPI, blue). (A) Representative images of morphology observed for WT and Nox1y/- cells. Arrows show cells with polar shapes (single lamellipodium), and stars show cells with multiple lamellipodia. Scale bar = 10 μm (B) Quantification of cells that showed a polarized shape, including a single lamellipodium. A two-way ANOVA test with multiple comparison was used to determine statistical significance from three independent experiments (n = 3) where ∼320 cells were analyzed in each experiment (*p < 0.05, **p < 0.02, ***p < 0.0002, ****p < 0.0001). (C) Quantification of cells with single lamellipodium (black bars), multiple lamellipodia (white bars), or no lamellipodia (grey bars). Data were analyzed with a one-way ANOVA within each phenotype. Each group was compared with the control sample in basal (WT) (n = 3, 320 cells per experiment; **p < 0.01, ***p<0.001).
FIGURE 4
FIGURE 4
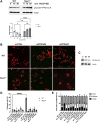
Nox1 controls Par3 activity. (A) Rac activity was determined using GLISA assay in WT and Nox1y/−cells after PDGF-BB stimulation for the indicated times. Differences between genotypes was analyzed with one-way ANOVA (*p < 0.05, **p < 0.01, n = 4). (B) WT and Nox1y/- MEFs, were seeded on collagen-I-coated coverslips, serum starved for 16 h, and stimulated with 10 ng/mL PDGF-BB for 30 min. Cells were fixed and incubated with GST-Rac1G15A and then immunostained for GST and Tiam. Tiam activation depended on Nox1 and was tracked by colocalization of GST, and Tiam signals at the membrane of lamellipodia and protrusions. Look up table (LUT) panels correspond to the magnification of the lamellipodia area shown on merge images (white boxes). Scale bar = 10 μm (C) Quantification of colocalization between Tiam and GST-Rac1G15A signal. The graph shows Pearson’s R values at the lamellipodium area for WT and protrusion area for Nox1y/- cells. Differences were evaluated with an unpaired t-test (****p < 0.001, n = 3, and 5-7 cells per condition in each independent experiment). (D) MEF cells were serum starved for 16 h and stimulated with 10 ng/mL of PDGF-BB for 3 min. Phosphorylated proteins were isolated by affinity chromatography and analyzed by immunoblot using an antibody against Par3. Cortactin and actin were used as controls. Graph shows densitometric analysis of observed levels of phosphoproteins for the 180, 150, and 100 KDa bands corresponding to different Par3 isoforms from three independent experiments. Statistical significance was evaluated with a two-way ANOVA (*p < 0.05, n = 3). (E) Cells were serum starved for 16 h and stimulated for 15 and 30 min with 10 ng/mL PDGF-BB. Cell lysates were analyzed for immunoblot for pThr410/403-PKCζ/λ corresponding to the activation loop of atypical PKCs. Graphs show the densitometric analysis of four independent experiments. Statistical significance was evaluated with a two-way ANOVA (*p < 0.02, p**<0.003, n = 4).
FIGURE 5
FIGURE 5
Nox1 regulates polarity through PP2A phosphatase activity. (A) Cells were serum starved for 16 h and stimulated for 15 and 30 min with 10 ng/mL PDGF-BB. Cell lysates were analyzed for immunoblot for the inactivating-phosphorylation of PP2A-CA using an antibody against pTyr307. Graphs show the densitometric analysis of 4 independent experiments. Data were analyzed with a two-way ANOVA (*p < 0.05, **p < 0.01, ****p < 0.0001, n = 4). (B) Cells were co-transfected with siGlo and siRNA Control (CTRL) or siRNA against PP2A-CA (sequence #4 or #7). Representative images of morphology observed for WT and Nox1y/- cells. Arrows show cells with polar shapes (single lamellipodium), and stars show cells with multiple lamellipodia. Scale bar = 10 μm (C). Efficiency of knockdown using the siRNA Control (CTRL) or siRNA against Par3 (sequence #4 or #7). (D) Quantification of cells that showed a polarized shape, including a single lamellipodium. Statistical differences were determined with two-way ANOVA from three independent experiments (n = 3). Each group was compared (n = 3, 200 cells, ****p < 0.001). (E) Quantification of cells with single lamellipodium (black bars), multiple lamellipodia (white bars), or no lamellipodia (grey bars). Data were analyzed with a one-way ANOVA within each phenotype. Each group was compared with the control sample in basal (WT) (n = 3, 200 cells; ***p < 0.001).
FIGURE 6
FIGURE 6
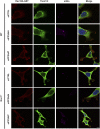
PP2A expression affects GST-Rac1G15A/Tiam colocalization at the lamellipodium. WT and Nox1y/- MEFs, were seeded on collagen-I-coated coverslips, co-transfected with siGlo and siRNA against PP2A CA (sequence #4 or #7: siPP2A#4 and siPP2A#7) or siRNA control (siCTRL), serum starved for 16 h and stimulated with 10 ng/mL PDGF-BB for 30 min. Cells were fixed, incubated with GST-Rac1G15A, and then stained for GST and Tiam. Representative images are shown. Tiam activation at the lamellipodia area is observed in yellow by the colocalization of GST and Tiam. Scale bar = 10 μm .
FIGURE 7
FIGURE 7
PP2A controls Par3 localization. WT and Nox1y/- cells were co-transfected with siGlo and siRNA Control (CTRL) or siRNA against PP2A-CA (sequence #4 or #7: siPP2A#4 and siPP2A#7), serum starved for 16 h and stimulated with 10 ng/mL PDGF-BB for 30 min. Cells were fixed and immunostained for Par3 (green) and nucleus (DAPI, blue). Representative images of Par3 localization observed for WT and Nox1y/- cells. Scale bar = 10 μm.
FIGURE 8
FIGURE 8
Okadaic acid affects cell polarity, the number of lamellipodia, and Par3 localization in lamellipodia. Cells were seeded on Collagen I-coated coverslips, allowed to attach, and serum starved for 16 h. Then, they were incubated with 1 μM of Okadaic acid (OKA) for 30 min and stimulated with 10 ng/mL of PDGF-BB for an additional 30 min. Cells were fixed and stained for (A) Cortactin (red), F-actin (phalloidin, green), and nucleus (DAPI, blue). The lower panel corresponds to the magnification of the above pictures, showing F-actin distribution in single lamellipodia and protrusion in WT and NOX1y/- cells with and without OKA. Scale bar = 10 μm. (B) Quantification of the percentage of polarized cells and (C) Number of lamellipodia after OKA treatment. Percentage of polarized cells (B) and number of lamellipodia (C) were calculated from images of 8–10 random field of view per condition (807 cells total from three independent experiments). Data were analyzed with one-way ANOVA (*p < 0.05, **p < 0.01, ns: no significant). (D) Cells were treated as before and stained with an antibody raised against Par3 (green) and DAPI for nucleus (blue). Representative pictures show the distribution of Par3 along the lamellipodia of WT and Nox1y/- cells in basal and OKA-treated cells. Scale bar = 10 μm.
FIGURE 9
FIGURE 9
PP2A and Nox1-HA localize in lamellipodium. (A) WT and Nox1y/- cells seeded and treated as described before, were stained for PP2A-CA (green), nucleus (blue), and F-actin (magenta). 3D images were created using Imaris software. Bar = 10 μm. (B) WT cells were infected with Nox-1-HA adenovirus. After 24 h, Nox1 localization in cells was assessed by using an anti-HA antibody (red) and phalloidin (magenta), Scale bar = 10 μm.
FIGURE 10
FIGURE 10
Nox1 effect on polarity is observed in vascular smooth muscle cells. (A) Primary mouse aortic smooth muscle cells (MASMCs) derived from WT and Nox1y/- mice were seeded on collagen-I-coated coverslips, serum starved for 16h, and stimulated with 10 ng/mL PDGF-BB for 30 min. Cells were fixed and stained for cortactin (green), F-actin (red phalloidin), and nucleus (DAPI, blue). Scale bar = 10 μm (B) graph shows the quantification of cells that showed a polarized shape, including a single lamellipodium. Statistical significance was analyzed with an unpaired t-test (*p < 0.005, n = 4 and ∼50 cells analyzed per experiment). MASMCs cells were serum starved for 16 h and stimulated for 15 and 30 min with 10 ng/mL PDGF-BB. Cells lysates were analyzed by immunoblot for the (C) inactivating-phosphorylation of PP2A-CA using an antibody against pTyr307 and for (D). pThr410/403-PKCζ/λ corresponding to the activation loop of atypical PKCs. Graphs below each figure show the densitometric analysis of 4 independent experiments (*p < 0.05, **p < 0.01).
FIGURE 11
FIGURE 11
Nox1 effect on the inactivation of PP2A phosphatase and activation of PKCζ/λ is also observed in the femoral arteries of wire-injured mice. Femoral arteries from WT and Nox1y/- mice were injured using a wire, as described in the Material and Methods section. After 21 days, arteries were carefully excised and processed for histological analysis. (A) Sequential sections from 5 animals were used for Hematoxylin and Eosin staining and for the inactivating-phosphorylation of PP2A-CA using an antibody against pTyr307 and for pThr410/403-PKCζ/λ corresponding to the activation loop of atypical PKCs. Graphs show the relative intensity of DAB staining assessed using ImageJ. For pTyr307-PP2A-CA (B) and pThr410/403-PKCζ/λ (C). Differences were assessed with a t-test (n = 5, **p < 0.001), Scale bar = 250 μm.
FIGURE 12
FIGURE 12
Nox1 regulates the activity and localization of the Par3/aPKC/Tiam polarity complex by regulating PP2A activity. In WT cells, PDGF stimulation induces the polarized formation of a single lamellipodium via the assembly of Par3/aPKC/Tiam and the activation of Rac at the leading edge. At the rear end of the cell, Par6 interacts with aPKC and Par3 is not binding Tiam. Our current working model propose that the lack of Nox1 (Nox1y/-) inhibits the activity of the phosphatase PP2A, inducing the aberrant phosphorylation and activation of the Par3/aPKC/Tiam polarity complex. Par3, PP2A, Nox1-HA, and active Tiam amass at multiple membrane locations forming multiple lamellipodia-like structures probably by Rac activation.

Similar articles

References

    1. Ballestrem C., Hinz B., Imhof B. A., Wehrle-Haller B. (2001). Marching at the front and dragging behind: differential alphaVbeta3-integrin turnover regulates focal adhesion behavior. J. Cell. Biol. 155 (7), 1319–1332. 10.1083/jcb.200107107 - DOI - PMC - PubMed
    1. Banai S., Wolf Y., Golomb G., Pearle A., Waltenberger J., Fishbein I., et al. (1998). PDGF-receptor tyrosine kinase blocker AG1295 selectively attenuates smooth muscle cell growth in vitro and reduces neointimal formation after balloon angioplasty in swine. Circulation 97 (19), 1960–1969. 10.1161/01.cir.97.19.1960 - DOI - PubMed
    1. Barisic S., Schmidt C., Walczak H., Kulms D. (2010). Tyrosine phosphatase inhibition triggers sustained canonical serine-dependent NFkappaB activation via Src-dependent blockade of PP2A. Biochem. Pharmacol. 80 (4), 439–447. 10.1016/j.bcp.2010.04.028 - DOI - PubMed
    1. Brown D. I., Lassègue B., Lee M., Zafari R., Long J. S., Saavedra H. I., et al. (2014). Poldip2 knockout results in perinatal lethality, reduced cellular growth and increased autophagy of mouse embryonic fibroblasts. PLoS One 9 (5), e96657. 10.1371/journal.pone.0096657 - DOI - PMC - PubMed
    1. Bustos M. A., Lucchesi O., Ruete M. C., Mayorga L. S., Tomes C. N. (2012). Rab27 and Rab3 sequentially regulate human sperm dense-core granule exocytosis. Proc. Natl. Acad. Sci. U. S. A. 109 (30), E2057–E2066. 10.1073/pnas.1121173109 - DOI - PMC - PubMed

Grants and funding

This study was supported by the HL095070 and HL113167 awards from the National Institutes of Health, United States.