. 2023 Dec;14(1):2250065.
doi: 10.1080/21505594.2023.2250065.

Virulence and transmission characteristics of clade 2.3.4.4b H5N6 subtype avian influenza viruses possessing different internal gene constellations

Affiliations

Virulence and transmission characteristics of clade 2.3.4.4b H5N6 subtype avian influenza viruses possessing different internal gene constellations

Wanchen Zhao et al. Virulence. 2023 Dec.

Abstract

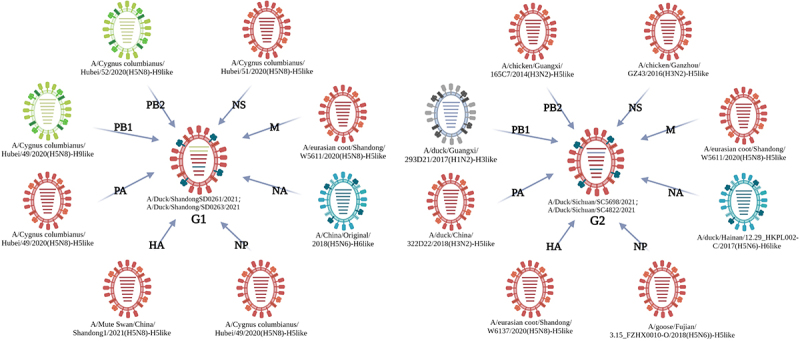
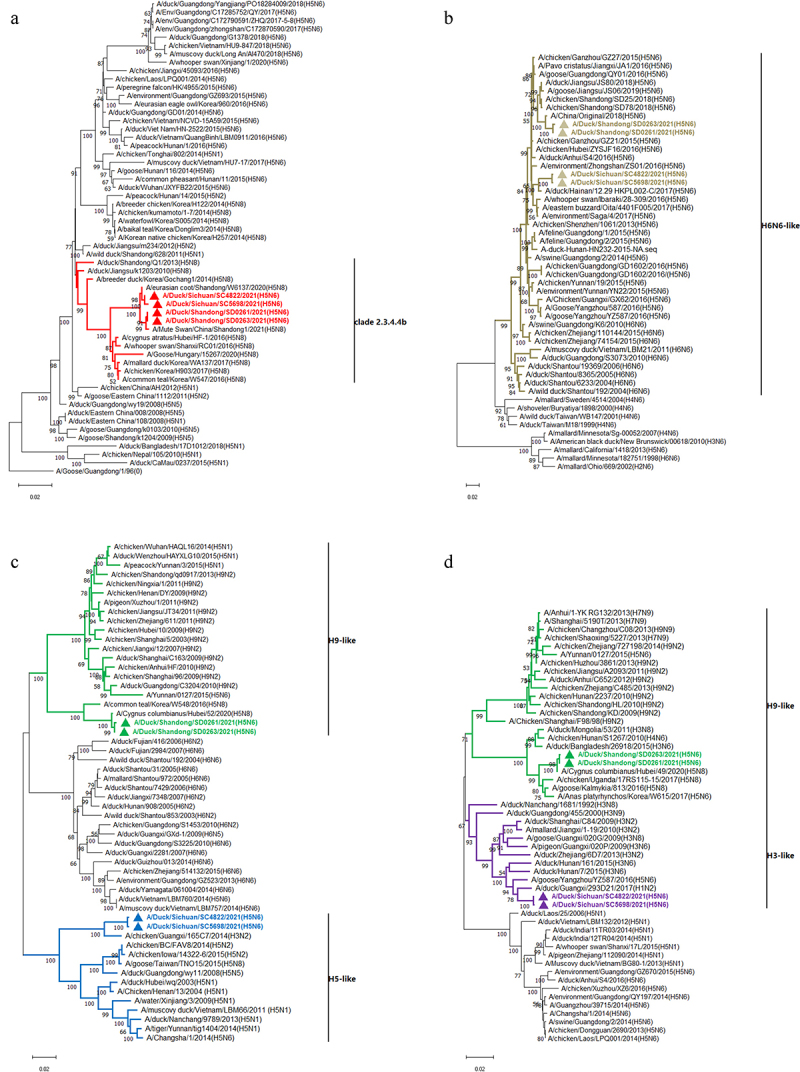
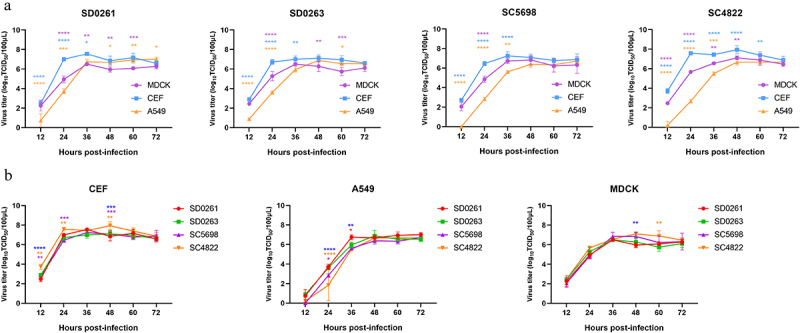
Clade 2.3.4.4 H5N6 avian influenza virus (AIV) has been predominant in poultry in China, and the circulating haemagglutinin (HA) gene has changed from clade 2.3.4.4h to clade 2.3.4.4b in recent years. In 2021, we isolated four H5N6 viruses from ducks during the routine surveillance of AIV in China. The whole-genome sequencing results demonstrated that the four isolates all belonged to the currently prevalent clade 2.3.4.4b but had different internal gene constellations, which could be divided into G1 and G2 genotypes. Specifically, G1 possessed H9-like PB2 and PB1 genes on the H5-like genetic backbone while G2 owned an H3-like PB1 gene and the H5-like remaining internal genes. By determining the characteristics of H5N6 viruses, including growth performance on different cells, plaque-formation ability, virus attachment ability, and pathogenicity and transmission in different animal models, we found that G1 strains were more conducive to replication in mammalian cells (MDCK and A549) and BALB/c mice than G2 strains. However, G2 strains were more advantageously replicated in avian cells (CEF and DF-1) and slightly more transmissible in waterfowls (mallards) than G1 strains. This study enriched the epidemiological data of H5 subtype AIV to further understand its dynamic evolution, and laid the foundation for further research on the mechanism of low pathogenic AIV internal genes in generating novel H5 subtype reassortants.

Keywords: Avian influenza virus; clade 2.3.4.4b H5N6; internal gene; pathogenicity; transmission.


Conflict of interest statement

No potential conflict of interest was reported by the authors.

Figures

Figure 1.
Figure 1.
The strains with the highest similarity to the four H5N6 viruses through BLAST search against the NCBI GenBank database. Eight lines inside the ellipse represent the eight gene segments (PB2, PB1, PA, HA, NP, NA, M, NS from top to bottom). Different colours represent different sources of gene segments, with H9-like in green, H5-like in red, H6-like in blue and H3-like in grey. The peripheral strain indicated the one with the highest nucleotide identity of corresponding gene in the NCBI GenBank database.
Figure 2.
Figure 2.
Phylogenetic trees of the four H5N6 subtype viruses. (a) phylogenetic tree of HA gene, the red branches indicate clade 2.3.4.4b and the red triangles label the four H5N6 viruses in this study. (b) phylogenetic tree of NA gene, the brown branches indicate H6-like strains and the brown triangles label the four H5N6 viruses in this study. (c) phylogenetic tree of PB2 gene, the green branches indicate H9-like strains while the blue branches indicate H5-like strains, and the triangles label the four H5N6 viruses in this study. (d) phylogenetic tree of PB1 gene, the green branches indicate H9-like strains while the purple branches indicate H3-like strains, and the triangles label the four H5N6 viruses in this study. All those phylogenetic trees were constructed using MEGA 11.0 software, with the neighbour-joining method and 1000 replicates of bootstrap analysis.
Figure 3.
Figure 3.
Growth kinetics of the four H5N6 viruses in three cell types of cells. (a) growth curves of the same H5N6 strain in three different cells. (b) growth curves of the four H5N6 viruses in the same cell type. CEF, MDCK, and A549 cells were each infected with the four H5N6 viruses at the MOI of 0.001. After virus adsorption of 1.5 h, infected cells were cultured in serum-free DMEM for 12–72 h. Virus titres were measured at 12, 24, 36, 48, 60, and 72 h post-infection (hpi), and expressed as mean (n = 3) ± standard deviation. In panel a, purple *means MDCK versus CEF, yellow *means MDCK versus A549, and blue *means CEF versus A549. In panel b, blue *means SD0261 versus SC4822, purple *means SC5698 versus SC4822, yellow *means SD0263 versus SC4822, red *means SD0261 versus SC5698. Different numbers of *denote different p-value thresholds (*<0.05, **<0.01, ***<0.001, ****< 0.0001).
Figure 4.
Figure 4.
Plaque-formation capacity of the four H5N6 viruses in different cells. MDCK and DF-1 cells were infected with the MOI of 0.001 for 1.5 h and covered with the mixture of 2× concentrated DMEM (containing 4% foetal bovine serum) and 1.6% agar. After 60 h, infected cells were fixed with 4% paraformaldehyde for 15 min and then stained with crystal violet staining solution for 1 h. Plaques were randomly selected for measurement of the diameter size. Data were expressed as the mean ± standard deviation.
Figure 5.
Figure 5.
The attachment capacity of the four H5N6 viruses in CEF and A549 cells. (a) viral attachment assay in CEF cells. (b) viral attachment assay in A549 cells. (c) data were expressed as mean viral attachment capacity (n = 3) ± standard deviation. CEF or A549 cells were seeded in 6-well plates (approximately 1 × 106.0 cells/per well) and infected with 5 MOI viruses at 37℃ for 1 h. After incubation with an anti-HA2 rabbit monoclonal antibody (SinoBiological, Cat: 86001-RM02) at room temperature for 2 h, the cells were washed with PBST (PBS with 0.05% Tween-20) and treated with fluorescein isothiocyanate (FITC)-labelled goat anti-rabbit IgG at 37℃ in dark for 1 h. Then, the tested cells were digested from the 6-well plates to prepare cell suspension for the flow cytometry assay.
Figure 6.
Figure 6.
Pathogenicity and replication of the four H5N6 viruses in mice. (a) body weight changes and survival curves of mice infected with the four H5N6 viruses. Four groups of five six-week-old female BALB/c mice were inoculated intranasally with 106.0 EID50 virus in 50 μL volume, and another group of five mice was mock-infected with PBS to serve as a control. The weight changes and survival of mice were recorded daily for 14 days. (b) replication of the four H5N6 viruses in the lung and brain of infected mice. Virus replication in organs was assessed by mean viral titres (n = 3) ± standard deviation. Different numbers of *denote different p-value thresholds (*<0.05, **<0.01, ***<0.001, ****< 0.0001). (c) HE staining of sectioned lungs from mice infected with the four H5N6 viruses on 3 and 5 days post-inoculation (dpi). The histological sections were observed and photographed at 200 × magnification.
Figure 7.
Figure 7.
Pathogenicity and transmission of the four H5N6 viruses in mallard ducks. (a) survival curves of inoculated and contact ducks in either virus group. (b) replication of the four H5N6 viruses in different tissues of challenged ducks. Two groups of fourteen three-week-old SPF mallard ducks were inoculated intranasally with SD0263 (G1 genotype) and SC4822 (G2 genotype) viruses of 106.0 EID50 in 200 μL volume per duck. At 24 h post-inoculation (hpi), two groups of five naïve ducks were fed together with either inoculated group to serve as direct-contact individuals. For inoculated ducks in either group, five were daily monitored disease and death until 14 days post-inoculation (dpi) while the other nine ducks were humanely killed on 1, 3, and 5 days (three ducks per day) for evaluation of virus replication in different tissues. In addition, mortality of all the contact ducks was also recorded until 14 dpi. Virus replication in different tissues of inoculated ducks was evaluated by mean virus titres ± standard deviation (n = 3).

Similar articles

Cited by

References

    1. Nunez IA, Ross TM.. A review of H5Nx avian influenza viruses. Ther Adv Vaccines Immunother. 2019;7:2515135518821625. doi: 10.1177/2515135518821625 - DOI - PMC - PubMed
    1. Revised and updated nomenclature for highly pathogenic avian influenza a (H5N1) viruses . Influenza and other respiratory viruses. Influenza Other Respir Viruses. 2014;8(3):384–14. doi: 10.1111/irv.12230 - DOI - PMC - PubMed
    1. Zhang R, Chen T, Ou X, et al. Clinical, epidemiological and virological characteristics of the first detected human case of avian influenza A(H5N6) virus. Infect Genet Evol. 2016;40:236–242. doi: 10.1016/j.meegid.2016.03.010 - DOI - PMC - PubMed
    1. Bi Y, Chen Q, Wang Q, et al. Genesis, evolution and prevalence of H5N6 avian influenza viruses in China. Cell Host Microbe. 2016;20(6):810–821. doi: 10.1016/j.chom.2016.10.022 - DOI - PubMed
    1. Zhang Q, Mei X, Zhang C, et al. Novel reassortant 2.3.4.4B H5N6 highly pathogenic avian influenza viruses circulating among wild, domestic birds in Xinjiang, Northwest China. J Vet Sci. 2021;22(4):e43. doi: 10.4142/jvs.2021.22.e43 - DOI - PMC - PubMed

Publication types

Grants and funding

This work was supported by the National Key Research and Development Program of China (2022YFC2604201), Earmarked Fund for China Agriculture Research System (CARS-40), Priority Academic Program Development of Jiangsu Higher Education Institutions (PAPD), and Jiangsu Qinglan Project.

LinkOut - more resources