Label-free tumor cells classification using deep learning and high-content imaging
- PMID: 37634014
- PMCID: PMC10460430
- DOI: 10.1038/s41597-023-02482-8
Label-free tumor cells classification using deep learning and high-content imaging
Abstract
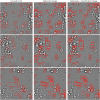
Many studies have shown that cellular morphology can be used to distinguish spiked-in tumor cells in blood sample background. However, most validation experiments included only homogeneous cell lines and inadequately captured the broad morphological heterogeneity of cancer cells. Furthermore, normal, non-blood cells could be erroneously classified as cancer because their morphology differ from blood cells. Here, we constructed a dataset of microscopic images of organoid-derived cancer and normal cell with diverse morphology and developed a proof-of-concept deep learning model that can distinguish cancer cells from normal cells within an unlabeled microscopy image. In total, more than 75,000 organoid-drived cells from 3 cholangiocarcinoma patients were collected. The model achieved an area under the receiver operating characteristics curve (AUROC) of 0.78 and can generalize to cell images from an unseen patient. These resources serve as a foundation for an automated, robust platform for circulating tumor cell detection.
© 2023. Springer Nature Limited.
Conflict of interest statement
The authors declare no competing interests.
Figures


Similar articles
-
Deep Learning in Label-free Cell Classification.Sci Rep. 2016 Mar 15;6:21471. doi: 10.1038/srep21471. Sci Rep. 2016. PMID: 26975219 Free PMC article.
-
Development and validation of a deep-learning algorithm for the detection of neovascular age-related macular degeneration from colour fundus photographs.Clin Exp Ophthalmol. 2019 Nov;47(8):1009-1018. doi: 10.1111/ceo.13575. Epub 2019 Jul 25. Clin Exp Ophthalmol. 2019. PMID: 31215760
-
Interpretable deep learning model to predict the molecular classification of endometrial cancer from haematoxylin and eosin-stained whole-slide images: a combined analysis of the PORTEC randomised trials and clinical cohorts.Lancet Digit Health. 2023 Feb;5(2):e71-e82. doi: 10.1016/S2589-7500(22)00210-2. Epub 2022 Dec 7. Lancet Digit Health. 2023. PMID: 36496303 Clinical Trial.
-
Deep learning-based classification of kidney transplant pathology: a retrospective, multicentre, proof-of-concept study.Lancet Digit Health. 2022 Jan;4(1):e18-e26. doi: 10.1016/S2589-7500(21)00211-9. Epub 2021 Nov 15. Lancet Digit Health. 2022. PMID: 34794930
-
A deep transfer learning framework for the automated assessment of corneal inflammation on in vivo confocal microscopy images.PLoS One. 2021 Jun 3;16(6):e0252653. doi: 10.1371/journal.pone.0252653. eCollection 2021. PLoS One. 2021. PMID: 34081736 Free PMC article.
Cited by
-
Artificial intelligence: illuminating the depths of the tumor microenvironment.J Transl Med. 2024 Aug 29;22(1):799. doi: 10.1186/s12967-024-05609-6. J Transl Med. 2024. PMID: 39210368 Free PMC article. Review.
-
Application of AI on cholangiocarcinoma.Front Oncol. 2024 Jan 29;14:1324222. doi: 10.3389/fonc.2024.1324222. eCollection 2024. Front Oncol. 2024. PMID: 38347839 Free PMC article. Review.
-
Evaluating Circulating Biomarkers for Diagnosis, Prognosis, and Tumor Monitoring in Pediatric Sarcomas: Recent Advances and Future Directions.Biomolecules. 2024 Oct 16;14(10):1306. doi: 10.3390/biom14101306. Biomolecules. 2024. PMID: 39456239 Free PMC article. Review.
-
Editorial: Experts' opinion in medicine 2022.Front Med (Lausanne). 2023 Oct 10;10:1296196. doi: 10.3389/fmed.2023.1296196. eCollection 2023. Front Med (Lausanne). 2023. PMID: 37886362 Free PMC article. No abstract available.
-
Nondestructive, quantitative viability analysis of 3D tissue cultures using machine learning image segmentation.APL Bioeng. 2024 Mar 28;8(1):016121. doi: 10.1063/5.0189222. eCollection 2024 Mar. APL Bioeng. 2024. PMID: 38566822 Free PMC article.
References
-
- Rawal, S., Yang, Y.-P., Cote, R. & Agarwal, A. Identification and quantitation of circulating tumor cells. Annual Review of Analytical Chemistry10, 321–343, 10.1146/annurev-anchem-061516-045405. PMID: 28301753 (2017). - PubMed
-
- Satelli, A., Brownlee, Z., Mitra, A., Meng, Q. & Li, S. Circulating tumor cell enumeration with a combination of epithelial cell adhesion molecule- and cell-surface vimentin-based methods for monitoring breast cancer therapeutic response. Clinical chemistry61, 10.1373/clinchem.2014.228122 (2014). - PMC - PubMed
Publication types
MeSH terms
LinkOut - more resources
Full Text Sources

