. 2023 Aug;11(8):e006666.
doi: 10.1136/jitc-2023-006666.

TP53 gain-of-function mutation modulates the immunosuppressive microenvironment in non-HPV-associated oral squamous cell carcinoma

Affiliations

TP53 gain-of-function mutation modulates the immunosuppressive microenvironment in non-HPV-associated oral squamous cell carcinoma

Yewen Shi et al. J Immunother Cancer. 2023 Aug.

Abstract

Background: TP53, the most mutated gene in solid cancers, has a profound impact on most hallmarks of cancer. Somatic TP53 mutations occur in high frequencies in head and neck cancers, including oral squamous cell carcinoma (OSCC). Our study aims to understand the role of TP53 gain-of-function mutation in modulating the tumor immune microenvironment (TIME) in OSCC.

Methods: Short hairpin RNA knockdown of mutant p53R172H in syngeneic oral tumors demonstrated changes in tumor growth between immunocompetent and immunodeficient mice. HTG EdgeSeq targeted messenger RNA sequencing was used to analyze cytokine and immune cell markers in tumors with inactivated mutant p53R172H. Flow cytometry and multiplex immunofluorescence (mIF) confirmed the role of mutant p53R172H in the TIME. The gene expression of patients with OSCC was analyzed by CIBERSORT and mIF was used to validate the immune landscape at the protein level.

Results: Mutant p53R172H contributes to a cytokine transcriptome network that inhibits the infiltration of cytotoxic CD8+ T cells and promotes intratumoral recruitment of regulatory T cells and M2 macrophages. Moreover, p53R172H also regulates the spatial distribution of immunocyte populations, and their distribution between central and peripheral intratumoral locations. Interestingly, p53R172H-mutated tumors are infiltrated with CD8+ and CD4+ T cells expressing programmed cell death protein 1, and these tumors responded to immune checkpoint inhibitor and stimulator of interferon gene 1 agonist therapy. CIBERSORT analysis of human OSCC samples revealed associations between immune cell populations and the TP53R175H mutation, which paralleled the findings from our syngeneic mouse tumor model.

Conclusions: These findings demonstrate that syngeneic tumors bearing the TP53R172H gain-of-function mutation modulate the TIME to evade tumor immunity, leading to tumor progression and decreased survival.

Keywords: cytokines; head and neck neoplasms; immune checkpoint inhibitors; immunotherapy; tumor microenvironment.


Conflict of interest statement

Competing interests: No, there are no competing interests.

Figures
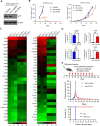
Figure 1
Figure 1
The gain-of-function (GOF) p53R172H mutation controls the immune-related transcriptome in oral cancer progression. (A) Western blot analysis of p53R172H expression in parental, non-targeting control (NTC) and p53-short hairpin RNA (shRNA) ROC3 tumor cells. (B) ROC3 tumor cells from the parental, NTC and p53-shRNA lines (500 000 cells per line) were implanted into the tongues of C57BL/6J mice (n=5) and immunodeficient RAG1-knockout (KO) mice (n=5). Error bars show the SD. Arrows show tumor time point for HTG EdgeSeq studies. (C) Gene expression analysis of immune-related genes performed using an HTG EdgeSeq mouse messenger RNA (mRNA) tumor response panel. The heatmaps represent high (red) and low (green) RNA expression by arbitrary units (range 5.5–14 units). Every column represents an NTC or p53-knockdown (KD) tumor sample, and every row represents an immune-related gene. (D) Validation of chemokine RNA expression using quantitative PCR. Bars show the means of triplicate experiments. Error bars show the SEMs. Unpaired, two-tailed Student’s t-test p values are shown for the comparison of control versus p53-KD ROC3 tumor cells. **P<0.005; ***p<0.0005; ****p<0.0001. (E) ROC3 tumors responded to anti-CCL2 antibody treatment. (Top panel) Process diagram of the orthotopic injection of tumor cells (500 000 cells implanted: n=5 mice) and the treatment of ROC3-tumor-model mice with anti-C-C motif chemokine ligand 2 (CCL2) antibody. (Middle graph) ROC3 tumor-bearing mice that received single-antibody immunotherapy showed tumor response. (Bottom graph) Anti-CCL2 treatment significantly improved overall survival (log-rank test; p<0.0001).
Figure 2
Figure 2
Mutant p53R172H promotes the infiltration of immune suppressor cells in the tumor microenvironment. Comparison of the frequencies of (A) IFNγ+CD8+ T cells; (B) FoxP3+CD4+ (Treg) cells; (C) CD4+ PD-1+ T cells; (D) CD8+ PD-1+ T cells; (E) CD4+ IL-17+ T cells and (F) LyG+LyClow G-MDSC. Dots represent individual samples (n=4–5). Error bars show the SD. Unpaired, two-tailed Student’s t-test p values are shown. ****P<0.0001. G-MDSC, granulocyte myeloid-derived suppressor cell; IFN, interferon; IL, interleukin; KD, knockdown; NTC, non-targeting control; PD-1, programmed cell death protein 1; Treg, regulatory T cells.
Figure 3
Figure 3
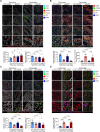
Spatial evaluation of immune cell populations associated with mutant p53R172H. Tumor tissues were stained using fluorescent multiplex immunohistochemical analysis to detect different (A) T-cell markers (CD4, CD8, granzyme B (GzmB) and FoxP3); (B) myeloid cell markers (CD68, CD206 and CD11c); (C) the immune checkpoint marker programmed cell death protein 1 (PD-1) and (D) the tumor immunity regulation marker stimulator of interferon gene (STING). The numbers in each cell subset among the tumor cells within 50 μm was determined using Visiopharm software, and multiplex immunohistochemical quantification was defined as the number of cells per mm2. Three tumors were stained, and every sample had three tumor core views and three tumor edge views analyzed. *P<0.05; **p<0.01; ***p<0.001; ****p<0.0001. CK, cytokeratin; KD, knockdown; NTC, non-targeting control; shRNA, short hairpin RNA. Bars represent SE.
Figure 4
Figure 4
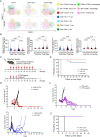
Mutant p53R172H modulates the immune cell distribution within a warm tumor immune microenvironment that responds to immunotherapy treatment. (A) Uniform manifold approximation and projection clustering analysis (UMAP) of tumor tissues stained with Opal multiplex immunofluorescence. (B) Distance measurements of different immune cell populations within tumor tissues. The calculated distance was to the nearest cell within an area 1 mm in diameter. (C) Process diagram of the orthotopic injection of tumor cells (500 000 cells implanted; n=10 mice) and the treatment of ROC3 tumor model mice with antiprogrammed cell death protein 1 (PD-1) antibody, anti T-cell immunoreceptor with immunoglobulin and immunoreceptor tyrosine-based inhibitory motif domains (TIGIT) antibody and stimulator of interferon gene (STING). (D) ROC3 tumor-bearing mice that received single-antibody immunotherapy showed tumor response. (E) Anti-PD-1 and anti-TIGIT significantly improved overall survival (log-rank test; p<0.0001). (F) ROC3 tumors responded to STING-agonist monotherapy (c-di-GMP). (G) STING-agonist treatment improved tumor-free survival. Three tumors were stained, each sample had three tumor core views and three tumor edge views were analyzed. *P<0.05; **p<0.01; ****p<0.0001. Bars represent the SE. CK, cytokeratin; GzmB, granzyme B; KD, knockdown; NTC, non-targeting control; PBS, phosphate-buffered saline.
Figure 5
Figure 5
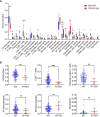
Human TP53R175H mutation regulates immune cell infiltration as demonstrated with CIBERSORT. (A) The relative proportions of 22 human immune cell types in patients with OSCC. (B) Mean values and SD for specially listed cell subsets, such as total lymphocytes, CD8 cells, follicular helper T cells, M1 macrophages, M2 macrophages and neutrophils were calculated for each patient group. CIBERSORT immune cell fractions were determined for each patient. Each dot represents one patient. **P<0.01; ***p<0.001. Bars represent SE. NK, natural killer; ns, not significant; WT, wild type.
Figure 6
Figure 6
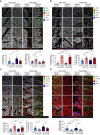
Evaluation of the tumor immune microenvironment (TIME) in patients with oral squamous cell carcinoma (OSCC) with TP53R175H mutation. Patient tumor tissues were stained using Opal multiplex immunofluorescence (mIF) to detect (A) T-cell markers (CD3, CD4, CD8, granzyme B (GzmB) and FoxP3) and (B) immune-checkpoint markers (programmed cell death protein 1 (PD-1) and T-cell immunoreceptor with immunoglobulin and immunoreceptor tyrosine-based inhibitory motif domains (TIGIT)). (C) Myeloid cell markers (CD68, CD11c, CD206) and (D) stimulator of interferon gene (STING) expression. Scale bar, 50 μm. The Opal multiplex immunohistochemical quantification was scored as the cell density, defined as the number of positive cells per view (20×). Five TP53 wild-type (WT) and four TP53 R175H patient samples were used. Five fields per sample were analyzed. *P<0.05; **p<0.01; ***p<0.001; ****p<0.0001.
Figure 7
Figure 7
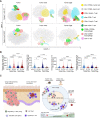
Mutant p53R175H controls the immune cell distribution within tumor microenvironment and is associated with reduced survival in patients with oral squamous cell carcinoma (OSCC). (A) Representative uniform manifold approximation and projection (UMAP) clustering analysis of tumor tissues stained with Opal multiplex immunofluorescence of patients 1 and 4. (B) Distance measurements of different immune cell populations within tumor tissues. The calculated distance was to the nearest cell within an area 1 mm in diameter. (C) Working model of mutant p53R172/TP53R175H role in shaping the immune microenvironment of OSCC. (Left panel) Gain-of-function mutant p53R172H drives the infiltration of cytotoxic CD8+ T cells, and promotes intratumoral recruitment of Tregs, and M2 macrophages, thereby promoting tumor progression. (Right panel) Mouse and human tumor cells expressing p53R172H/TP53R175H gain-of-function mutations promote a spatial association with immunosuppressive cells (M2 TAM, Tregs) to reduce the number prevent the activation of dendritic and cytotoxic T cells in different tumor zones (core and edge). Knockdown (KD) mutant Trp53 (mouse) or expression of TP53 WT (human) in STING (+) tumor cells, contains more dendritic cells, active cytotoxic T cells and reduces the numbers of Tregs and M2 TAMs within the tumor microenvironment. Bars in the graphs represent SE with the following p values: *p<0.05; ****p<0.0001. M2 TAM, tumor-associated macrophage type 2; Tregs, regulatory T cells; STING, stimulator of interferon response cGAMP interactor.

Similar articles

Cited by

References

    1. Califano J, van der Riet P, Westra W, et al. . Genetic progression model for head and neck cancer: implications for field Cancerization. Cancer Res 1996;56:2488–92. - PubMed
    1. Califano J, Westra WH, Meininger G, et al. . Genetic progression and Clonal relationship of recurrent Premalignant head and neck lesions. Clin Cancer Res 2000;6:347–52. - PubMed
    1. Ernani V, Saba NF. Oral cavity cancer: risk factors, pathology, and management. Oncology 2015;89:187–95. 10.1159/000398801 - DOI - PubMed
    1. Myers J. Cancer of the head and neck. 2017.
    1. Rangel R, Pickering CR, Sikora AG, et al. . Genetic changes driving immunosuppressive Microenvironments in oral Premalignancy. Front Immunol 2022;13:840923. 10.3389/fimmu.2022.840923 - DOI - PMC - PubMed

Publication types