. 2023 Aug 29;42(8):112982.
doi: 10.1016/j.celrep.2023.112982. Epub 2023 Aug 15.

Rapid RGR-dependent visual pigment recycling is mediated by the RPE and specialized Müller glia

Affiliations

Rapid RGR-dependent visual pigment recycling is mediated by the RPE and specialized Müller glia

Aleksander Tworak et al. Cell Rep. .

Abstract

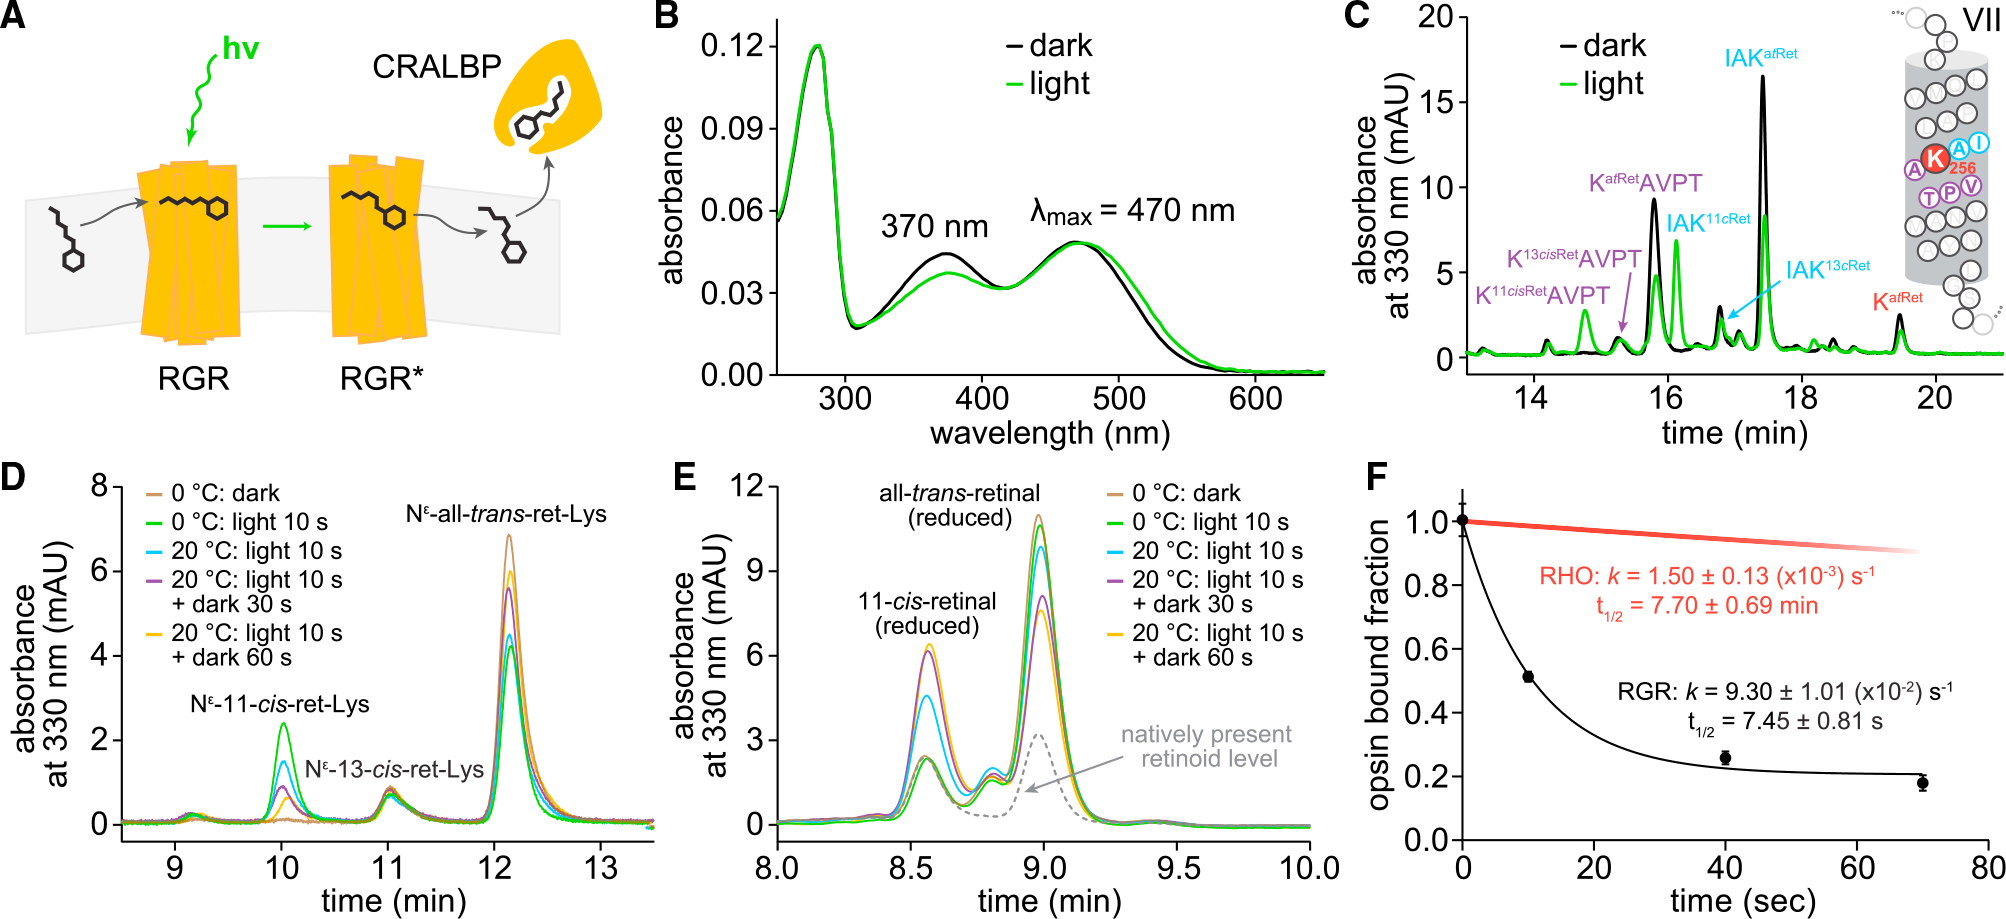
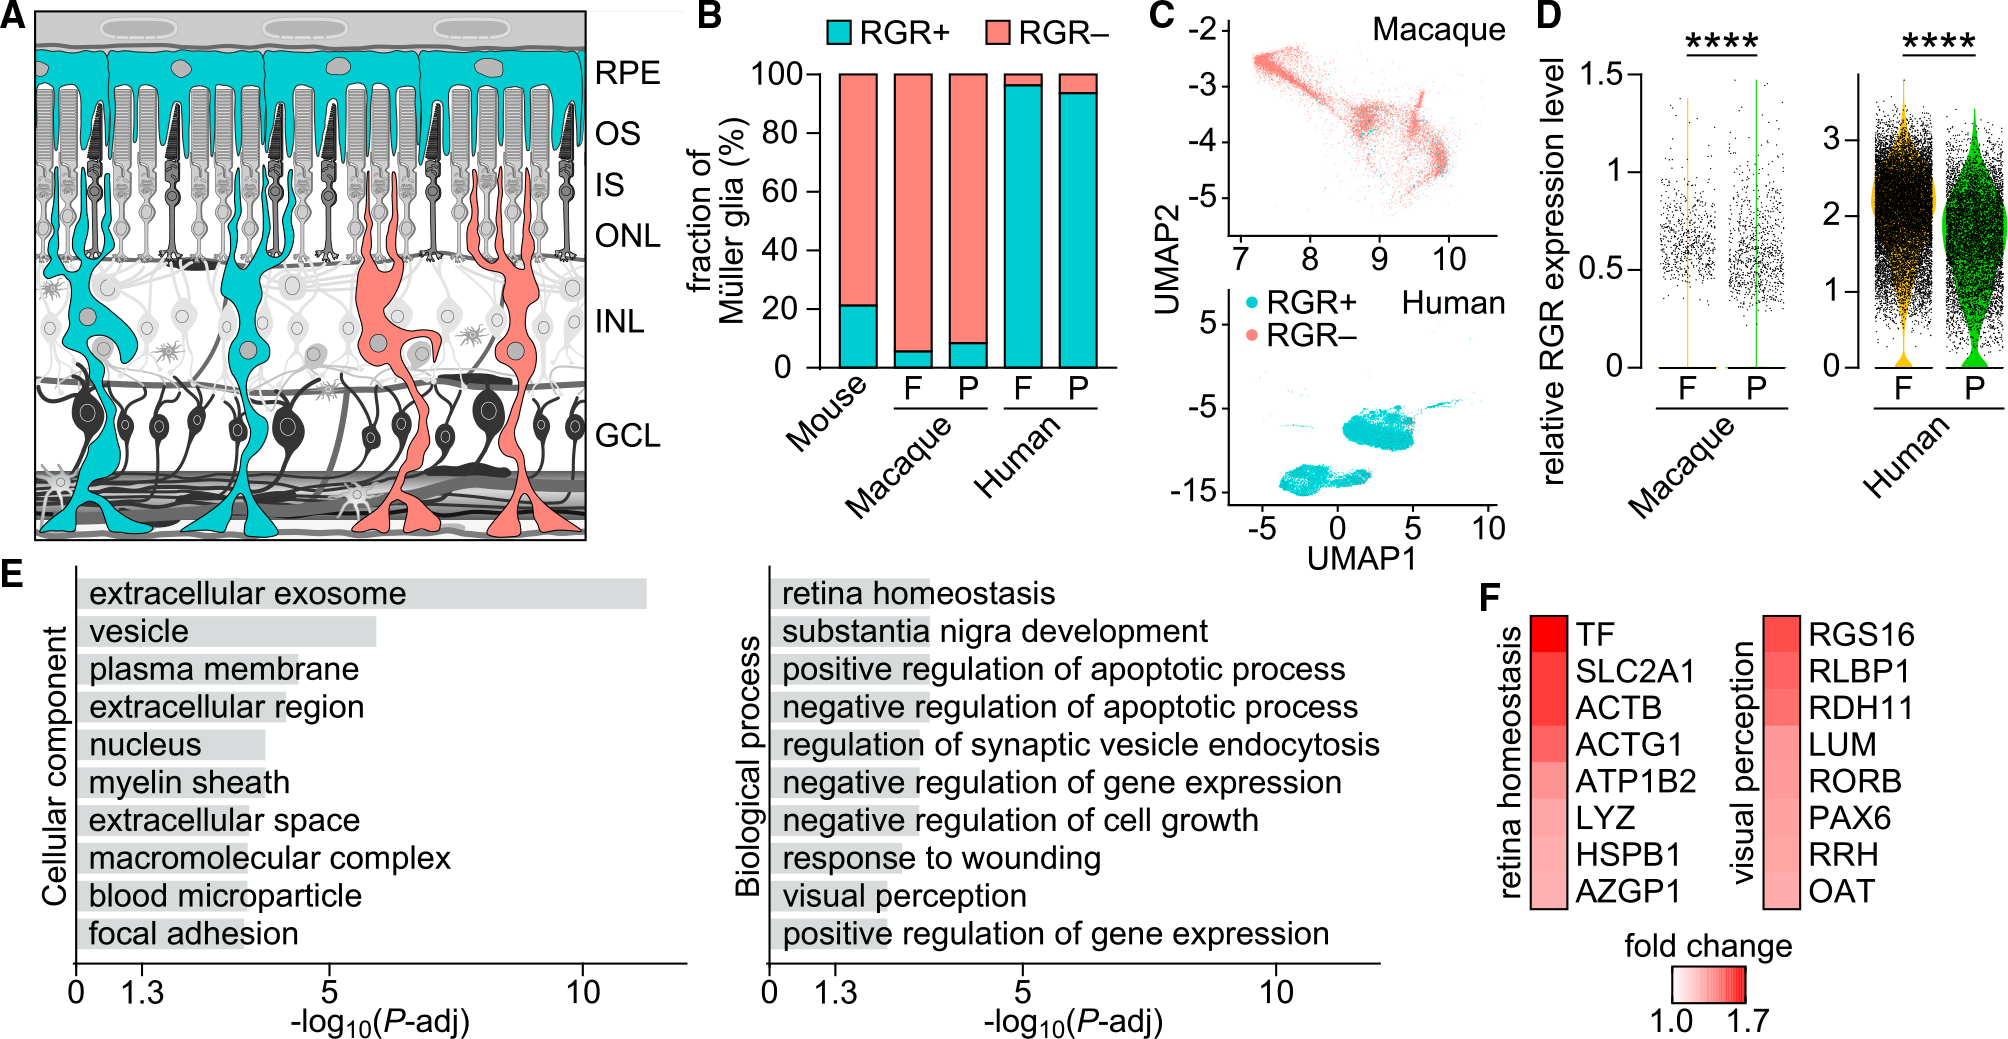
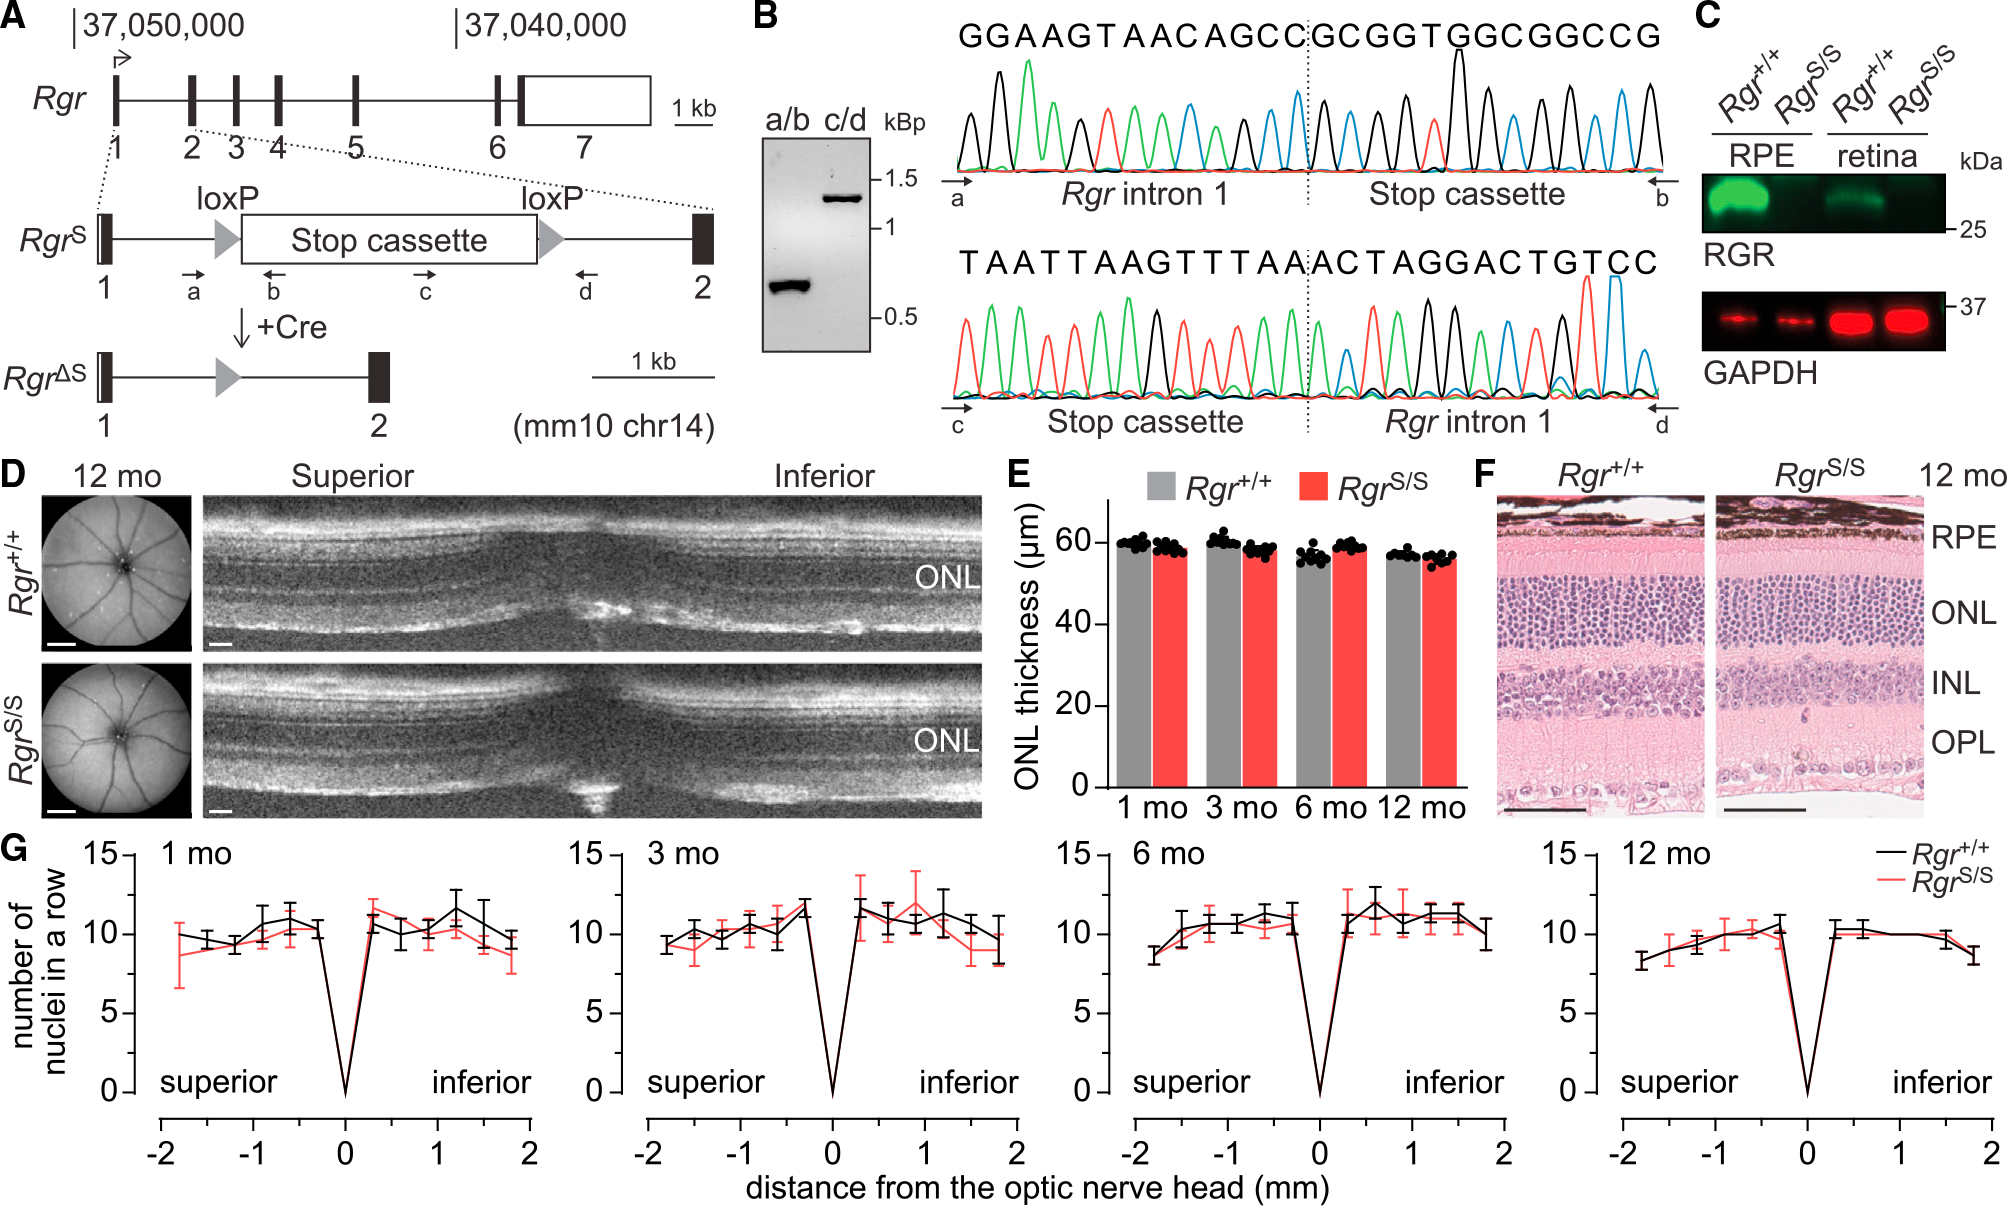
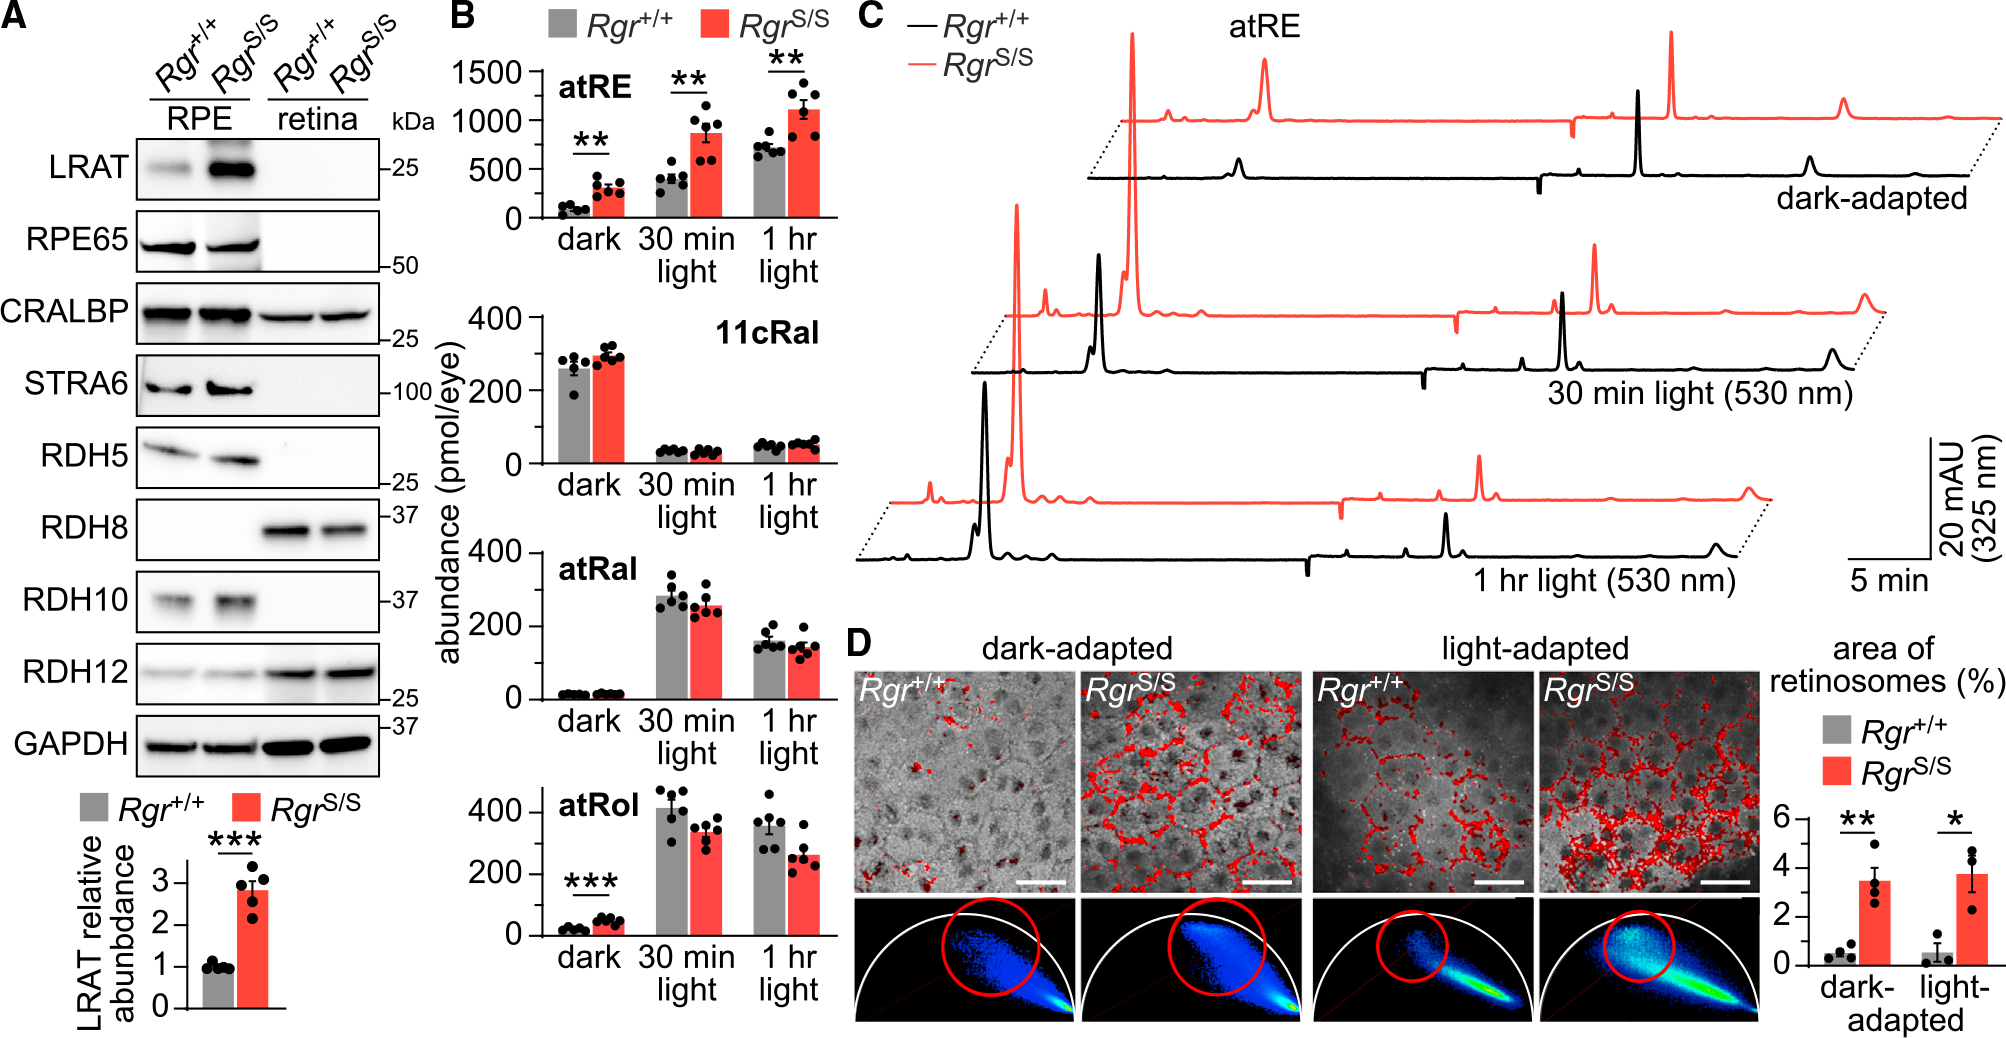
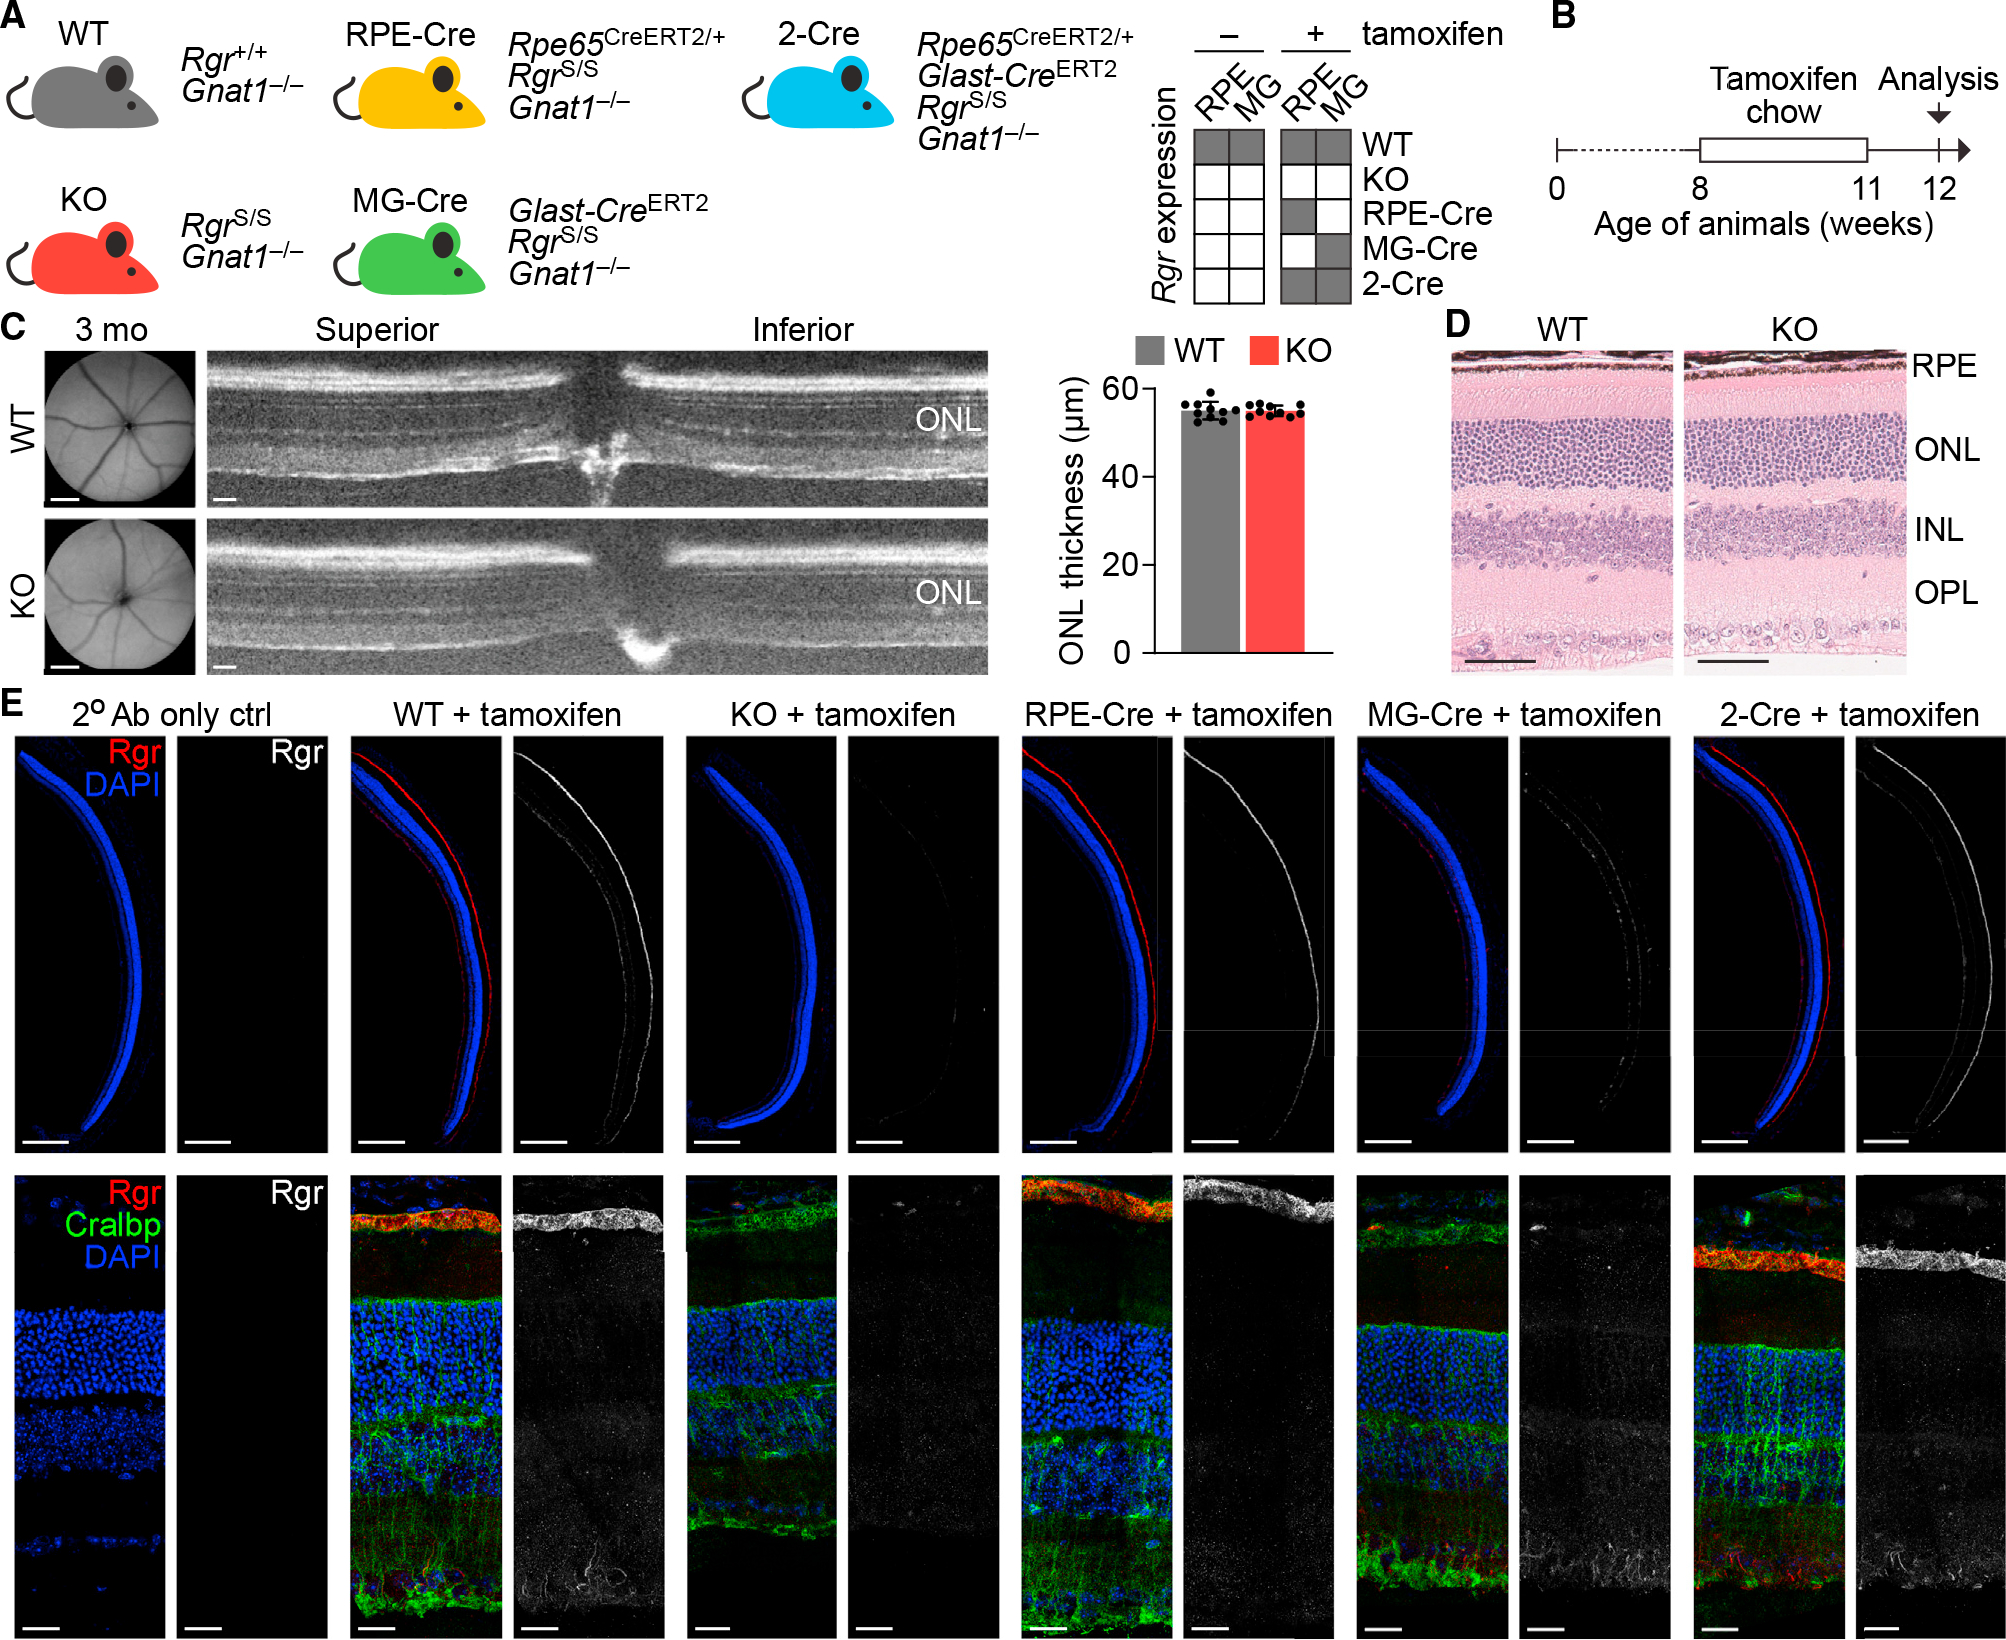
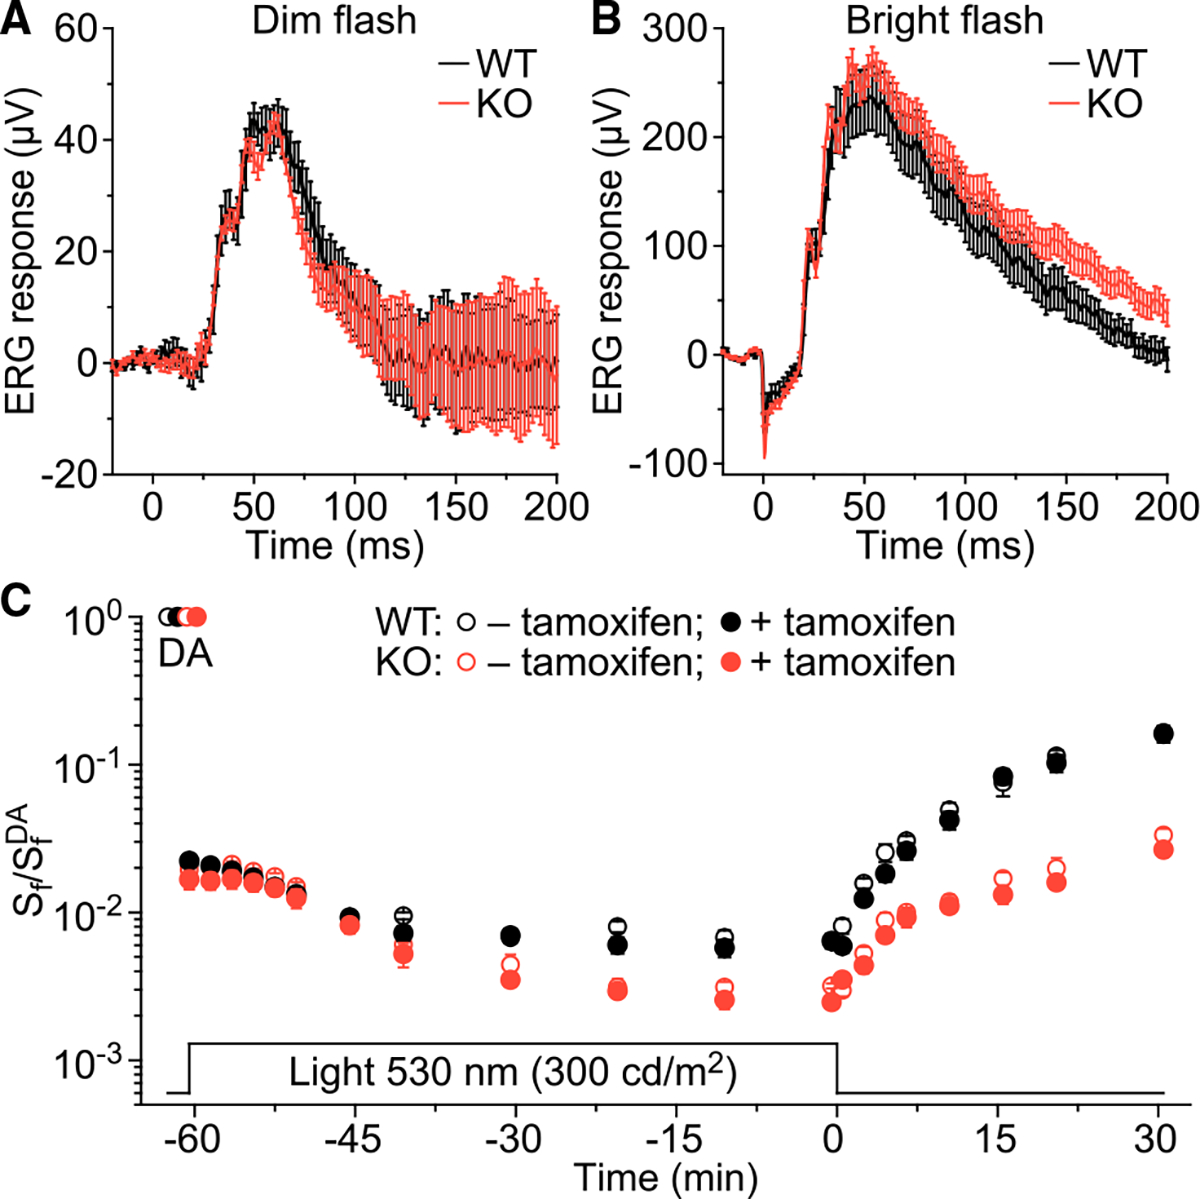
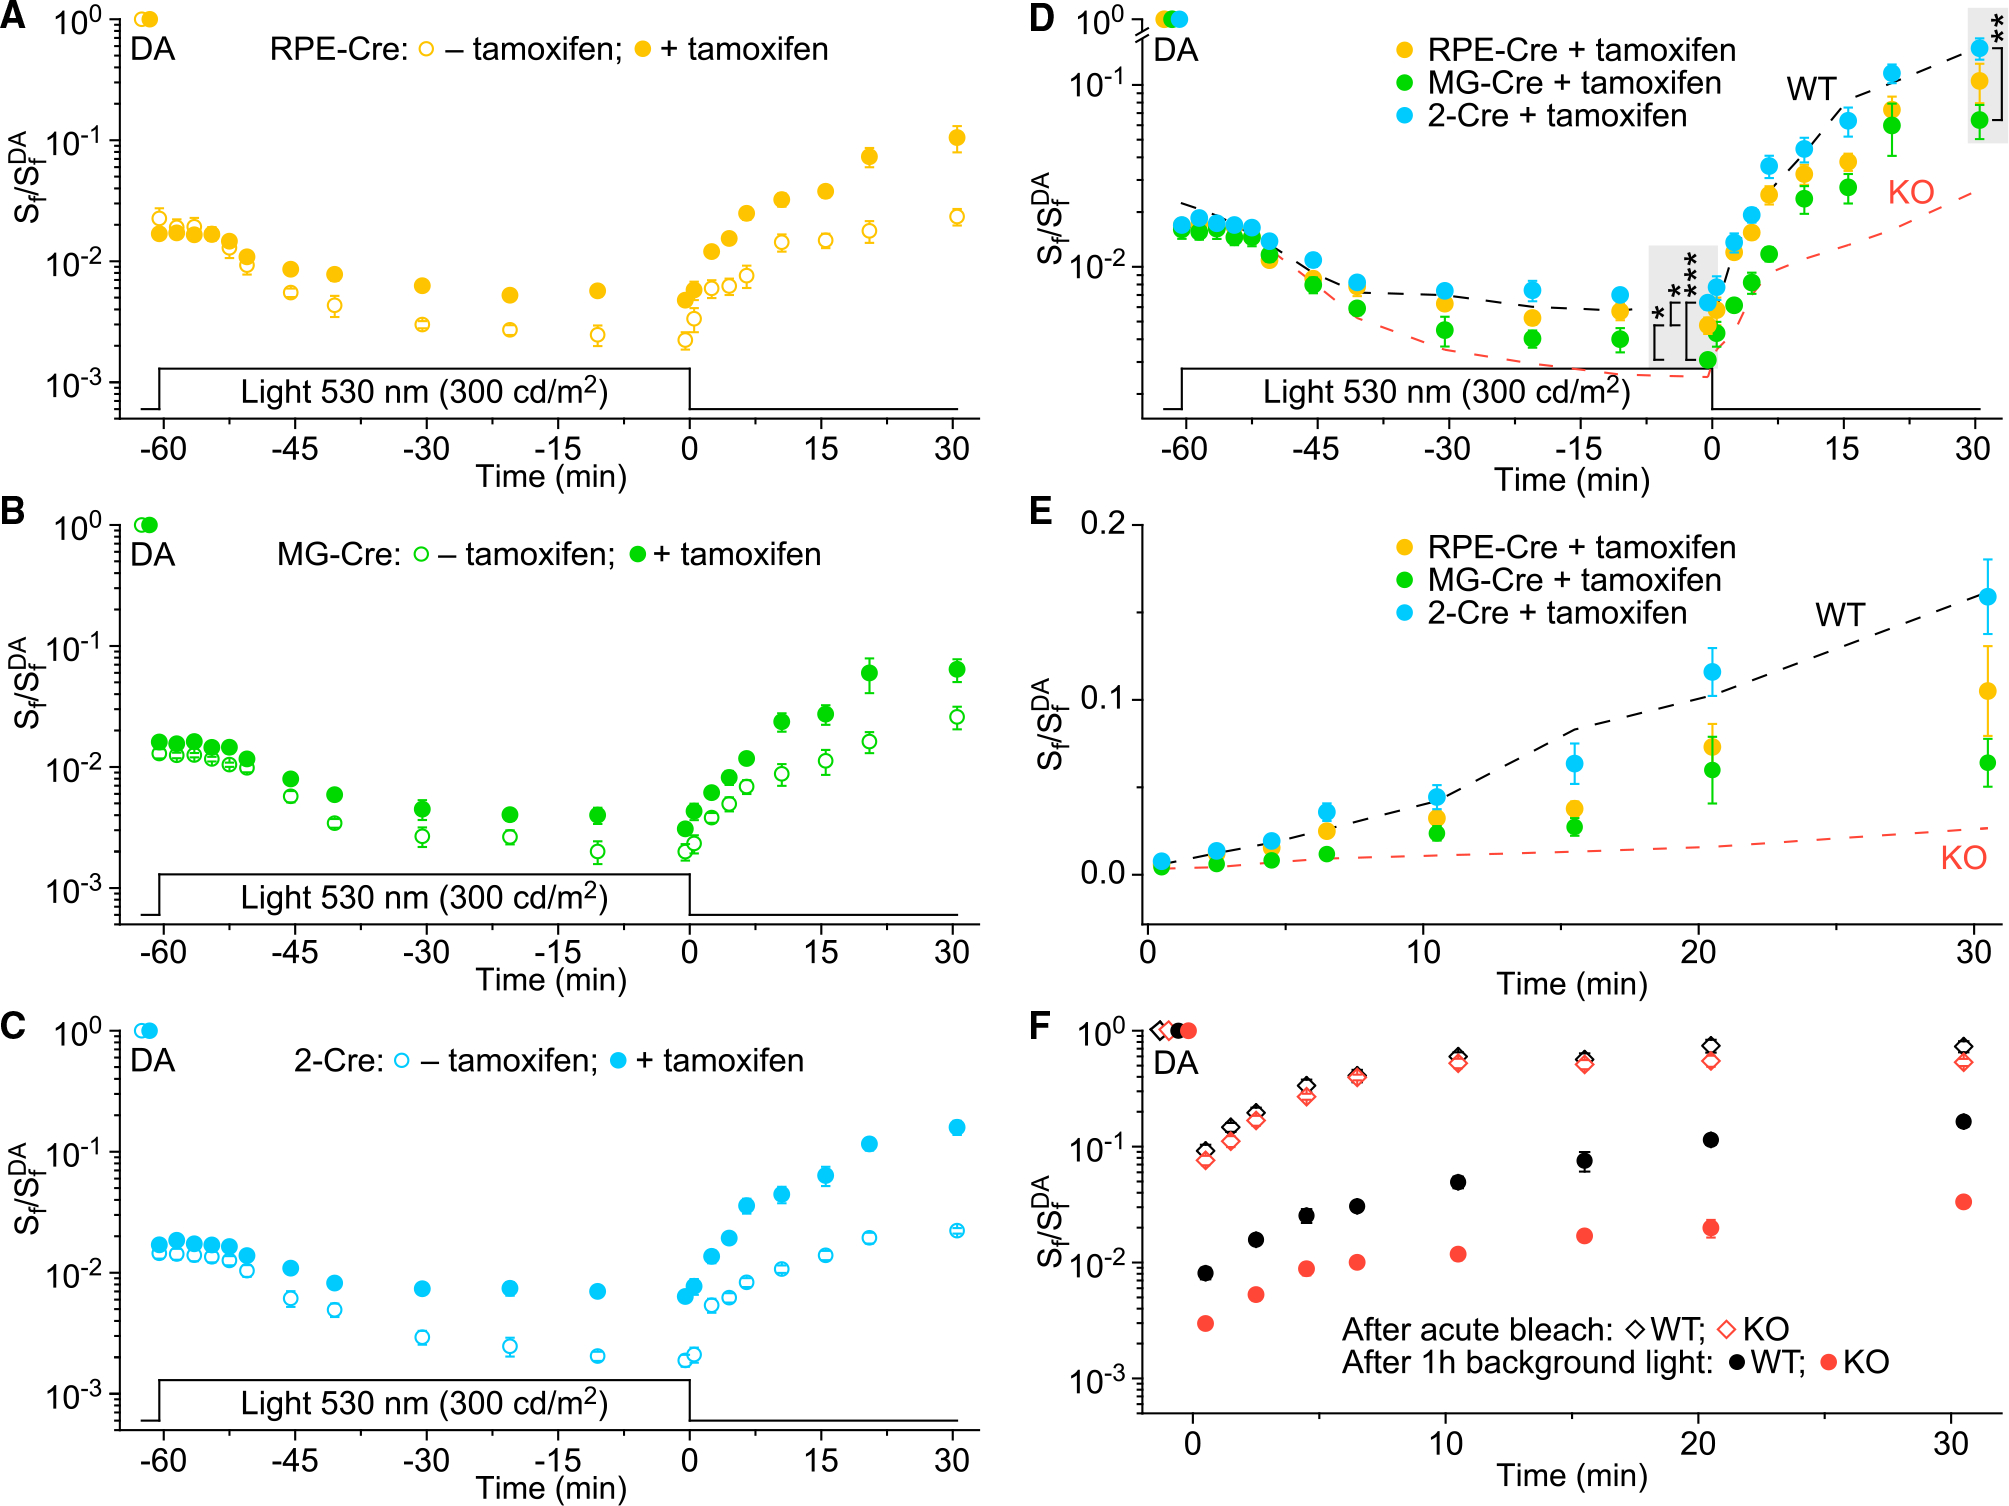
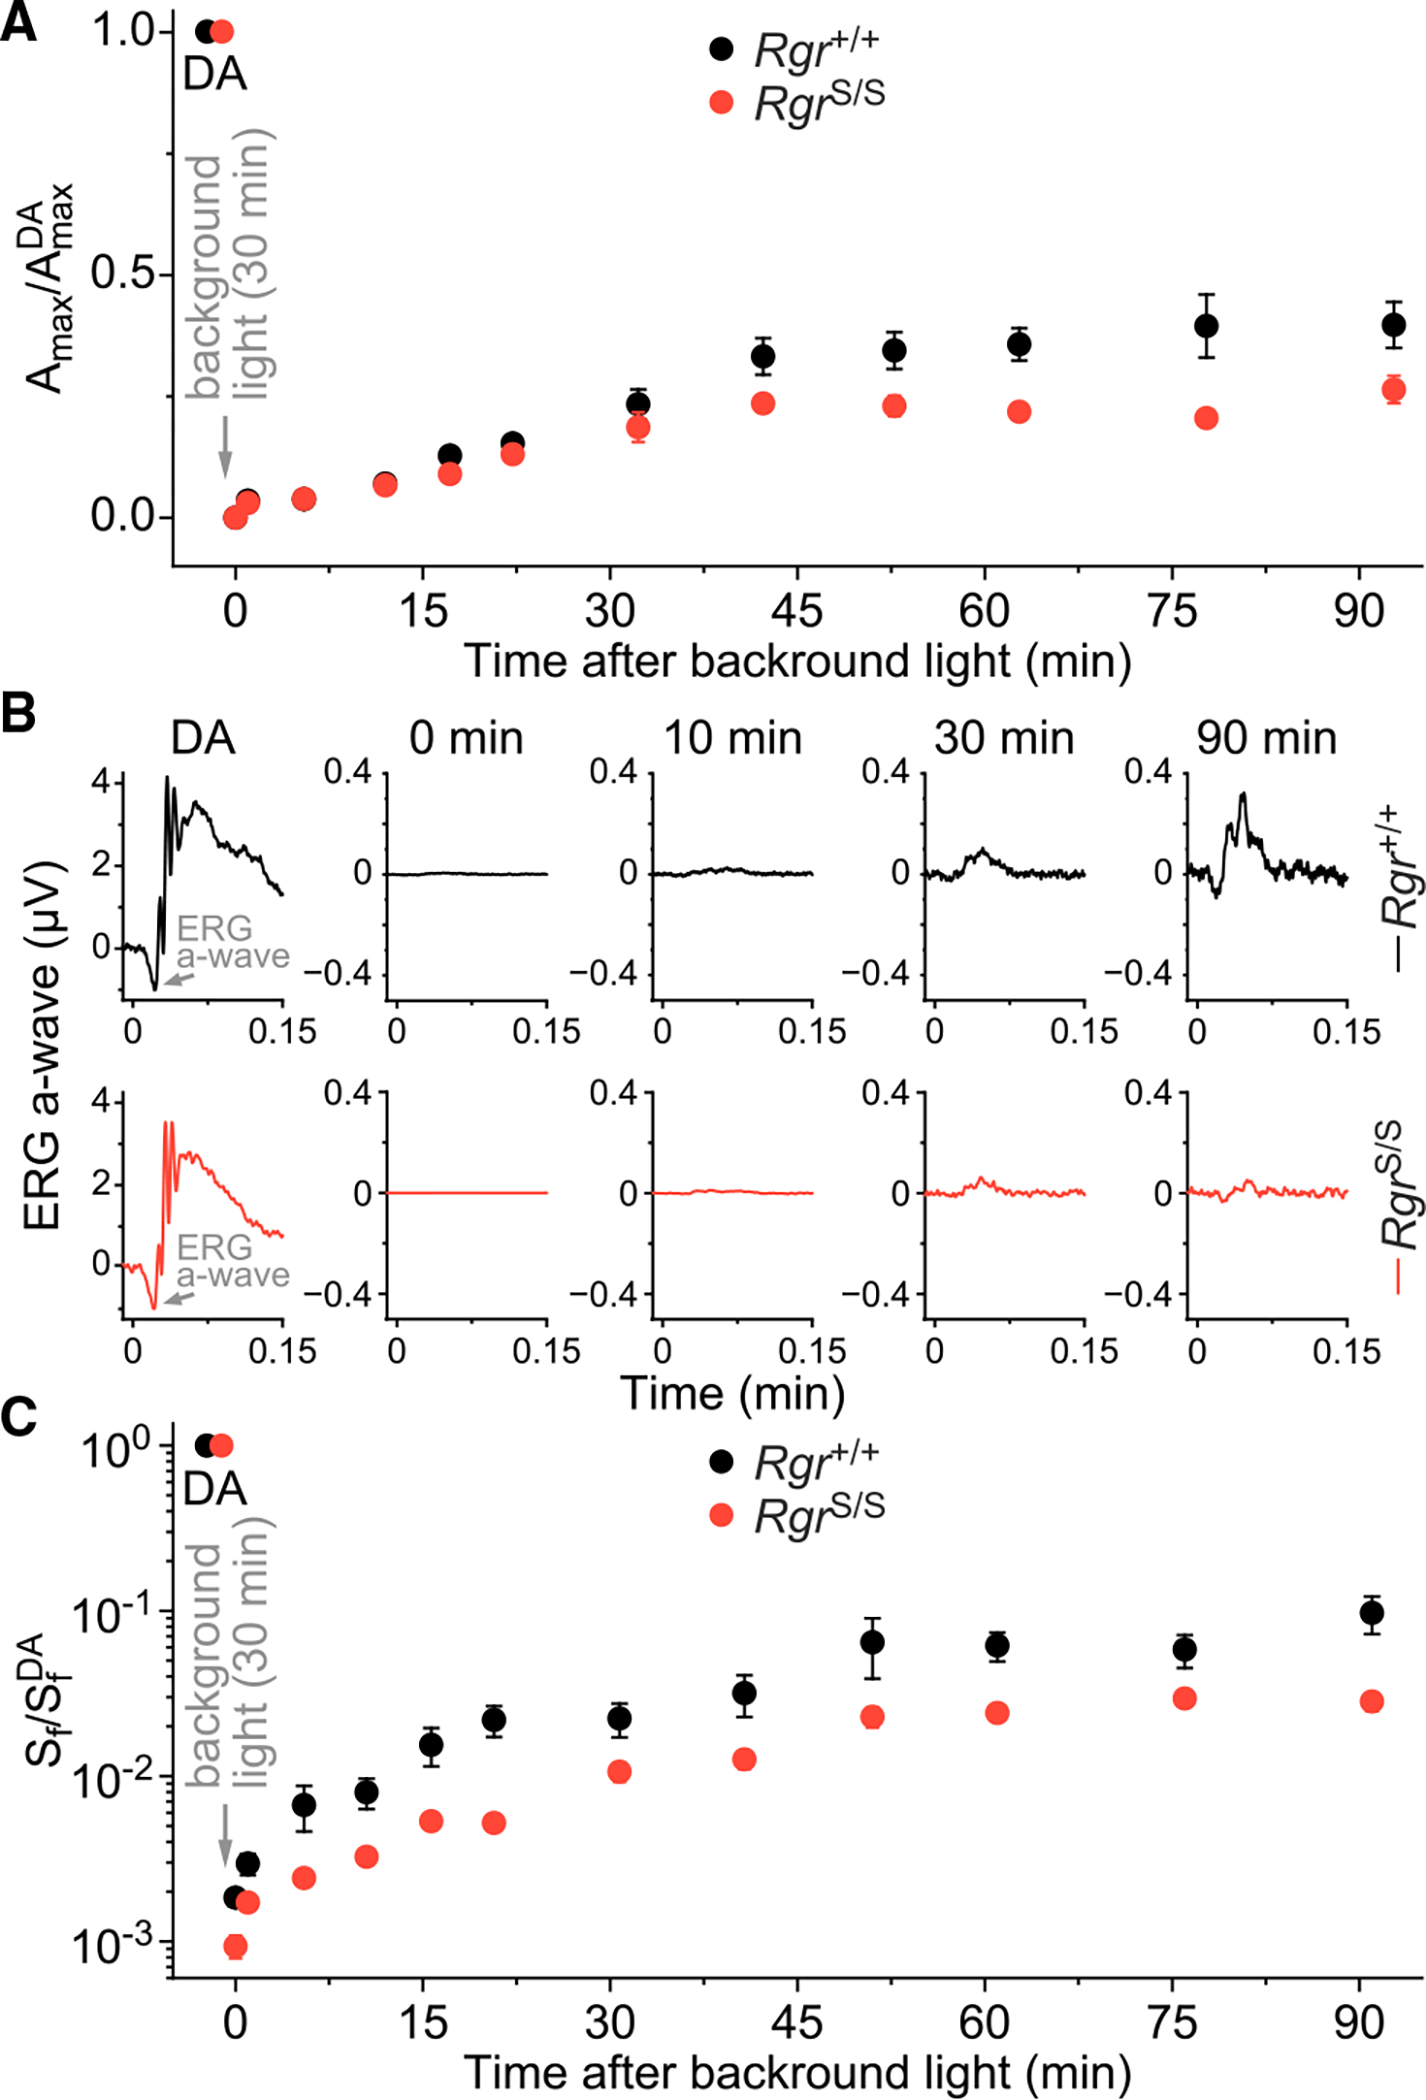
In daylight, demand for visual chromophore (11-cis-retinal) exceeds supply by the classical visual cycle. This shortfall is compensated, in part, by the retinal G-protein-coupled receptor (RGR) photoisomerase, which is expressed in both the retinal pigment epithelium (RPE) and in Müller cells. The relative contributions of these two cellular pools of RGR to the maintenance of photoreceptor light responses are not known. Here, we use a cell-specific gene reactivation approach to elucidate the kinetics of RGR-mediated recovery of photoreceptor responses following light exposure. Electroretinographic measurements in mice with RGR expression limited to either cell type reveal that the RPE and a specialized subset of Müller glia contribute both to scotopic and photopic function. We demonstrate that 11-cis-retinal formed through photoisomerization is rapidly hydrolyzed, consistent with its role in a rapid visual pigment regeneration process. Our study shows that RGR provides a pan-retinal sink for all-trans-retinal released under sustained light conditions and supports rapid chromophore regeneration through the photic visual cycle.

Keywords: 11-cis-retinal; CP: Cell biology; CP: Neuroscience; Müller cells; chromophore; cone opsin; photic visual cycle; photoisomerization; retina; retinal pigmented epithelium; vision; visual cycle.


Conflict of interest statement

Declaration of interests K.P. is a consultant to Polgenix, Inc. His relationship with Polgenix, Inc., has been reviewed and approved by the University of California, Irvine, in accordance with its conflict-of-interest policies.

Figures

Figure 1.
Figure 1.. RGR* hydrolysis facilitates rapid production of 11-cis-retinal in native microsomal membranes
(A) Scheme of RGR turnover of all-trans-retinal to 11-cis-retinal under light. (B) UV-vis absorbance spectra of purified bovine RGR regenerated with all-trans-retinal solubilized in LMNG, showing minor spectral changes after light exposure on ice. (C) Chromatographic separation and mass spectroscopic identification of Nε-retinyl-peptides of RGR, from proteinase K digestion of sodium borohydrate (NaBH4)/isopropanol (iPrOH)-treated RPE microsomes, before and after light exposure. Nε-retinyl-peptide products reflect all-trans-retinylidene Schiff base adducted to Lys256 of RGR. For detailed LC-MS/MS analyses, see Figure S1. (D) Pronase digestion of RPE microsomal fraction enables direct measurement of photoisomerization of the RGR all-trans-retinylidene adduct to the 11-cis configuration, followed by hydrolysis of the 11-cis-retinylidene Schiff base, accompanied by corresponding regeneration of the RGR over time by readduction of new all-trans-retinal. For detailed LC-MS/MS analyses, see Figure S2. (E) Retinoid analysis of lipid-soluble fraction shows reciprocal increase in 11-cis-retinal production with hydrolysis of RGR* 11-cis-retinylidene Schiff base over time. The slight excess of exogenous all-trans-retinal initially used to produce RGR photopigment in microsomal membranes began decreasing as RGR* hydrolysis freed Lys256 to form new all-trans-retinylidene Schiff base. (F) Time course of RGR*-11-cis-retinylidene Schiff base hydrolysis producing 11-cis-retinal. Pseudo-first-order kinetics were observed. Values are plotted as mean ± SD; n = 4 independent experiments. Red line indicates RHO* hydrolysis rate measured previously.
Figure 2.
Figure 2.. Subpopulation of Müller glia expresses RGR in mammals
(A) Cross-sectional diagram of retina indicating its major layers: RPE cells (RPEs), photoreceptor outer segments (OSs), photoreceptor inner segments (ISs), outer nuclear layer (ONL), inner nuclear layer (INL), and ganglion cell layer (GCL). Sites of RGR expression (RPEs and Müller glia) are highlighted in teal. Mammalian retinas contain two subpopulations of Müller glia, characterized by the presence (+) or the absence (−) of RGR. (B) Analysis of proportions of RGR+ and RGR− Müller glia in mouse (n = 1,395 cells), macaque (n = 14,674 cells), and human (n = 21,066 cells). In primates, foveal (F) and peripheral (P) retina samples were analyzed separately. (C) UMAP plot showing independent clustering of Müller glia from primate retinas, based on data from (B). The RGR expression status is indicated in color. (D) Violin plots showing the expression level of RGR in F and P Müller glia from macaque and human, based on data from (B). ****p < 0.0001 by Student’s t tests. (E) List of top 10 cellular component- and biological process-GO terms significantly enriched (adjusted p-value, [p-adj] < 0.01) in macaque DEGs (>1.25-fold change) between RGR+ and RGR− Müller glia. p-adj values were calculated using Benjamini-Hochberg method. (F) Heatmaps showing fold change of retina homeostasis- and visual perception-related DEGs significantly enriched in the dataset.
Figure 3.
Figure 3.. General characteristics of RgrS mice
(A) Generation of the conditional rescue of the Rgr mouse model. A stop cassette flanked by loxP sites was introduced into Rgr intron 1. The cassette can be removed by Cre recombinase. (B) Stop cassette integration sites amplified from the genomic DNA by PCR with primer pairs a/b and c/d (indicated in A) and verified by Sanger sequencing. (C) RGR level in protein extracts from retinal and RPE-eyecup preparations from Rgr+/+ and RgrS/S mice; immunoblotting confirmed successful knockout of RGR upon introduction of the stop cassette. GAPDH served as a loading control. Shown are images representative of n = 3 independent experiments. (D) SLO (left, scale bars: 500 μm) and retinal OCT (right, scale bars: 50 μm) images of 12-month-old Rgr+/+ and RgrS/S animals, showing no features that distinguish the two lines. (E) OCT-based quantification of ONL thickness in 1-, 3-, 6-, and 12-month-old Rgr+/+ and RgrS/S mice, measured 500 mm from the ONH; data are shown as mean ± SEM, n = 10 eyes (1, 3, and 6 months old), n = 8 eyes (12 months old). (F) H&E-stained retinal sections of 12-month-old Rgr+/+ and RgrS/S animals showing no signs of structural retinal pathology upon RGR loss. Images were taken approx. 500 μm from the ONH. Scale bars: 50 μm. (G) Number of nuclei per row quantified in histological sections along the superior-inferior axis of the eyes from 1-, 3-, 6-, and 12-month-old Rgr+/+ and RgrS/S mice. Data are shown as mean ± SEM; n = 3 eyes.
Figure 4.
Figure 4.. Absence of Rgr affects retinoid metabolism
(A) Immunoblots of LRAT, RPE65, CRALBP, STRA6, RDH5, RDH8, RDH10, and RDH12 in retinal and RPE-eyecup extracts from 2-month-old Rgr+/+ and RgrS/S animals. The bar graph below shows quantification of LRAT in Rgr+/+ and RgrS/S RPEs. Values are plotted as mean ± SEM; ***p < 0.001 by Student’s t test; n = 5 independent experiments. (B) All-trans-retinyl ester (atRE), 11-cis-retinal (11cRal), all-trans-retinal (atRal), and all-trans-retinol (atRol) profiling of 2-month-old Rgr+/+ and RgrS/S eyes: dark adapted or after 30 min or 1 h of 530-nm light exposure. Values are plotted as mean ± SEM; n = 5 mice (dark), n = 6 mice (30 min and 1 h light); ***p < 0.001, **p < 0.01 by Student’s t tests with Holm-Šídák correction. (C) Representative chromatograms recorded at 325-nm light showing differential accumulation of atRE between the Rgr+/+ and RgrS/S eyes. (D) Distribution of retinoids in the RPE of 2-month-old Rgr+/+ and RgrS/S mice. Two-photon-excited (740-nm) fluorescence intensity images and respective FLIM phasor plots (underneath) obtained for dark- and daylight-adapted eyes. Red circles in each phasor plot indicate location of the retinosome phasor points, and corresponding image pixels were pseudo-colored (red) in the intensity images. Scale bars: 25 μm. The bar graph shows quantification of the areas occupied by retinosomes in Rgr+/+ and RgrS/S RPEs. Values are plotted as mean ± SEM; **p < 0.01, *p < 0.05 by Student’s t tests with Holm-Šídák correction; n = 4 (light), n = 3 (dark) independent experiments.
Figure 5.
Figure 5.. Conditional gene rescue restores Rgr expression in the RPE and in Müller glia
(A) Genotypes of mouse lines developed to characterize the contribution of Rgr to cone visual function. Lines carrying Rpe65 and Glast promoter-driven tamoxifen-inducible Cre recombinase transgenes (CreERT2) were used to selectively restore expression of Rgr in the RPE or in Müller glia (MGs), respectively. Schematic heatmap (right) shows anticipated status of Rgr expression before and after the tamoxifen administration. (B) Experimental schedule for the tamoxifen treatment to induce Cre-mediated conditional rescue of Rgr. (C) SLO (left, scale bars: 500 μm) and retinal OCT (middle, scale bars: 50 μm) images of WT and KO eyes, at the time of structural and functional analysis (3 months), showing no features that distinguish the two lines carrying the Gnat1−/− background; OCT-based quantification of ONL thickness (panel at the right, data are shown as mean ± SEM, n = 10 eyes). (D) H&E-stained retinal sections of 3-month-old WT and KO animals, showing no signs of retinal structural pathology. Images were taken approx. 500 μm from the ONH. Scale bars: 50 μm. (E) IHC images of eye cryosections from WT, KO, RPE-Cre, MG-Cre, and 2-Cre animals (genotype details indicated in A) after tamoxifen treatment, stained tovisualize RGR, CRALBP, and nuclei (DAPI). For each mouse/treatment combination, the left column shows images combined for all 3 targets; the right column shows only RGR distribution. RGR, absent in the KO mouse line, is selectively restored in the RPEs of RPE-Cre mice, the MGs of MG-Cre mice, and both cell types of the 2-Cre mice. Low-magnification images (top row, scale bars: 100 μm) are presented in central (ONH, top)-to-peripheral (bottom) orientation and were cropped to visualize only retina and RPE. High-magnification images (bottom row, scale bars: 20 μm) were taken 250–500 μm from the ONH.
Figure 6.
Figure 6.. Loss of RGR compromises the sustained function of cones in steady background light and their dark adaptation in vivo
(A) Population-averaged (mean ± SEM) dim-flash M-cone-driven ERG b-wave responses to test stimuli of 0.24 cd s m−2 for dark-adapted WT (n = 10 eyes) and KO (n = 12 eyes) mice. WT and KO genotype details are indicated in Figure 5A. (B) Comparison of population-averaged (mean ± SEM) M-cone-driven ERG b-wave responses to a bright flash (700 cd s m−2) for WT and KO animals the same as in (A). (C) Cone-driven ERG b-wave flash sensitivity (Sf) following illumination with green 530-nm background light (300 cd m−2, 60 min), and its subsequent recovery in the dark in WT and KO mice either treated (+) or not treated (−) with tamoxifen. WT and KO genotype details are indicated in Figure 5A; WT −tamoxifen: n = 10 eyes, WT +tamoxifen: n = 14 eyes, KO −tamoxifen: n = 12 eyes, KO +tamoxifen: n = 14 eyes. Sf was normalized to the corresponding dark-adapted value (SfDA) in each case. The time course of light exposure is shown on the bottom. Data are expressed as mean ± SEM (error bars are often smaller than symbol size); significant differences were associated with time point (p < 0.0001) and genotype (p < 0.0001) but not with tamoxifen treatment; three-way repeated measures ANOVA (Table S1).
Figure 7.
Figure 7.. Rescue of RGR in RPE and/or Müller cells restores the sustained function of cones in background light and their dark adaptation in vivo
(A–C) Changes in M-cone-driven ERG b-wave Sf in vivo following illumination with green 530-nm background light (300 cd m−2, 60 min), and its subsequent recovery in the dark in RPE-Cre (A), MG-Cre (B), and 2-Cre (C) animals, either treated (+) or not treated (−) with tamoxifen. Genotype details are indicated in Figure 5A; respective numbers of mouse eyes tested (n) are indicated in Table S1. Sf was normalized to the corresponding SfDA in each case. The time course of light exposure is shown on the bottom. Data are presented as mean ± SEM (error bars are often smaller than symbol size); significant differences were associated with two factors: time point and mouse group; two-way repeated measures ANOVA (Table S1). (D) Comparison of relative rescue of cone function in steady background light and subsequent dark adaptation upon recovery of RGR expression in the RPEs and/or MGs. Responses for tamoxifen-treated RPE-Cre (n = 16 eyes), MG-Cre (n = 12 eyes), and 2-Cre (n = 12 eyes) mice are replotted from (A), (B), and (C), respectively. Dashed lines represent averaged data for WT and KO animals replotted from Figure 6C. All genotype details are indicated in Figure 5A. Significant differences were associated with two factors: time point (p < 0.0001) and mouse group (p < 0.01); two-way repeated measures ANOVA (Table S1). For time points indicated with gray shaded rectangles, representing the end of the background light illumination phase (−0.5 min) and the end of the dark adaptation phase (30.5 min), significant differences are indicated as follows: ***p < 0.001, **p < 0.01, *p < 0.05, Holm-Šídák post hoc test. (E) Dark adaptation portion of the data shown in (D), presented on an extended timescale and a linear Sf scale. (F) Comparison of M-cone dark adaptation in untreated WT (n = 10 eyes) and KO (n = 12 eyes) mice in vivo after extended exposure to bright light (closed symbols, replotted from Figure 6C) and after acute bleaching of >90% of the cone pigment at time 0 with 530-nm light (open symbols, n = 10 for both WT and KO). WT and KO genotype details are indicated in Figure 5A. SfDA designates the corresponding dark-adapted sensitivity in each case. Data are presented as mean ± SEM (error bars are often smaller than symbol size).
Figure 8.
Figure 8.. Absence of RGR suppresses rod dark adaptation in vivo
(A) Recovery of normalized scotopic ERG maximal a-wave amplitudes (Amax) in the dark, following illumination with green 530-nm background light (300 cd m−2, 30 min) bleaching >90% of rhodopsin, in control Rgr+/+ (Gnat1+/+, n = 12 eyes) and embryonic RGR KO RgrS/S (Gnat1+/+, n = 10 eyes) mice. AmaxDA designates the maximal response of dark-adapted rods. (B) Representative rod dim-flash responses in the dark and at four time points after illumination with the same bleaching light as described in (A) in Rgr+/+ (Gnat1+/+, top) and RgrS/S (Gnat1+/+, bottom) mice. For each time point, responses were divided by corresponding test flash intensities (in cd s m−2) and their prebleach dark-adapted maximal ERG a-wave amplitudes (in μV), followed by normalization to respective fractional Sf in darkness. (C) Recovery of normalized scotopic ERG a-wave Sf in darkness, following green light illumination, in Rgr+/+ (Gnat1+/+, n = 12 eyes) and RgrS/S (Gnat1+/+, n = 10 eyes) mice. Animals and experimental conditions were the same as in (A) and (B). SfDA designates the sensitivity of dark-adapted rods. Data in (A) and (C) are presented as mean ± SEM (error bars are often smaller than symbol size). Significant differences were associated with two factors: time point and genotype; two-way repeated measures ANOVA (Table S1).

Similar articles

Cited by

References

    1. Oroshnik W, Brown PK, Hubbard R, and Wald G (1956). Hindered cis isomers of vitamin A and retinene: the structure of the neo-b isomer. Proc. Natl. Acad. Sci. USA 42, 578–580. 10.1073/pnas.42.9.578. - DOI - PMC - PubMed
    1. Palczewski K, and Kiser PD (2020). Shedding new light on the generation of the visual chromophore. Proc. Natl. Acad. Sci. USA 117, 19629–19638. 10.1073/PNAS.2008211117. - DOI - PMC - PubMed
    1. Kiser PD, Golczak M, and Palczewski K (2014). Chemistry of the retinoid (visual) cycle. Chem. Rev. 114, 194–232. 10.1021/cr400107q. - DOI - PMC - PubMed
    1. Mata NL, Radu RA, Clemmons RC, and Travis GH (2002). Isomerization and oxidation of vitamin A in cone-dominant retinas: A novel pathway for visual-pigment regeneration in daylight. Neuron 36, 69–80. 10.1016/S0896-6273(02)00912-1. - DOI - PMC - PubMed
    1. Wang JS, and Kefalov VJ (2011). The Cone-specific visual cycle. Prog. Retin. Eye Res. 30, 115–128. 10.1016/j.preteyeres.2010.11.001. - DOI - PMC - PubMed

Publication types

MeSH terms