. 2023 Aug 31;97(8):e0059723.
doi: 10.1128/jvi.00597-23. Epub 2023 Aug 14.

A low-background, fluorescent assay to evaluate inhibitors of diverse viral proteases

Affiliations

A low-background, fluorescent assay to evaluate inhibitors of diverse viral proteases

Rebecca A Leonard et al. J Virol. .

Abstract

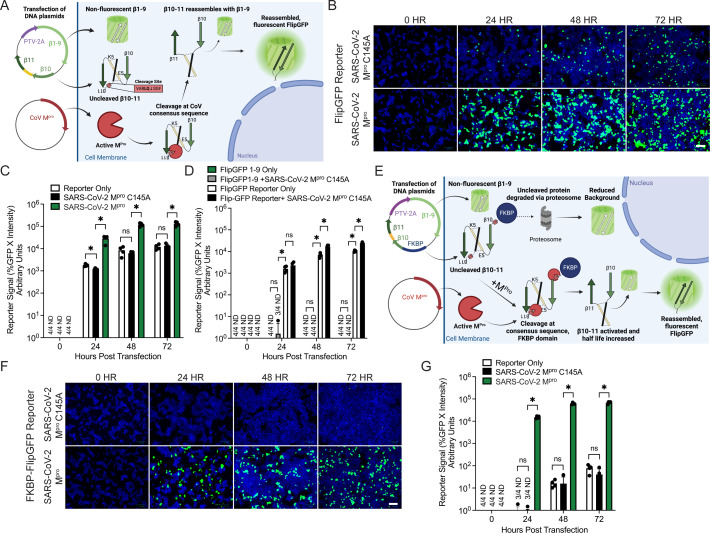
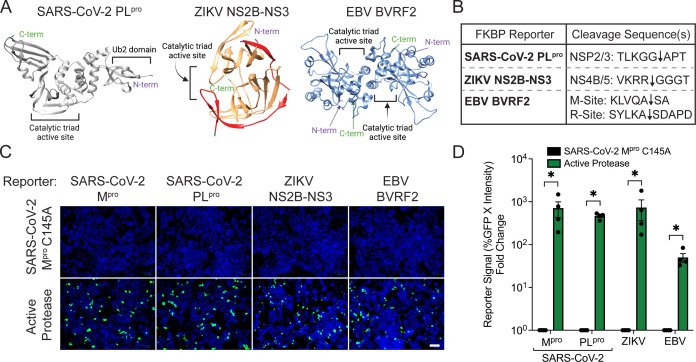
Multiple coronaviruses (CoVs) can cause respiratory diseases in humans. While prophylactic vaccines designed to prevent infection are available for severe acute respiratory syndrome coronavirus-2 (SARS-CoV-2), incomplete vaccine efficacy, vaccine hesitancy, and the threat of other pathogenic CoVs for which vaccines do not exist have highlighted the need for effective antiviral therapies. While antiviral compounds targeting the viral polymerase and protease are already in clinical use, their sensitivity to potential resistance mutations as well as their breadth against the full range of human and preemergent CoVs remain incompletely defined. To begin to fill that gap in knowledge, we report here the development of an improved, noninfectious, cell-based fluorescent assay with high sensitivity and low background that reports on the activity of viral proteases, which are key drug targets. We demonstrate that the assay is compatible with not only the SARS-CoV-2 Mpro protein but also orthologues from a range of human and nonhuman CoVs as well as clinically reported SARS-CoV-2 drug-resistant Mpro variants. We then use this assay to define the breadth of activity of two clinically used protease inhibitors, nirmatrelvir and ensitrelvir. Continued use of this assay will help define the strengths and limitations of current therapies and may also facilitate the development of next-generation protease inhibitors that are broadly active against both currently circulating and preemergent CoVs. IMPORTANCE Coronaviruses (CoVs) are important human pathogens with the ability to cause global pandemics. Working in concert with vaccines, antivirals specifically limit viral disease in people who are actively infected. Antiviral compounds that target CoV proteases are already in clinical use; their efficacy against variant proteases and preemergent zoonotic CoVs, however, remains incompletely defined. Here, we report an improved, noninfectious, and highly sensitive fluorescent method of defining the sensitivity of CoV proteases to small molecule inhibitors. We use this approach to assay the activity of current antiviral therapies against clinically reported SARS-CoV-2 protease mutants and a panel of highly diverse CoV proteases. Additionally, we show this system is adaptable to other structurally nonrelated viral proteases. In the future, this assay can be used to not only better define the strengths and limitations of current therapies but also help develop new, broadly acting inhibitors that more broadly target viral families.

Keywords: CoV Mpro; CoV PLpro; Epstein–Barr virus; FlipGFP; Zika virus; antivirals; coronaviruses.


Conflict of interest statement

Some authors have IP on viral protease reporter technology.

Figures

Fig 1
Fig 1
Generation and validation of a FKBP-FlipGFP reporter assay to report on CoV Mpro activity. (A) Diagram of the initial FlipGFP CoV reporter system with CoV-specific cleavage site: VARLQ↓SGF (24). (B) Images of 293T cells with visible fluorescence at 0, 24, 48, or 72 h post-transfection of the FlipGFP reporter with either a catalytically dead SARS-CoV-2 Mpro C145A mutant (top) or WT SARS-CoV-2 Mpro (bottom). Green, cleaved FlipGFP; blue, nuclei; scale bar = 100 µm. (C) Quantification of reporter signal in 293Ts from panel B. Reporter signal was calculated as the percentage of cells that were GFP+ multiplied by the average intensity of fluorescent signal. ND, value not detected. (D) Quantification of reporter signal in 293Ts either 0, 24, 48, or 72 h post-transfection of the FlipGFP reporter (containing β1–11) either alone or with SARS-CoV-2 Mpro C145A, or a plasmid expressing FlipGFP β1–9 either alone or with SARS-CoV-2 Mpro C145A. (E) Diagram of the FKBP-FlipGFP reporter assay. (F) Images of 293T cells 0, 24, 48, or 72 h post-transfection with the FKBP-FlipGFP reporter and either a catalytically dead SARS-CoV-2 Mpro C145A mutant (top) or WT SARS-CoV-2 Mpro (bottom). (G) Quantification of reporter signal in 293Ts from panel F. For all panels, data are shown as means with SDs from independent biological replicates of 4. P values were calculated using multiple Mann–Whitney U tests (*, P < 0.05; ns, not significant).
Fig 2
Fig 2
Application of FKBP-FlipGFP reporter system to report on diverse viral proteases. (A) Cartoon representation of SARS-CoV-2 PLpro (left, gray), ZIKV NS2B-NS3 (middle, NS3 in orange and NS2B in red), and the EBV BVRF2 dimer (right, light blue). The N-terminal and C-terminal ends of each protease are shown in purple or green, respectively. Catalytic active sites are indicated in black. (B) Representation of the viral cleavage site(s) inserted into each respective FKBP-FlipGFP reporter. Black arrows represent where cleavage occurs. (C) Images of 293T cells 32 h post-transfection of the respective reporter of each virus with either the SARS-CoV-2 Mpro C145A mutant or the active protease of each virus. Green, cleaved FKBP-FlipGFP; blue, nuclei; scale bar = 100 µm. (D) Quantification of 293T cells from panel C. For each reporter, the reporter signal fold change relative to SARS-CoV-2 Mpro C145A was calculated. For all panels, data are shown as means with SEMs from independent biological replicates of 4. P values were calculated using multiple Mann–Whitney U tests (*, P < 0.05; ns, not significant).
Fig 3
Fig 3
Activity of drug-resistant Mpro mutations can be investigated using the FKBP-FlipGFP CoV reporter. (A) Normalized quantification of reporter signal in 293T cells 24 h post-transfection with the reporter and SARS-CoV-2 Mpro, with 2 µM P-glycoprotein inhibitor, and indicated doses of nirmatrelvir. The average total cell count is shown in black at each concentration of drug. (B) Selected Mpro single- or double-point mutations from positions reported in Pfizer’s fact sheet for healthcare providers from the EPIC-HR clinical trial to be cloned into expression plasmids (67). (C) Cartoon representation of SARS-CoV-2 Mpro (gray) in complex with nirmatrelvir (red), with positions of amino acid mutations described in panel B shown in stick form (cyan). The C-terminal and N-terminal ends of each protease are shown in orange or blue, respectively. (D) Images of 293T cells 24 h post-transfection of reporter and indicated SARS-CoV-2 Mpro. Green, cleaved FKBP-FlipGFP; blue, nuclei; scale bar = 100 µM. (E) Normalized quantification of reporter signal in 293T cells 24 h post-transfection with the reporter and indicated SARS-CoV-2 Mpro, with 2 µM P-glycoprotein inhibitor, and either DMSO-vehicle or 2.5 µM nirmatrelvir. All samples normalized to DMSO-vehicle. (F) Normalized quantification of reporter signal in 293Ts treated with 2 µM P-glycoprotein inhibitor and varying concentrations of nirmatrelvir and transfected with reporter and the indicated SARS-CoV-2 Mpro (WT, green; W207L, orange; S144A, purple; E166V + L50F, blue). The average total cell count is shown on the right axis at each concentration of drug. For all panels, data are shown as means with SEMs from independent biological replicates of 4. P values were calculated using multiple Mann–Whitney U tests (*, P < 0.05; ns, not significant).
Fig 4
Fig 4
Inhibition profile of diverse CoV Mpro proteases by nirmatrelvir and ensitrelvir can be assessed using the FKBP-FlipGFP reporter. (A) Phylogenetic tree of eighteen beta-, alpha-, delta-, and gammacoronavirus Mpro sequences. Bootstrap values are listed at each node, and percentage of amino acid similarity is shown to the right of the virus strain name along with cartoon of the predominant host species. (B) Alignment showing sequence identity (black) and similarity (gray) of CoV Mpro cleavage sites with logo plots below showing consensus at each site (Nsp4/5 left, Nsp5/6 right). The logo plot of both Nsp4/5 and Nsp5/6 sites combined (far right) compared to the reporter sequence with highly conserved residues boxed in red. (C) Images of visible fluorescent reporter signal in 293Ts 24 h post-transfection with reporter and the indicated CoV Mpro. Green, cleaved FKBP-FlipGFP; blue, nuclei; scale bar = 100 µm. (D) Quantification of reporter signal in 293T cells shown in panel C. (E) Normalized reporter signal in 293T cells treated with 2 µM P-glycoprotein inhibitor and 10 µM nirmatrelvir, 24 h post-transfection with reporter and the indicated CoV Mpro. Values normalized to DMSO-vehicle. (F) Normalized reporter signal in 293T cells treated with 2 µM P-glycoprotein inhibitor and 10 µM ensitrelvir, 24 h post-transfection with reporter and the indicated CoV Mpro. Values normalized to DMSO-vehicle. (G to I) Normalized reporter signal in 293T cells 24 h post-transfection with reporter and the indicated CoV Mpro, treated with varying concentrations of nirmatrelvir (solid line) or ensitrelvir (dashed line). (G) Transfection of reporter with WT SARS-CoV-2 (green) or HKU9 (blue) Mpro. (H) Transfection of reporter with WT SARS-CoV-2 (green) or HKU8 (purple) Mpro. (I) Transfection of reporter with WT SARS-CoV-2 (green) or HKU19 (orange) Mpro. For all panels, data are shown as means with SEMs from independent biological replicates of 4. P values were calculated using multiple Mann–Whitney U tests (*, P < 0.05; ns, not significant).

Similar articles

References

    1. Kozlakidis Z. 2022. Evidence for recombination as an evolutionary mechanism in coronaviruses: Is SARS-CoV-2 an exception?. Front Public Health 10:859900. doi:10.3389/fpubh.2022.859900 - DOI - PMC - PubMed
    1. Dong E, Du H, Gardner L. 2020. An interactive web-based dashboard to track COVID-19 in real time. Lancet Infect Dis 20:533–534. doi:10.1016/S1473-3099(20)30120-1 - DOI - PMC - PubMed
    1. de Wit E, van Doremalen N, Falzarano D, Munster VJ. 2016. SARS and MERS: recent insights into emerging coronaviruses. Nat Rev Microbiol 14:523–534. doi:10.1038/nrmicro.2016.81 - DOI - PMC - PubMed
    1. Chafekar A, Fielding BC. 2018. MERS-CoV: understanding the latest human coronavirus threat. Viruses 10:93. doi:10.3390/v10020093 - DOI - PMC - PubMed
    1. Iketani S, Liu L, Guo Y, Liu L, Chan J-W, Huang Y, Wang M, Luo Y, Yu J, Chu H, Chik K-H, Yuen T-T, Yin MT, Sobieszczyk ME, Huang Y, Yuen K-Y, Wang HH, Sheng Z, Ho DD. 2022. Antibody evasion properties of SARS-CoV-2 Omicron sublineages. Nature 604:553–556. doi:10.1038/s41586-022-04594-4 - DOI - PMC - PubMed

Publication types

LinkOut - more resources