. 2023 Aug 5;24(15):12457.
doi: 10.3390/ijms241512457.

Amniotic Membrane-Derived Stromal Cells Release Extracellular Vesicles That Favor Regeneration of Dystrophic Skeletal Muscles

Affiliations

Amniotic Membrane-Derived Stromal Cells Release Extracellular Vesicles That Favor Regeneration of Dystrophic Skeletal Muscles

Martina Sandonà et al. Int J Mol Sci. .

Abstract

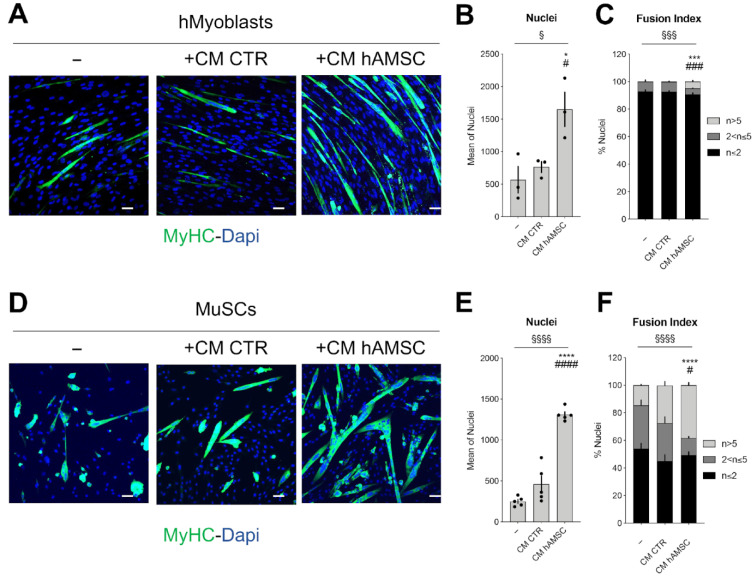
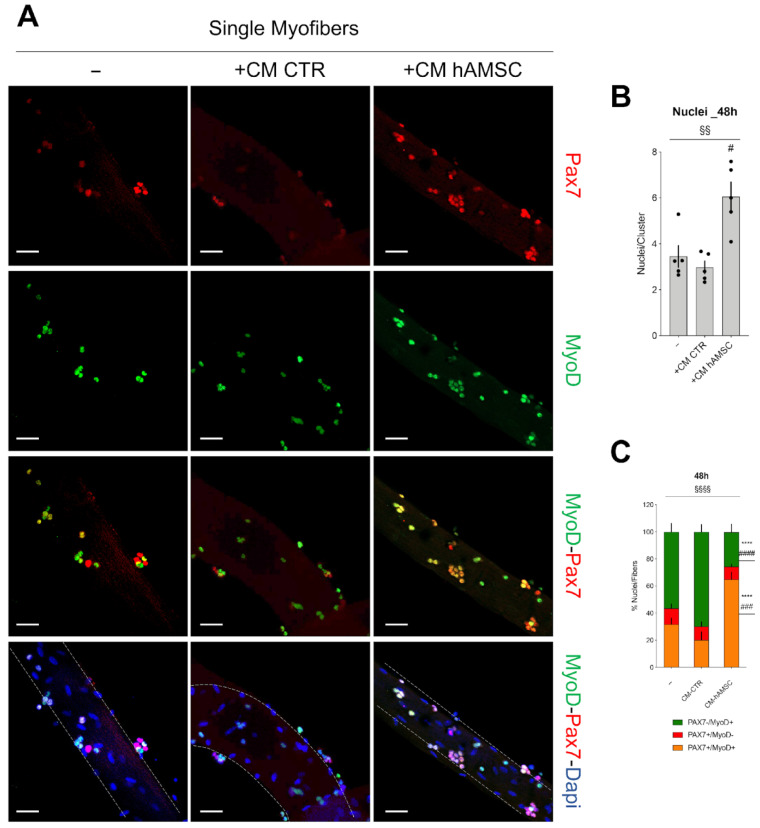
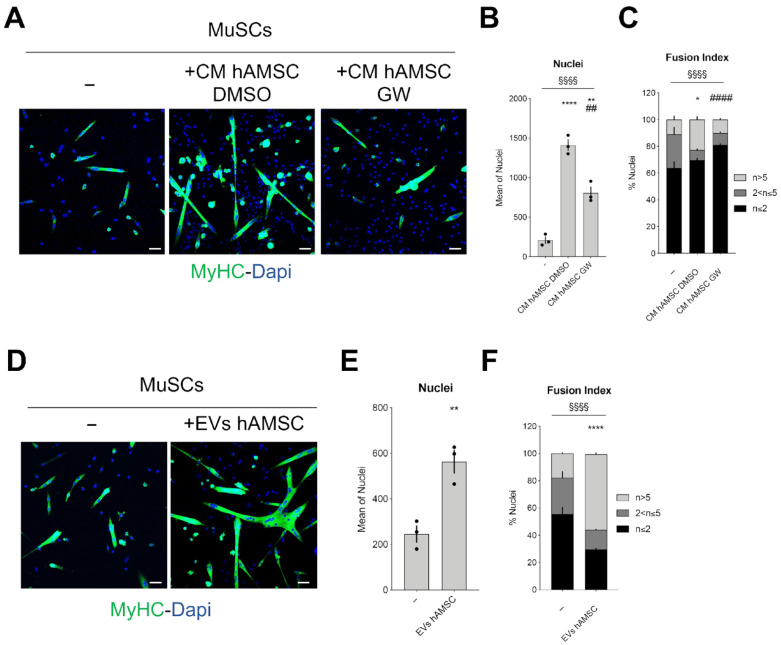
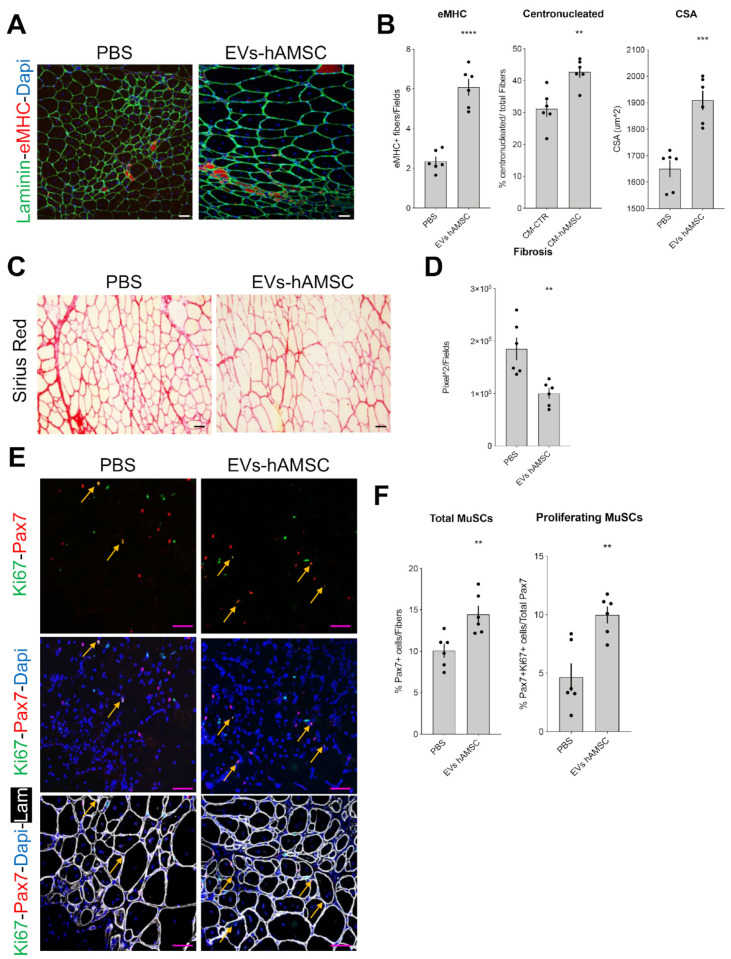
Duchenne muscular dystrophy (DMD) is a muscle disease caused by mutations in the dystrophin gene characterized by myofiber fragility and progressive muscle degeneration. The genetic defect results in a reduced number of self-renewing muscle stem cells (MuSCs) and an impairment of their activation and differentiation, which lead to the exhaustion of skeletal muscle regeneration potential and muscle replacement by fibrotic and fatty tissue. In this study, we focused on an unexplored strategy to improve MuSC function and to preserve their niche based on the regenerative properties of mesenchymal stromal cells from the amniotic membrane (hAMSCs), that are multipotent cells recognized to have a role in tissue repair in different disease models. We demonstrate that the hAMSC secretome (CM hAMSC) and extracellular vesicles (EVs) isolated thereof directly stimulate the in vitro proliferation and differentiation of human myoblasts and mouse MuSC from dystrophic muscles. Furthermore, we demonstrate that hAMSC secreted factors modulate the muscle stem cell niche in dystrophic-mdx-mice. Interestingly, local injection of EV hAMSC in mdx muscles correlated with an increase in the number of activated Pax7+/Ki67+ MuSCs and in new fiber formation. EV hAMSCs also significantly reduced muscle collagen deposition, thus counteracting fibrosis and MuSCs exhaustion, two hallmarks of DMD. Herein for the first time we demonstrate that CM hAMSC and EVs derived thereof promote muscle regeneration by supporting proliferation and differentiation of resident muscle stem cells. These results pave the way for the development of a novel treatment to counteract DMD progression by reducing fibrosis and enhancing myogenesis in dystrophic muscles.

Keywords: Duchenne muscular dystrophy; amnion; extracellular vesicles; mesenchymal stem/stromal cells; skeletal muscle regeneration.


Conflict of interest statement

The authors declare no conflict of interest.

Figures

Figure 1
Figure 1
CM hAMSC improves the proliferation and differentiation in dystrophic human myoblasts and in dystrophic MuSCs. (A) Representative images showing the myogenic differentiation of dystrophic human myoblasts cultured either alone (−) or with CM hAMSC (+CM hAMSC) or CM CTR (+CM CTR). Myogenic differentiation was assessed by immunostaining for MyHC (green). Nuclei were counterstained with DAPI (blue); Scale bar = 50 µm. (B) Graph showing the mean nuclei number in the condition described in (A) (n = 3, biological replicates). (C) Graph showing the fusion index of human myoblasts in the condition described in (A) (n = 3, biological replicates). (D) Representative images showing the myogenic differentiation of dystrophic MuSCs cultured either alone (−) or with CM hAMSC (+CM hAMSC) or CM CTR (+CM CTR). Myogenic differentiation was assessed by immunostaining for MyHC (green). Nuclei were counterstained with DAPI (blue); Scale bar = 50 µm. (E) Graph showing the mean nuclei number in the condition described in (D) (n = 5, biological replicates). (F) Graph showing the fusion index of dystrophic MuSCs cultured in the conditions described in (D) (n = 5, biological replicates). All data correspond to the average ± SEM. § Means statistical analysis by one-way or two-way ANOVA test; § p < 0.05, §§§ p < 0.001, §§§§ p < 0.0001. Star (*) indicates statistical analysis by Tukey’s test relative to human myoblast or MuSCs cultured alone (−); * p < 0.05, *** p < 0.001, **** p < 0.0001. Hashtag (#) means statistical analysis by Tukey’s test relative to human myoblast or MuSCs cultured CM CTR; # p < 0.05, ### p < 0.001, #### p < 0.0001.
Figure 2
Figure 2
CM hAMSC improves MuSCs activation and proliferation. (A) Representative images of myofibers cultured for 48 h alone (−) or with CM hAMSC (+CM hAMSC) or CM CTR (+CM CTR). Myofibers were stained with anti-Pax7 (Red) and anti-MyoD (Green). Nuclei were counterstained with DAPI (blue). Scale bar = 50 µm. (B) The graph shows the average nuclei present under the fiber-niche (cluster) in the condition described in (A). (n = 5, biological replicates). (C) The graph shows the percentage of nuclei present under the fiber-niche (cluster) that are positive for PAX7 (Pax7+/MyoD−), for MyoD (PAX7−/MyoD+), or both (PAX7+/MyoD+) in the condition described in (A), (n = 5, biological replicates). All data correspond to the average ± SEM. § Means statistical analysis by one-way and two-way ANOVA test; §§ p < 0.01; §§§§ p < 0.0001. Star (*) indicates statistical analysis by Tukey’s test relative to myofibers cultured alone (−); **** p < 0.0001. Hashtag (#) means statistical analysis by Tukey’s test relative to myofibers cultured with CM CTR; # p < 0.05; ### p < 0.001; #### p < 0.0001.
Figure 3
Figure 3
EVs hAMSC are responsible for the beneficial effects exerted by CM hAMSC on MuSC differentiation. (A) Representative images showing the myogenic differentiation of dystrophic MuSCs cultured either alone (−) or with CM hAMSC exposed to DMSO or GW4869 (+CM hAMSC DMSO; +CM hAMSC GW). Myogenic differentiation was assessed by immunostaining for MyHC (green). Nuclei were counterstained with DAPI (blue); Scale bar = 50 µm. (B) Graph showing the mean nuclei number in the condition described in (A) (n = 3, biological replicates). (C) Graph showing the fusion index of dystrophic MuSCs cultured in the conditions in (A) (n = 3, biological replicates). All data in (B,C) correspond to the average ± SEM. § Means statistical analysis by two-way ANOVA test; §§§§ p < 0.0001. Asterisk (*) indicates statistical analysis by Tukey’s test relative to MuSCs cultured alone (−); * p < 0.05; ** p < 0.01; **** p < 0.0001. Hash (#) indicates statistical analysis by Tukey’s test relative to MuSCs cultured with CM hAMSC DMSO; ## p < 0.01; #### p < 0.0001. (D) Representative images showing the myogenic differentiation of dystrophic MuSCs cultured either alone (−) or with the EVs isolated from the conditioned media of hAMSC (+EV hAMSC). Myogenic differentiation was assessed by immunostaining for MyHC (green). Nuclei were counterstained with DAPI (blue); Scale bar = 50 µm. (E) Graph showing the mean nuclei number in the condition described before. (n= 3, biological replicates). All data correspond to the average ± SEM. Star (*) indicates statistical analysis by unpaired t-test; ** p < 0.01. (F) Graph showing the fusion index of dystrophic MuSCs cultured in the conditions described before (n = 3, biological replicates). All data correspond to the average ± SEM. § Means statistical analysis by two-way ANOVA test; §§§§ p < 0.0001. Asterisk (*) indicates statistical analysis by Tukey’s test relative to MuSCs cultured alone (−); **** p < 0.0001.
Figure 4
Figure 4
EVs hAMSC counteract dystrophic muscle degeneration and improve regeneration by reducing fibrosis and expanding MuSCs. (AF) Stainings and relative measurements on tibialis anterior muscle transversal sections of 1.5-month-old mdx mice treated once a week for 21 days with intramuscular injections (tibialis anterior) of PBS (PBS), or EVs derived from conditioned media of hAMSC (EVs hAMSC). (n = 6, biological replicates). Asterisk (*) indicates statistical analysis by unpaired t-test; ** p < 0.01, *** p < 0.001, **** p < 0.0001. Nuclei were counterstained with DAPI (blue). All data correspond to the average ± SEM. (A) Representative images of immunofluorescence for embryonic myosin heavy chain (eMyHC—red) and laminin (laminin—cyan) stainings. Scale bar = 50 µm. (B) The graph on the left shows the quantification of muscle regeneration (eMyHC); the graph in the middle shows the percentage of centrally nucleated fibers and the graph on the right shows the quantification of cross-sectional area (CSA). (C) Representative images of Sirius red staining. Scale bar = 50 µm. (D) Graph showing the quantifications of fibrotic area. (E) Representative images of Pax7 (Red), Ki67 (Green), and laminin (Lam-White) stainings. Arrows indicate single and double positive cells for Pax7, Ki67. Scale bar = 50 µm. (F) The graph on the left panel shows the quantifications total MuSCs considering the percentage of Pax7-positive cells relative to the number of the fibers. The graph on the right shows the quantifications of proliferating MuSCs, considering the percentage of Pax7+Ki67+ cells with respect of the total amount of Pax7+ cells.

Similar articles

References

    1. Giampà C., Alvino A., Magatti M., Silini A.R., Cardinale A., Paldino E., Fusco F.R., Parolini O. Conditioned medium from amniotic cells protects striatal degeneration and ameliorates motor deficits in the R6/2 mouse model of Huntington’s disease. J. Cell Mol. Med. 2019;23:1581–1592. doi: 10.1111/jcmm.14113. - DOI - PMC - PubMed
    1. Phinney D.G., Prockop D.J. Concise Review: Mesenchymal Stem/Multipotent Stromal Cells: The State of Transdifferentiation and Modes of Tissue Repair—Current Views. Stem Cells. 2007;25:2896–2902. doi: 10.1634/stemcells.2007-0637. - DOI - PubMed
    1. DiMarino A.M., Caplan A.I., Bonfield T.L. Mesenchymal Stem Cells in Tissue Repair. Front. Immunol. 2013;4:201. doi: 10.3389/fimmu.2013.00201. - DOI - PMC - PubMed
    1. Pittenger M.F., Discher D.E., Péault B.M., Phinney D.G., Hare J.M., Caplan A.I. Mesenchymal stem cell perspective: Cell biology to clinical progress. NPJ Regen. Med. 2019;4:22. doi: 10.1038/s41536-019-0083-6. - DOI - PMC - PubMed
    1. Ratajczak M.Z., Kucia M., Jadczyk T., Greco N.J., Wojakowski W., Tendera M., Ratajczak J. Pivotal role of paracrine effects in stem cell therapies in regenerative medicine: Can we translate stem cell-secreted paracrine factors and microvesicles into better therapeutic strategies? Leukemia. 2021;26:1166–1173. doi: 10.1038/leu.2011.389. - DOI - PubMed

LinkOut - more resources