. 2023 Aug 2;24(15):12335.
doi: 10.3390/ijms241512335.

Cholesterol-Depletion-Induced Membrane Repair Carries a Raft Conformer of P-Glycoprotein to the Cell Surface, Indicating Enhanced Cholesterol Trafficking in MDR Cells, Which Makes Them Resistant to Cholesterol Modifications

Affiliations

Cholesterol-Depletion-Induced Membrane Repair Carries a Raft Conformer of P-Glycoprotein to the Cell Surface, Indicating Enhanced Cholesterol Trafficking in MDR Cells, Which Makes Them Resistant to Cholesterol Modifications

Zsuzsanna Gutay-Tóth et al. Int J Mol Sci. .

Abstract

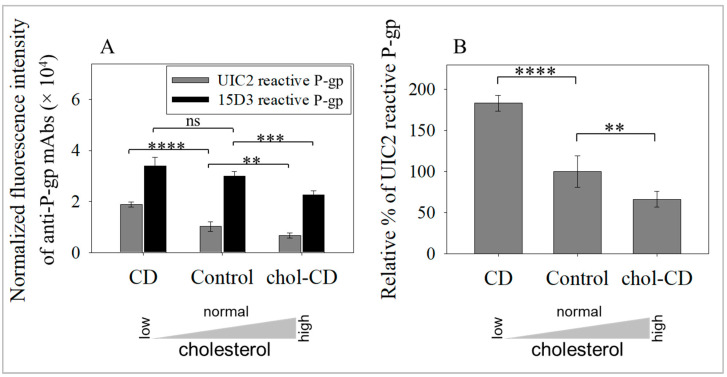
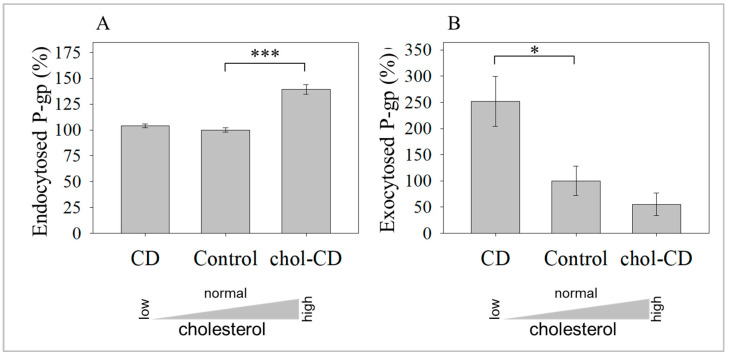
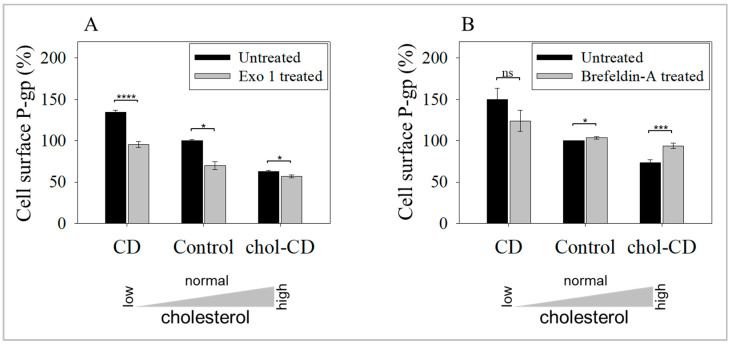
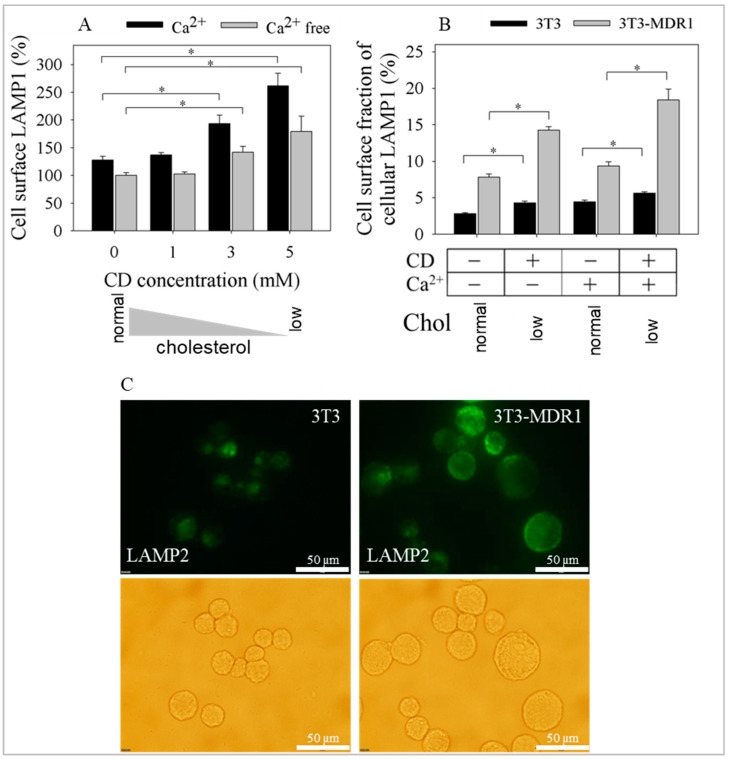
The human P-glycoprotein (P-gp), a transporter responsible for multidrug resistance, is present in the plasma membrane's raft and non-raft domains. One specific conformation of P-gp that binds to the monoclonal antibody UIC2 is primarily associated with raft domains and displays heightened internalization in cells overexpressing P-gp, such as in NIH-3T3 MDR1 cells. Our primary objective was to investigate whether the trafficking of this particular P-gp conformer is dependent on cholesterol levels. Surprisingly, depleting cholesterol using cyclodextrin resulted in an unexpected increase in the proportion of raft-associated P-gp within the cell membrane, as determined by UIC2-reactive P-gp. This increase appears to be a compensatory response to cholesterol loss from the plasma membrane, whereby cholesterol-rich raft micro-domains are delivered to the cell surface through an augmented exocytosis process. Furthermore, this exocytotic event is found to be part of a complex trafficking mechanism involving lysosomal exocytosis, which contributes to membrane repair after cholesterol reduction induced by cyclodextrin treatment. Notably, cells overexpressing P-gp demonstrated higher total cellular cholesterol levels, an increased abundance of stable lysosomes, and more effective membrane repair following cholesterol modifications. These modifications encompassed exocytotic events that involved the transport of P-gp-carrying rafts. Importantly, the enhanced membrane repair capability resulted in a durable phenotype for MDR1 expressing cells, as evidenced by significantly improved viabilities of multidrug-resistant Pgp-overexpressing immortal NIH-3T3 MDR1 and MDCK-MDR1 cells compared to their parents when subjected to cholesterol alterations.

Keywords: ABCB1 transporter; UIC2; cyclodextrin; membrane repair; raft; trafficking.


Conflict of interest statement

The authors declare no conflict of interest.

Figures

Figure 1
Figure 1
Cell surface levels of the raft-associated UIC2 binding conformer of P-gp increased after cholesterol extraction. (A) Effects of modifying cholesterol levels on the binding of the UIC2 and 15D3 mAbs expressed as normalized fluorescence intensities in 3T3-MDR1 cells. Bars represent the mean ± SD values of three-five independent experiments. (**** p < 0.0001, *** p = 0.0069, ** p = 0.01, by unpaired, one-tail t-test, ns: non-significant). (B) Relative cell surface levels of UIC2 reactive P-gp as a percentage of control samples. Bars represent the mean ± SD values of three-five independent experiments. (**** p < 0.0001 and ** p = 0.01 by unpaired, one-tail t-test.).
Figure 2
Figure 2
Effect of cholesterol modulations on trafficking of UIC2 reactive P-gp. Effect of treatment with CD or chol-CD on endocytosis (A) and exocytosis (B) of UIC2 binding P-gp 15 min after treatment of 3T3-MDR1 cells. The results are expressed as a percentage of control. Bars represent the mean ± SD values of three independent experiments. (*** p = 0.0001 and * p = 0.04 by unpaired, one-tail t-test).
Figure 3
Figure 3
Effect of inhibition of exocytosis on cell surface levels of UIC2 binding P-gp. (A) Exo1 decreased cell surface P-gp in all cases (**** p < 0.0001 and * p = 0.01 by unpaired, one-tail t-test). (B) BFA only slightly decreased cell surface P-gp in CD-treated samples. Bars represent mean ± SEM values of three independent experiments expressed as a percent of control. (*** p = 0.001, * p = 0.0379 by unpaired, one-tail t-test, ns: non-significant).
Figure 4
Figure 4
Effect of cholesterol depletion on lysosomal exocytosis. Effect of cholesterol depletion and extracellular calcium on the expression of LAMP1 and LAMP2 proteins on NIH-3T3 and 3T3-MDR1 cell surfaces. (A) LAMP1 increased concentration dependent on CD treatment in 3T3-MDR1 cells in the presence or absence of EC Ca2+. Bars represent the mean ± SD of three experiments expressed as the percentage of the CD-untreated Ca2+-free control sample. A one-way ANOVA was performed with Tukey–Kramer post hoc test to compare the effect of the increasing CD concentrations on the cell surface LAMP1. Asterix represents significant changes (* p < 0.05) compared to the 100% LAMP1 expression level. (B) Proportion of LAMP1 protein on the cell membrane of 3T3-MDR1 cells compared to the proportion of parental NIH-3T3 cells for 20 min 5 mM CD treatment (low). Bars represent the mean ± SEM values of LAMP1 protein on the cell surface from at least three experiments displayed as a percentage of the total LAMP1 protein level. A one-way ANOVA was performed with Tukey’s HSD Test for multiple comparisons to compare the effect of the cholesterol depletion on the cell surface fraction of the cellular LAMP1. Asterix represents significant changes at p = 0.05 compared to the normal LAMP1 expression levels in the absence and the presence of calcium, respectively. (C) Photomicrographs of NIH-3T3 and 3T3-MDR1 cells following cholesterol depletion. Fluorescence intensities were only slightly higher than background signals in NIH-3T3 cells. The upper panels are fluorescence images of the 5 mM CD-treated samples of NIH-3T3 and 3T3-MDR1 cells in the presence of EC Ca2+. The lower panels are bright-field images of the same cells. The scale bar represents 50 μm.
Figure 5
Figure 5
3T3-MDR1 cells have more stable lysosomes than parental NIH-3T3 cells. The blue-light-induced photo-destruction of acridine orange (AO) was investigated using laser-scanning cytometry. (A) AO accumulating in the lysosomes shows red fluorescence as crowded molecules are stacked at high concentrations. AO is green at lower concentrations, where molecules are monomeric (upper (A): before illumination; lower (A): after illumination). On the left side of (A), white lines across the cells indicate the location of the red–green intensity profile plotted on the right side. During the illumination, AO damages lysosomal membranes, and the dye molecules are released from the acidic lysosomal milieu, decreasing red and increasing green fluorescence. (B) Green intensity changes from a representative experiment. The time required to reach half-maximum fluorescence of the green fluorescence intensity in 3T3-MDR1 cells (410 ± 180 s) was significantly longer than in NIH-3T3 cells (300 ± 140 s) calculated from five separate experiments (p < 0.05 by unpaired, one-tail t-test).
Figure 6
Figure 6
Effect of cholesterol modulation on the stability of lysosomes. The stability of lysosomal membranes was determined by acridine orange (AO) photo-destruction in NIH-3T3 and 3T3-MDR1 cells. (A,B) indicate the frequency of lysosome ruptures per cell with time in NIH-3T3 ((A) CD 29 s; Control 46 s; chol-CD 60 s) and 3T3-MDR1 cells ((B) CD-40 s; Control-65 s; chol-CD-79 s). Representative curves for 3 mM cyclodextrin-treated cells are shown. A higher dose of 5 mM CD treatment destroyed lysosomes before irradiation in NIH-3T3 cells, probably by the ambient light (Supplementary Videos S1 and S2). (C,D) Dual wavelength monitoring of the rupture of lysosomes in NIH-3T3 (C) and 3T3-MDR1 (D) cells with increasing concentrations of CD. Red and green steady-state AO fluorescence was determined using a plate reader, avoiding intense blue light exposure. Values represent mean ± SEM values from four experiments.
Figure 7
Figure 7
Cell viability and cholesterol content of NIH-3T3 and 3T3-MDR1 cells. Cell viability (A) and free cholesterol concentrations (B) in NIH-3T3 and 3T3-MDR1 cell populations with various concentrations of CD and chol-CD. (A) Cholesterol perturbation of the PM decreased the viability of parental NIH-3T3 cells more than that of MDR1 cells, comparing the 5 mM CD and 5 mM chol-CD samples (p = 0.0086 and p = 0.0020 by unpaired, one-tail t-test). Values represent the mean of three independent experiments with 95% confidence intervals. (Curve fitting of individual raw data is exemplified in Figure S4). Statistical analysis was performed to compare primary data of 5 mM CD, 5 mM chol-CD, and control samples (0 mM CD) in both cell lines. Results for pairwise comparisons are the following: 3T3 CD versus Control: p = 0.0007; 3T3 Control versus chol-CD p = 0.0020; 3T3-MDR1 CD versus Control p = 0.0260; 3T3-MDR1 Control versus chol-CD p = 0.0104 by paired, one-tail t-test. (B) MDR1 cells contain significantly more cholesterol than parental NIH-3T3 cells p < 0.0001 by unpaired, one-tail t-test. Free cholesterol was measured using filipin in flow cytometry. Values represent mean ± SEM of three independent experiments. Statistical analysis was performed between the 5 mM CD and 5 mM chol-CD samples and control samples (0 mM) in both cell lines. 3T3 CD—Control p = 0.0132; 3T3 Control—chol-CD p < 0.0001; 3T3-MDR1 CD—Control p = 0.0033; 3T3-MDR1 Control—chol-CD p < 0.0001 by unpaired, one-tail t-test.

Similar articles

Cited by

References

    1. Das A., Brown M.S., Anderson D.D., Goldstein J.L., Radhakrishnan A. Three pools of plasma membrane cholesterol and their relation to cholesterol homeostasis. eLife. 2014;3:e02882. doi: 10.7554/eLife.02882. - DOI - PMC - PubMed
    1. Endapally S., Frias D., Grzemska M., Gay A., Tomchick D.R., Radhakrishnan A. Molecular Discrimination between Two Conformations of Sphingomyelin in Plasma Membranes. Cell. 2019;176:1040–1053.e17. doi: 10.1016/j.cell.2018.12.042. - DOI - PMC - PubMed
    1. Cho W., Ralko A., Sharma A. An In Situ Fluorescence Assay for Cholesterol Transporter Activity of the Patched. Methods Mol. Biol. 2022;2374:37–47. - PubMed
    1. Liu S.L., Sheng R., Jung J.H., Wang L., Stec E., O’Connor M.J., Song S., Bikkavilli R.K., Winn R.A., Lee D., et al. Orthogonal lipid sensors identify transbilayer asymmetry of plasma membrane cholesterol. Nat. Chem. Biol. 2017;13:268–274. doi: 10.1038/nchembio.2268. - DOI - PMC - PubMed
    1. Ogasawara F., Kano F., Murata M., Kimura Y., Kioka N., Ueda K. Changes in the asymmetric distribution of cholesterol in the plasma membrane influence streptolysin O pore formation. Sci. Rep. 2019;9:4548. doi: 10.1038/s41598-019-39973-x. - DOI - PMC - PubMed

MeSH terms

Substances

Grants and funding

This study was supported by grants from the Hungarian Science Foundation T046945 (Z.B.), the Hungarian National Office for Research and Technology (Grant GVOP-3.2.1-2004-04-0351/3.0), and the Hungarian Scientific Research Fund Grant OMFB-01626/2006 (Z.B.), and by institutional funding of the Biophysics and Cell Biology Institute of Debrecen University.

LinkOut - more resources