. 2023 Aug 1;136(15):jcs260912.
doi: 10.1242/jcs.260912. Epub 2023 Aug 11.

The endosomal system of primary human vascular endothelial cells and albumin-FcRn trafficking

Affiliations

The endosomal system of primary human vascular endothelial cells and albumin-FcRn trafficking

Andreas Pannek et al. J Cell Sci. .

Abstract

Human serum albumin (HSA) has a long circulatory half-life owing, in part, to interaction with the neonatal Fc receptor (FcRn or FCGRT) in acidic endosomes and recycling of internalised albumin. Vascular endothelial and innate immune cells are considered the most relevant cells for FcRn-mediated albumin homeostasis in vivo. However, little is known about endocytic trafficking of FcRn-albumin complexes in primary human endothelial cells. To investigate FcRn-albumin trafficking in physiologically relevant endothelial cells, we generated primary human vascular endothelial cell lines from blood endothelial precursors, known as blood outgrowth endothelial cells (BOECs). We mapped the endosomal system in BOECs and showed that BOECs efficiently internalise fluorescently labelled HSA predominantly by fluid-phase macropinocytosis. Pulse-chase studies revealed that intracellular HSA molecules co-localised with FcRn in acidic endosomal structures and that the wildtype HSA, but not the non-FcRn-binding HSAH464Q mutant, was excluded from late endosomes and/or lysosomes. Live imaging revealed that HSA is partitioned into FcRn-positive tubules derived from maturing macropinosomes, which are then transported towards the plasma membrane. These findings identify the FcRn-albumin trafficking pathway in primary vascular endothelial cells, relevant to albumin homeostasis.

Keywords: Albumin; Blood outgrowth endothelial cells; Cargo recycling; Macropinocytosis; Neonatal Fc receptor; Primary endothelial cells.


Conflict of interest statement

Competing interests S.K.D. and A.M.V. are employees of CSL Limited and are able to partake in employee share option schemes. Research funding from CSL Limited is provided through an Australian Research Council linkage grant collaboration.

Figures
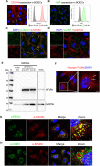
Fig. 1.
Fig. 1.
Expression of endothelial-specific markers and FcRn in established BOEC lines. (A–D) Confluent monolayers of BOECs were prepared for immunofluorescence microscopy and flow cytometry, as described in the Materials and Methods. (A,B) BOECs were stained with either CD144 (red) (A) or intracellular vWF (green) (B), and shown are confocal images (left) and FACS analysis (right). White arrows (A) indicate CD144 at the PM. Cells were gated on single, live cells and the histograms are shown for CD144-specific (red) and vWF-specific (green) fluorescence signals. Control cells were stained using the respective secondary antibodies only (grey). Scale bars: 10 µm. (C,D) Monolayers of BOECs were fixed with PFA (C) or methanol (D) and either stained for CD31 (green) (C) or vWF (green) (D) and CD144 (red). Cell nuclei were visualised using DAPI. White arrows indicate intracellular junctions between single BOECs. Scale bars: 10 µm. (E) Cultured BOECs and BMDMs isolated from FcRn KO, hFcRnTg/Tg line 276 or hFcRnTg/Tg line 32 mice were analysed by immunoblotting, with antibodies against human FcRn or GAPDH after stripping the membrane, and HRP-conjugated secondary antibodies. Chemiluminescence was detected using a ChemiDoc system (Bio-Rad). Data have been consolidated from the same immunoblot. The original uncropped blot is shown in Fig. S7. (F) BOECs were fixed with TCA, permeabilised with 0.1% Triton-X-100 and stained for human FcRn (red), and nuclei were visualised with DAPI (blue). White arrows indicated enlarged FcRn-positive endosomal structures. Scale bars: 10 µm (left); 5 µm (right). (G,H) BOECs were fixed with TCA (G) and methanol (H), and stained for human FcRn (red), either EEA1 (green, G) or CD63 (green, H), and DAPI (blue). In G, white arrows indicate the enlarged FcRn- and EEA1- positive endosomal structures. Scale bars: 10 µm (merge); 2 µm (zoom). Images are representative of more than three independent experiments.
Fig. 2.
Fig. 2.
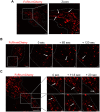
Dynamic trafficking of FcRn–mCherry in transduced live BOECs. BOECs were transduced with 10 µl lentivirus containing pFUGW-B2M-FcRn_mCherry (red) for 24 h, the monolayers were washed and cells were incubated for an additional 24 h. Live BOECs were imaged at 37°C and 5% CO2 with a FV3000 Olympus confocal microscope. (A) Representative image showing the presence of tubular structures. White arrows indicate FcRn–mCherry-positive tubules emerging from endosomal structures. Cell boundaries are indicated by dotted lines. Scale bars: 10 µm (FcRn–mCherry); 5 µm (zoom). (B,C) Time lapse of live cells was recorded either with a pause of 60 s (B) or continuously (frame speed=5.84 s) (C). Representative frames are shown. Cell boundaries are indicated by dotted lines. White arrows indicate tubular structures. Scale bars: 10 µm (left); 2 µm (zoomed frames). Images are representative of more than three independent experiments.
Fig. 3.
Fig. 3.
FcRn–mCherry does not reside in the recycling endosomes in transduced live BOECs. (A) BOECs were transfected with Rab11–GFP (green) using Lipofectamine 3000. After 48 h, cells were pulsed for 15 min with Alexa Fluor 568-labelled transferrin (Tf–AF568, red) at 37°C. (B) BOECs were transduced with 10 µl lentivirus containing pFUGW-B2M-FcRn_mCherry (red) for 24 h, and the monolayers were washed and incubated for an additional 24 h. Transduced cells were pulsed for 15 min with Tf–AF488 (green) at 37°C. (A,B) Monolayers of BOECs were washed and live cells imaged at 37°C and 5% CO2 with a FV3000 Olympus confocal microscope. White arrows indicate low level of overlap in the perinuclear region. Images represent maximum projections of whole-cell z-stacks from two independent experiments. Scale bars: 10 µm (original images); 5 µm (zoomed images).
Fig. 4.
Fig. 4.
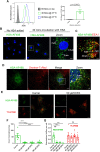
HSA uptake in cultured BOECs. (A) Cultured BOECs were pulsed for 30 min (green) or 60 min (blue) with HSA–AF568 at 37°C or on ice (grey). Monolayers were washed, cells detached from culture vessels and stained for CD144, and dead cells identified by DAPI staining. HSA uptake was analysed by flow cytometry. The mean fluorescence intensity (MFI) was calculated to quantify HSA uptake and data for 30 min uptake were pooled from four individual experiments. Data were analysed using a two-tailed paired Student's t-test and error bars represent s.e.m. (B,C) BOECs were pulsed for 30 min with HSA–AF488 (green) at 37°C. Monolayers were fixed and HSA–AF488 was uptake examined directly (B) or after staining for EEA1 (red) (C). Nuclei were visualised using DAPI (blue). Enlarged HSA-positive structures are highlighted by white arrows and the estimated diameter is shown. Images represent maximum projections of z-stacks from more than three independent experiments. Scale bars: 10 µm (original images); 5 µm (zoom). (D) BOECs were pulsed with HSA–AF488 (green) and 70 kDa dextran labelled with TexasRed (Dextran-TxRed) for 30 min at 37°C. After internalisation, cells were fixed with PFA and imaged by confocal fluorescence microscopy. Nuclei were visualized using DAPI. Shown is the maximum-intensity projection of z-stack optical sections. Enlarged HSA- and dextran-positive endosomal structures are indicated by white arrows and their estimated diameter is shown. Images are representative of three independent experiments. Scale bars: 10 µm; 2 µm (zoom). (E–G) BOECs were pre-treated with EIPA or with methanol alone (carrier) for 60 min at 37°C, before performing uptake experiments in the presence of the indicated EIPA concentration. EIPA-treated BOECs were pulsed with HSA–AF488 (green) and Tf–AF568 (red) at 37°C for 30 min. (E) Cells were fixed and imaged by confocal microscopy. Scale bars: 10 µm. (F) HSA–AF488-positive structures (macropinosomes; ∼0.5–5 µm diameter) from z-stacks of fixed cells were quantified. (G) Intracellular fluorescence levels (integrated density, IntDen) per cell for HSA–AF488 and Tf–AF568 were quantified using z-stack projections. Integrated densities were normalised to the mean values of the carrier controls (F). Data were analysed using Fisher's LSD test. Error bars represent s.e.m. ns, not significant; ***P<0.001; ****P<0.0001.
Fig. 5.
Fig. 5.
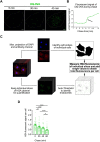
Pulse-chase analysis of DQ-OVA and HSA in BOECs. (A,B) Pulse-chase analysis of DQ-OVA in BOECs. (A) BOECs were pulsed with DQ-OVA (green) for 15 min at 37°C and DQ-OVA fluorescence was assessed over a 120 min chase in live cells. Cells were imaged every 5 min at 37°C using an Olympus FV3000 confocal fluorescence microscope. Cell boundary is indicated by dotted lines. Images are representative of two independent experiments. Scale bars: 10 µm. (B) The DQ-OVA fluorescence in confocal images of the live BOEC from A was quantified over the chase time. The total cell fluorescence intensity at 0 min (immediately after DQ-OVA uptake) was set to 1 and values expressed as fold change (x-fold). The black arrow indicates the appearance of bright DQ-OVA fluorescence after 45 min of chase. (C,D) Disappearance of intracellular HSA fluorescence during pulse-chase experiments in fixed BOECs. BOECs were pulsed with HSA–AF488 for 30 min and the fluorescence signal chased at 37°C for the designated interval. (C) Schematic overview of the protocol for the quantification of intracellular HSA fluorescence in fixed BOECs. Maximum projections of acquired z-stacks were made for the DAPI and an unrelated antibody channel to create masks representing the outline of single cells. (D) Quantitation of the total intracellular HSA fluorescence per cell in fixed BOECs. n≥19 cells from five independent experiments. Data were analysed using Fisher's LSD test. Error bars represent s.e.m. *P<0.05; **P<0.01; ****P<0.0001.
Fig. 6.
Fig. 6.
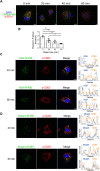
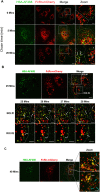
Pulse-chase of internalised HSA and HSAH464Q with endosomal and/or lysosomal markers in fixed BOECs. (A–D) BOECs were pulsed with either HSA–AF488 (green) (A–C) or non-FcRn-binding HSAH464Q (Mutant–AF488, green) (D) for 30 min at 37°C. Monolayers were washed and the intracellular fluorescence signal chased for up to 60 min at 37°C. After the chase periods, cells were directly fixed with PFA and stained for EEA1 (red; A,B) or CD63 (red; C,D). Nuclei were visualised using DAPI (blue). Images represent maximum projections of whole-cell z-stacks from more than three independent experiments. Scale bars: 10 µm. (B) Quantification of co-localisation by Manders' correlation coefficient M1. The parameters were calculated using ImageJ and values shown for calculated parameters above threshold; n≥5 cells from one experiment. Data were analysed using Fisher's LSD test. Error bars represent s.e.m. **P<0.01; ***P<0.001; ****P<0.0001. (C,D) The profiles of two line scans per image are shown for both fluorophores. The location of the respective line scans is indicated by white lines. Images represent maximum projections of whole-cell z-stacks. Data are representative of more than three independent experiments. Scale bars: 10 µm.
Fig. 7.
Fig. 7.
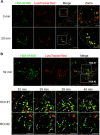
Localisation of endocytosed HSA–AF488 to LysoTracker Red-positive compartments in live BOECs. Cultured BOECs were stained with LysoTracker Red DND-99 (red) for 60 min at 37°C and subsequently pulsed with HSA–AF488 (green) for 15 min at 37°C. Monolayers were washed and the HSA–AF488 fluorescence signal was chased for 40 min in live cells. (A) Example images at 0 and 20 min chase. (B) Image of a LysoTracker Red-stained BOEC pulsed with HSA–AF488 after 32 min chase. Two ROIs were defined to highlight the presence of HSA–AF488-positive tubular carriers (indicated by white arrows). Frames of the two ROIs are shown for the 32–40 min chase. Live cells were imaged at 37°C and 5% CO2 using an Olympus FV3000 confocal fluorescence microscope. Cell boundaries are indicated by dotted lines. Images are representative of cells from one experiment. Scale bars: 10 µm (original images) and 5 µm (zoomed images).
Fig. 8.
Fig. 8.
Intracellular trafficking of HSA–AF488 in FcRn–mCherry-transduced live BOECs. (A–C) BOECs transduced with FcRn–mCherry (red) were pulsed with HSA–AF488 (green) for 15 min at 37°C and the fluorescence signal was chased for 40 min in live cells. Confocal microscopy images of live cells were taken immediately after the pulse (0 min) (A) or at 5, 20 (A), 25 (B) or 40 (C) min chase. In B, the field from 20 min in A was monitored for the 25–28 min chase time, and zoomed images of ROIs are shown. In C, shown is the maximum-intensity projection of z-stack optical sections. White arrows indicate HSA–AF488- and FcRn–mCherry-double-positive endosomal structures. White asterisks (A) indicate HSA–AF488-positive tubular transport carriers. Sky blue arrows (C) indicate tubular carriers that were negative or only faintly positive for HSA–AF488. Cell boundaries are indicated by dotted lines. Images are representative of more than three independent experiments. Scale bars: 10 µm (merge); 5 µm (zoom).
Fig. 9.
Fig. 9.
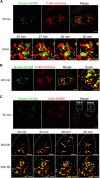
HSAH464QAF488 is excluded from tubular carriers in FcRn–mCherry-transduced live BOECs. (A,B) BOECs transduced with FcRn–mCherry (red) were pulsed with HSAH464Q–AF488 (Mutant–AF488, green) for 15 min at 37°C and the fluorescence signal chased for 40 min in live cells. The same field is shown throughout the chase in the live cells. Confocal images of live cells after 25, 27, 28 and 30 min chase (A) and after 40 min chase (B) are shown. White arrows indicate FcRn–mCherry-positive tubular transport carriers. (C) BOECs were pulsed with both HSAH464Q–AF488 (Mutant–AF488, green) and wildtype HSA–AF568 (red) for 15 min at 37°C, and the fluorescence signals chased for 40 min in live cells. Two ROIs were defined to follow the itinerary of single tubular transport carriers during the 32–40 min chase, as indicated. White arrows indicate wildtype HSA–AF568-positive tubular transport carriers. Cell boundaries are indicated by dotted lines. Images are representative of more than three independent experiments. Scale bars: 10 µm (merge); 5 µm (zoom).
Fig. 10.
Fig. 10.
Model of albumin trafficking in BOECs. Cartoon showing the intracellular trafficking pathways of wildtype (WT) HSA (green) and the non-binding mutant HSAH464Q (grey) mediated by FcRn (red/orange). Early macropinosomes are light green and acidic maturing macropinosomes are blue. The pathway of FcRn delivery to macropinosomes is not defined and could include delivery from the cell surface (as shown) or delivery from early endosomes and/or fusion of macropinosomes with early endosomes. The illustration was generated with BioRender.com.

Similar articles

References

    1. Akilesh, S., Christianson, G. J., Roopenian, D. C. and Shaw, A. S. (2007). Neonatal FcR expression in bone marrow-derived cells functions to protect serum IgG from catabolism. J. Immunol. 179, 4580-4588. 10.4049/jimmunol.179.7.4580 - DOI - PubMed
    1. Andersen, J. T., Dalhus, B., Cameron, J., Daba, M. B., Plumridge, A., Evans, L., Brennan, S. O., Gunnarsen, K. S., Bjørås, M., Sleep, D.et al. (2012). Structure-based mutagenesis reveals the albumin-binding site of the neonatal Fc receptor. Nat. Commun. 3, 610. 10.1038/ncomms1607 - DOI - PMC - PubMed
    1. Anderson, C. L. (2014). There's been a flaw in our thinking. Front. Immunol. 5, 540. 10.3389/fimmu.2014.00540 - DOI - PMC - PubMed
    1. Asahara, T., Murohara, T., Sullivan, A., Silver, M., Van Der Zee, R., Li, T., Witzenbichler, B., Schatteman, G. and Isner, J. M. (1997). Isolation of putative progenitor endothelial cells for angiogenesis. Science 275, 964-967. 10.1126/science.275.5302.964 - DOI - PubMed
    1. Bouïs, D., Hospers, G. A. P., Meijer, C., Molema, G. and Mulder, N. H. (2001). Endothelium in vitro: a review of human vascular endothelial cell lines for blood vessel-related research. Angiogenesis 4, 91-102. 10.1023/A:1012259529167 - DOI - PubMed

Publication types

Substances