Parkinson's disease neurons exhibit alterations in mitochondrial quality control proteins
- PMID: 37553379
- PMCID: PMC10409763
- DOI: 10.1038/s41531-023-00564-3
Parkinson's disease neurons exhibit alterations in mitochondrial quality control proteins
Abstract
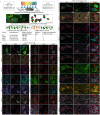
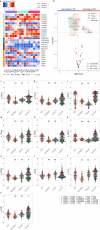
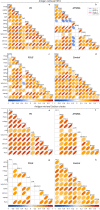
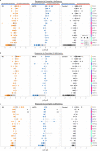
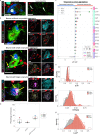
Mitochondrial dysfunction has been suggested to contribute to Parkinson's disease pathogenesis, though an understanding of the extent or exact mechanism of this contribution remains elusive. This has been complicated by challenging nature of pathway-based analysis and an inability simultaneously study multiple related proteins within human brain tissue. We used imaging mass cytometry (IMC) to overcome these challenges, measuring multiple protein targets, whilst retaining the spatial relationship between targets in post-mortem midbrain sections. We used IMC to simultaneously interrogate subunits of the mitochondrial oxidative phosphorylation complexes, and several key signalling pathways important for mitochondrial homoeostasis, in a large cohort of PD patient and control cases. We revealed a generalised and synergistic reduction in mitochondrial quality control proteins in dopaminergic neurons from Parkinson's patients. Further, protein-protein abundance relationships appeared significantly different between PD and disease control tissue. Our data showed a significant reduction in the abundance of PINK1, Parkin and phosphorylated ubiquitinSer65, integral to the mitophagy machinery; two mitochondrial chaperones, HSP60 and PHB1; and regulators of mitochondrial protein synthesis and the unfolded protein response, SIRT3 and TFAM. Further, SIRT3 and PINK1 did not show an adaptive response to an ATP synthase defect in the Parkinson's neurons. We also observed intraneuronal aggregates of phosphorylated ubiquitinSer65, alongside increased abundance of mitochondrial proteases, LONP1 and HTRA2, within the Parkinson's neurons with Lewy body pathology, compared to those without. Taken together, these findings suggest an inability to turnover mitochondria and maintain mitochondrial proteostasis in Parkinson's neurons. This may exacerbate the impact of oxidative phosphorylation defects and ageing related oxidative stress, leading to neuronal degeneration. Our data also suggest that that Lewy pathology may affect mitochondrial quality control regulation through the disturbance of mitophagy and intramitochondrial proteostasis.
© 2023. Springer Nature Limited.
Conflict of interest statement
M.F.M. declares receipt of licensing revenues from Abcam and EMD/Millipore on sales of anti-mtDNA-encoded protein antibodies. The remaining authors declare no competing interests.
Figures

Similar articles
-
PARIS induced defects in mitochondrial biogenesis drive dopamine neuron loss under conditions of parkin or PINK1 deficiency.Mol Neurodegener. 2020 Mar 5;15(1):17. doi: 10.1186/s13024-020-00363-x. Mol Neurodegener. 2020. PMID: 32138754 Free PMC article.
-
Ubiquitin phosphorylation in Parkinson's disease: Implications for pathogenesis and treatment.Transl Neurodegener. 2016 Jan 6;5:1. doi: 10.1186/s40035-015-0049-6. eCollection 2016. Transl Neurodegener. 2016. PMID: 26740872 Free PMC article. Review.
-
Imaging mass cytometry reveals generalised deficiency in OXPHOS complexes in Parkinson's disease.NPJ Parkinsons Dis. 2021 May 12;7(1):39. doi: 10.1038/s41531-021-00182-x. NPJ Parkinsons Dis. 2021. PMID: 33980828 Free PMC article.
-
SIAH proteins regulate the degradation and intra-mitochondrial aggregation of PINK1: Implications for mitochondrial pathology in Parkinson's disease.Aging Cell. 2022 Dec;21(12):e13731. doi: 10.1111/acel.13731. Epub 2022 Oct 28. Aging Cell. 2022. PMID: 36307912 Free PMC article.
-
PINK1-Parkin signaling in Parkinson's disease: Lessons from Drosophila.Neurosci Res. 2020 Oct;159:40-46. doi: 10.1016/j.neures.2020.01.016. Epub 2020 Feb 6. Neurosci Res. 2020. PMID: 32035987 Review.
Cited by
-
An Inducible Luminescent System to Explore Parkinson's Disease-Associated Genes.Int J Mol Sci. 2024 Aug 31;25(17):9493. doi: 10.3390/ijms25179493. Int J Mol Sci. 2024. PMID: 39273438 Free PMC article.
-
NADPH oxidase 2 activity disrupts Calmodulin/CaMKIIα complex via redox modifications of CaMKIIα-contained Cys30 and Cys289: Implications in Parkinson's disease.Redox Biol. 2024 Sep;75:103254. doi: 10.1016/j.redox.2024.103254. Epub 2024 Jun 26. Redox Biol. 2024. PMID: 38968922 Free PMC article.
-
Aging of alveolar type 2 cells induced by Lonp1 deficiency exacerbates pulmonary fibrosis.Biomol Biomed. 2024 Sep 6;24(5):1258-1272. doi: 10.17305/bb.2024.10429. Biomol Biomed. 2024. PMID: 38625722 Free PMC article.
-
Is There a Place for Lewy Bodies before and beyond Alpha-Synuclein Accumulation? Provocative Issues in Need of Solid Explanations.Int J Mol Sci. 2024 Apr 1;25(7):3929. doi: 10.3390/ijms25073929. Int J Mol Sci. 2024. PMID: 38612739 Free PMC article. Review.
-
The Potentiality of Natural Products and Herbal Medicine as Novel Medications for Parkinson's Disease: A Promising Therapeutic Approach.Int J Mol Sci. 2024 Jan 15;25(2):1071. doi: 10.3390/ijms25021071. Int J Mol Sci. 2024. PMID: 38256144 Free PMC article. Review.
References
-
- Schapira AHV, et al. Mitochondrial complex I deficiency In Parkinson’s disease. Lancet. 1989;333:1269. - PubMed
-
- D’Amato RJ, Lipman ZP, Snyder SH. Selectivity of the parkinsonian neurotoxin MPTP: toxic metabolite MPP+ binds to neuromelanin. Science. 1986;231:987–989. - PubMed
-
- Simola N, Morelli M, Carta AR. The 6-hydroxydopamine model of Parkinson’s disease. Neurotox. Res. 2007;11:151–167. - PubMed
Grants and funding
LinkOut - more resources
Full Text Sources
Research Materials
Miscellaneous

