Integrated analysis of single-cell and bulk RNA-seq establishes a novel signature for prediction in gastric cancer
- PMID: 37546563
- PMCID: PMC10401466
- DOI: 10.4251/wjgo.v15.i7.1215
Integrated analysis of single-cell and bulk RNA-seq establishes a novel signature for prediction in gastric cancer
Abstract
Background: Single-cell sequencing technology provides the capability to analyze changes in specific cell types during the progression of disease. However, previous single-cell sequencing studies on gastric cancer (GC) have largely focused on immune cells and stromal cells, and further elucidation is required regarding the alterations that occur in gastric epithelial cells during the development of GC.
Aim: To create a GC prediction model based on single-cell and bulk RNA sequencing (bulk RNA-seq) data.
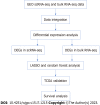
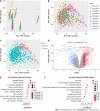
Methods: In this study, we conducted a comprehensive analysis by integrating three single-cell RNA sequencing (scRNA-seq) datasets and ten bulk RNA-seq datasets. Our analysis mainly focused on determining cell proportions and identifying differentially expressed genes (DEGs). Specifically, we performed differential expression analysis among epithelial cells in GC tissues and normal gastric tissues (NAGs) and utilized both single-cell and bulk RNA-seq data to establish a prediction model for GC. We further validated the accuracy of the GC prediction model in bulk RNA-seq data. We also used Kaplan-Meier plots to verify the correlation between genes in the prediction model and the prognosis of GC.
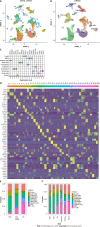
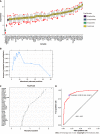
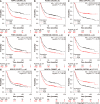
Results: By analyzing scRNA-seq data from a total of 70707 cells from GC tissue, NAG, and chronic gastric tissue, 10 cell types were identified, and DEGs in GC and normal epithelial cells were screened. After determining the DEGs in GC and normal gastric samples identified by bulk RNA-seq data, a GC predictive classifier was constructed using the Least absolute shrinkage and selection operator (LASSO) and random forest methods. The LASSO classifier showed good performance in both validation and model verification using The Cancer Genome Atlas and Genotype-Tissue Expression (GTEx) datasets [area under the curve (AUC)_min = 0.988, AUC_1se = 0.994], and the random forest model also achieved good results with the validation set (AUC = 0.92). Genes TIMP1, PLOD3, CKS2, TYMP, TNFRSF10B, CPNE1, GDF15, BCAP31, and CLDN7 were identified to have high importance values in multiple GC predictive models, and KM-PLOTTER analysis showed their relevance to GC prognosis, suggesting their potential for use in GC diagnosis and treatment.
Conclusion: A predictive classifier was established based on the analysis of RNA-seq data, and the genes in it are expected to serve as auxiliary markers in the clinical diagnosis of GC.
Keywords: Gastric cancer; Least absolute shrinkage and selection operator; Prediction model; Random forest; Single-cell RNA sequencing.
©The Author(s) 2023. Published by Baishideng Publishing Group Inc. All rights reserved.
Conflict of interest statement
Conflict-of-interest statement: All the authors report having no relevant conflicts of interest for this article.
Figures


Similar articles
-
Identification and validation of biomarkers for epithelial-mesenchymal transition-related cells to estimate the prognosis and immune microenvironment in primary gastric cancer by the integrated analysis of single-cell and bulk RNA sequencing data.Math Biosci Eng. 2023 Jun 16;20(8):13798-13823. doi: 10.3934/mbe.2023614. Math Biosci Eng. 2023. PMID: 37679111
-
Comprehensive analysis of scRNA-Seq and bulk RNA-Seq reveals dynamic changes in the tumor immune microenvironment of bladder cancer and establishes a prognostic model.J Transl Med. 2023 Mar 27;21(1):223. doi: 10.1186/s12967-023-04056-z. J Transl Med. 2023. PMID: 36973787 Free PMC article.
-
Integrative analysis reveals a four-gene signature for predicting survival and immunotherapy response in colon cancer patients using bulk and single-cell RNA-seq data.Front Oncol. 2023 Oct 31;13:1277084. doi: 10.3389/fonc.2023.1277084. eCollection 2023. Front Oncol. 2023. PMID: 38023180 Free PMC article.
-
Comprehensive analyses of brain cell communications based on multiple scRNA-seq and snRNA-seq datasets for revealing novel mechanism in neurodegenerative diseases.CNS Neurosci Ther. 2023 Oct;29(10):2775-2786. doi: 10.1111/cns.14280. Epub 2023 Jun 2. CNS Neurosci Ther. 2023. PMID: 37269061 Free PMC article. Review.
-
Unveiling novel insights in prostate cancer through single-cell RNA sequencing.Front Oncol. 2023 Sep 8;13:1224913. doi: 10.3389/fonc.2023.1224913. eCollection 2023. Front Oncol. 2023. PMID: 37746302 Free PMC article. Review.
Cited by
-
Characterization of the Immune Microenvironment and Identification of Biomarkers in Chronic Rhinosinusitis with Nasal Polyps Using Single-Cell RNA Sequencing and Transcriptome Analysis.J Inflamm Res. 2024 Jan 12;17:253-277. doi: 10.2147/JIR.S440409. eCollection 2024. J Inflamm Res. 2024. PMID: 38229690 Free PMC article.
-
Exploring the immune escape mechanisms in gastric cancer patients based on the deep AI algorithms and single-cell sequencing analysis.J Cell Mol Med. 2024 May;28(10):e18379. doi: 10.1111/jcmm.18379. J Cell Mol Med. 2024. PMID: 38752750 Free PMC article.
References
LinkOut - more resources
Full Text Sources
Research Materials
Miscellaneous

