Combining the AKT inhibitor capivasertib and SERD fulvestrant is effective in palbociclib-resistant ER+ breast cancer preclinical models
- PMID: 37543694
- PMCID: PMC10404292
- DOI: 10.1038/s41523-023-00571-w
Combining the AKT inhibitor capivasertib and SERD fulvestrant is effective in palbociclib-resistant ER+ breast cancer preclinical models
Erratum in
-
Author Correction: Combining the AKT inhibitor capivasertib and SERD fulvestrant is effective in palbociclib-resistant ER+ breast cancer preclinical models.NPJ Breast Cancer. 2023 Aug 18;9(1):69. doi: 10.1038/s41523-023-00575-6. NPJ Breast Cancer. 2023. PMID: 37596288 Free PMC article. No abstract available.
-
Author Correction: Combining the AKT inhibitor capivasertib and SERD fulvestrant is effective in palbociclib-resistant ER+ breast cancer preclinical models.NPJ Breast Cancer. 2023 Sep 19;9(1):76. doi: 10.1038/s41523-023-00581-8. NPJ Breast Cancer. 2023. PMID: 37726304 Free PMC article. No abstract available.
Abstract
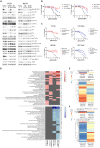
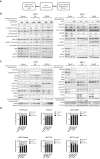
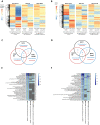
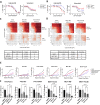
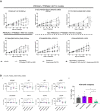
Combining the selective AKT inhibitor, capivasertib, and SERD, fulvestrant improved PFS in a Phase III clinical trial (CAPItello-291), treating HR+ breast cancer patients following aromatase inhibitors, with or without CDK4/6 inhibitors. However, clinical data suggests CDK4/6 treatment may reduce response to subsequent monotherapy endocrine treatment. To support understanding of trials such as CAPItello-291 and gain insight into this emerging population of patients, we explored how CDK4/6 inhibitor treatment influences ER+ breast tumour cell function and response to fulvestrant and capivasertib after CDK4/6 inhibitor treatment. In RB+, RB- T47D and MCF7 palbociclib-resistant cells ER pathway ER and Greb-1 expression were reduced versus naïve cells. PI3K-AKT pathway activation was also modified in RB+ cells, with capivasertib less effective at reducing pS6 in RB+ cells compared to parental cells. Expression profiling of parental versus palbociclib-resistant cells confirmed capivasertib, fulvestrant and the combination differentially impacted gene expression modulation in resistant cells, with different responses seen in T47D and MCF7 cells. Fulvestrant inhibition of ER-dependent genes was reduced. In resistant cells, the combination was less effective at reducing cell cycle genes, but a consistent reduction in cell fraction in S-phase was observed in naïve and resistant cells. Despite modified signalling responses, both RB+ and RB- resistant cells responded to combination treatment despite some reduction in relative efficacy and was effective in vivo in palbociclib-resistant PDX models. Collectively these findings demonstrate that simultaneous inhibition of AKT and ER signalling can be effective in models representing palbociclib resistance despite changes in pathway dependency.
© 2023. Springer Nature Limited.
Conflict of interest statement
All authors declare a financial conflict. All authors are AstraZeneca employees and shareholders.
Figures
Similar articles
-
The Next-Generation Oral Selective Estrogen Receptor Degrader Camizestrant (AZD9833) Suppresses ER+ Breast Cancer Growth and Overcomes Endocrine and CDK4/6 Inhibitor Resistance.Cancer Res. 2023 Dec 1;83(23):3989-4004. doi: 10.1158/0008-5472.CAN-23-0694. Cancer Res. 2023. PMID: 37725704 Free PMC article.
-
"The emerging role of capivasertib in breast cancer".Breast. 2022 Jun;63:157-167. doi: 10.1016/j.breast.2022.03.018. Epub 2022 Apr 1. Breast. 2022. PMID: 35398754 Free PMC article. Review.
-
Efficacy of SERD/SERM Hybrid-CDK4/6 Inhibitor Combinations in Models of Endocrine Therapy-Resistant Breast Cancer.Clin Cancer Res. 2015 Nov 15;21(22):5121-5130. doi: 10.1158/1078-0432.CCR-15-0360. Epub 2015 May 19. Clin Cancer Res. 2015. PMID: 25991817 Free PMC article.
-
Effective combination therapies in preclinical endocrine resistant breast cancer models harboring ER mutations.Oncotarget. 2016 Aug 23;7(34):54120-54136. doi: 10.18632/oncotarget.10852. Oncotarget. 2016. PMID: 27472462 Free PMC article.
-
Clinical utility of fulvestrant in the treatment of breast cancer: a report on the emerging clinical evidence.Cancer Manag Res. 2018 Aug 30;10:3083-3099. doi: 10.2147/CMAR.S137772. eCollection 2018. Cancer Manag Res. 2018. PMID: 30214302 Free PMC article. Review.
Cited by
-
New generation estrogen receptor-targeted agents in breast cancer: present situation and future prospectives.Acta Mater Med. 2024 Feb 21;3(1):57-71. doi: 10.15212/amm-2024-0006. Epub 2024 Mar 15. Acta Mater Med. 2024. PMID: 39373009 Free PMC article.
-
The G Protein Estrogen Receptor (GPER) is involved in the resistance to the CDK4/6 inhibitor palbociclib in breast cancer.J Exp Clin Cancer Res. 2024 Jun 18;43(1):171. doi: 10.1186/s13046-024-03096-7. J Exp Clin Cancer Res. 2024. PMID: 38886784 Free PMC article.
-
3D computer modeling of inhibitors targeting the MCF-7 breast cancer cell line.Front Chem. 2024 May 23;12:1384832. doi: 10.3389/fchem.2024.1384832. eCollection 2024. Front Chem. 2024. PMID: 38887699 Free PMC article.
-
Capivasertib combines with docetaxel to enhance anti-tumour activity through inhibition of AKT-mediated survival mechanisms in prostate cancer.Br J Cancer. 2024 May;130(8):1377-1387. doi: 10.1038/s41416-024-02614-w. Epub 2024 Feb 23. Br J Cancer. 2024. PMID: 38396173 Free PMC article.
-
Potent combination benefit of the AKT inhibitor capivasertib and the BCL-2 inhibitor venetoclax in diffuse large B cell lymphoma.Leukemia. 2024 Dec;38(12):2663-2674. doi: 10.1038/s41375-024-02401-9. Epub 2024 Sep 16. Leukemia. 2024. PMID: 39284898 Free PMC article.
References
-
- Early Breast Cancer Trialists’ Collaborative Group. Aromatase inhibitors versus tamoxifen in early breast cancer: patient-level meta-analysis of the randomised trials. Lancet. 2015;386:1341–1352. - PubMed
-
- Howell A, et al. Fulvestrant, formerly ICI 182,780, is as effective as anastrozole in postmenopausal women with advanced breast cancer progressing after prior endocrine treatment. J. Clin. Oncol. 2002;20:3396–3403. - PubMed
LinkOut - more resources
Full Text Sources

