Analysis on tumor immune microenvironment and construction of a prognosis model for immune-related skin cutaneous melanoma
- PMID: 37539569
- PMCID: PMC10930407
- DOI: 10.11817/j.issn.1672-7347.2023.230069
Analysis on tumor immune microenvironment and construction of a prognosis model for immune-related skin cutaneous melanoma
Abstract
Objectives: Malignant melanoma is a highly malignant and heterogeneous skin cancer. Although immunotherapy has improved survival rates, the inhibitory effect of tumor microenvironment has weakened its efficacy. To improve survival and treatment strategies, we need to develop immune-related prognostic models. Based on the analysis of the Cancer Genome Atlas (TCGA), Gene Expression Omnibus (GEO), and Sequence Read Archive (SRA) database, this study aims to establish an immune-related prognosis prediction model, and to evaluate the tumor immune microenvironment by risk score to guide immunotherapy.
Methods: Skin cutaneous melanoma (SKCM) transcriptome sequencing data and corresponding clinical information were obtained from the TCGA database, differentially expressed genes were analyzed, and prognostic models were developed using univariate Cox regression, the LASSO method, and stepwise regression. Differentially expressed genes in prognostic models confirmed by real-time reverse transcription PCR (real-time RT-PCR) and Western blotting. Survival analysis was performed by using the Kaplan-Meier method, and the effect of the model was evaluated by time-dependent receiver operating characteristic curve as well as multivariate Cox regression, and the prognostic model was validated by 2 GEO melanoma datasets. Furthermore, correlations between risk score and immune cell infiltration, Estimation of STromal and Immune cells in MAlignant Tumor tissues using Expression data (ESTIMATE) score, immune checkpoint mRNA expression levels, tumor immune cycle, or tumor immune micro-environmental pathways were analyzed. Finally, we performed association analysis for risk score and the efficacy of immunotherapy.
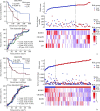
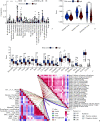
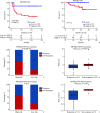
Results: We identified 4 genes that were differentially expressed in TCGA-SKCM datasets, which were mainly associated with the tumor immune microenvironment. A prognostic model was also established based on 4 genes. Among 4 genes, the mRNA and protein levels of killer cell lectin like receptor D1 (KLRD1), leukemia inhibitory factor (LIF), and cellular retinoic acid binding protein 2 (CRABP2) genes in melanoma tissues differed significantly from those in normal skin (all P<0.01). The prognostic model was a good predictor of prognosis for patients with SKCM. The patients with high-risk scores had significantly shorter overall survival than those with low-risk scores, and consistent results were achieved in the training cohort and multiple validation cohorts (P<0.001). The risk score was strongly associated with immune cell infiltration, ESTIMATE score, immune checkpoint mRNA expression levels, tumor immune cycle, and tumor immune microenvironmental pathways (P<0.001). The correlation analysis showed that patients with the high-risk scores were in an inhibitory immune microenvironment based on the prognostic model (P<0.01).
Conclusions: The immune-related SKCM prognostic model constructed in this study can effectively predict the prognosis of SKCM patients. Considering its close correlation to the tumor immune microenvironment, the model has some reference value for clinical immunotherapy of SKCM.
目的: 恶性黑色素瘤是高度恶性和异质性的皮肤肿瘤,尽管免疫治疗的出现提高了患者的生存率,但肿瘤微环境的抑制作用却减弱了免疫治疗的效果。因此需开发特定的免疫相关的预后模型从而提高患者的生存率和治疗策略。本研究结合癌症基因组图谱(The Cancer Genome Atlas,TCGA)、高通量基因表达(Gene Expression Omnibus,GEO)以及序列读取档案(Sequence Read Archive,SRA)数据库中皮肤黑色素瘤(skin cutaneous melanoma,SKCM)的相关数据,旨在建立一个基于差异表达的免疫相关预后预测模型,并通过风险评分评估肿瘤免疫微环境用以指导临床免疫治疗。方法: 从TCGA数据库获取SKCM转录组测序数据和对应的临床信息,分析其差异表达基因,并使用单因素Cox回归、LASSO方法以及逐步回归建立预后模型。采用实时反转录聚合酶链反应(real-time reverse transcription PCR,real-time RT-PCR)和蛋白质印迹法验证预后模型中基因的表达差异。使用Kaplan-Meier方法进行生存分析,通过时间依赖受试者操作特征曲线以及多因素Cox回归评价模型的效果,并使用GEO数据库中2个SKCM数据集对预后模型进行验证。进一步分析风险评分与免疫细胞浸润、基于表达估计恶性肿瘤组织的基质细胞和免疫细胞(Estimation of STromal and Immune cells in MAlignant Tumor tissues using Expression data,ESTIMATE)评分、免疫检查点mRNA表达水平、肿瘤免疫周期及肿瘤免疫微环境通路间的相关性。最后在真实世界的队列中验证风险评分与免疫治疗效果及预后的相关性。结果: TCGA-SKCM数据集的差异分析发现差异表达基因主要与肿瘤免疫微环境相关。同时得到一个基于4个基因的预后模型,在模型中SKCM组织与正常皮肤组织的人细胞维甲酸结合蛋白2 (cellular retinoic acid binding protein 2,CRABP2)、白血病抑制因子(leukemia inhibitory factor,LIF)及杀伤细胞凝集素样受体D1(killer cell lectin like receptor D1,KLRD1)基因的mRNA和蛋白质水平差异均有统计学意义(均P<0.01)。高风险评分的患者总生存期显著短于低风险评分的患者(P<0.001),在训练队列与多个验证队列取得了一致的结果(P<0.001)。预后模型与肿瘤免疫微环境的相关性分析结果显示高风险评分的SKCM患者处于抑制性的免疫微环境(P<0.01)。结论: 构建的免疫相关SKCM预后模型可以有效预测SKCM患者的预后;结合其评分与肿瘤免疫微环境的密切相关性,该模型对于SKCM临床免疫治疗的效果预测具有一定的参考价值。.
Keywords: bioinformatics; prognostic model; skin cutaneous melanoma; tumor immune microenvironment.
Conflict of interest statement
作者声称无任何利益冲突。
Figures


Similar articles
-
Development and validation of an immune gene set-based prognostic signature in cutaneous melanoma.Future Oncol. 2021 Nov;17(31):4115-4129. doi: 10.2217/fon-2021-0104. Epub 2021 Jul 22. Future Oncol. 2021. PMID: 34291650
-
Integrative lactylation and tumor microenvironment signature as prognostic and therapeutic biomarkers in skin cutaneous melanoma.J Cancer Res Clin Oncol. 2023 Dec;149(20):17897-17919. doi: 10.1007/s00432-023-05483-7. Epub 2023 Nov 13. J Cancer Res Clin Oncol. 2023. PMID: 37955686
-
Multi-omics analysis for ferroptosis-related genes as prognostic factors in cutaneous melanoma.Zhong Nan Da Xue Xue Bao Yi Xue Ban. 2024 Feb 28;49(2):159-174. doi: 10.11817/j.issn.1672-7347.2024.230401. Zhong Nan Da Xue Xue Bao Yi Xue Ban. 2024. PMID: 38755712 Free PMC article.
-
Constructing and validating a risk model based on neutrophil-related genes for evaluating prognosis and guiding immunotherapy in colon cancer.J Gene Med. 2024 Apr;26(4):e3684. doi: 10.1002/jgm.3684. J Gene Med. 2024. PMID: 38618694 Review.
-
CD52 mRNA expression predicts prognosis and response to immune checkpoint blockade in melanoma.Pigment Cell Melanoma Res. 2024 Mar;37(2):309-315. doi: 10.1111/pcmr.13151. Epub 2023 Nov 17. Pigment Cell Melanoma Res. 2024. PMID: 37975535 Review.
References
MeSH terms
Grants and funding
LinkOut - more resources
Full Text Sources
Medical
Research Materials
Miscellaneous

