. 2023 Jul 16;24(14):11536.
doi: 10.3390/ijms241411536.

Investigating the Prevalence of RNA-Binding Metabolic Enzymes in E. coli

Affiliations

Investigating the Prevalence of RNA-Binding Metabolic Enzymes in E. coli

Thomas Klein et al. Int J Mol Sci. .

Abstract

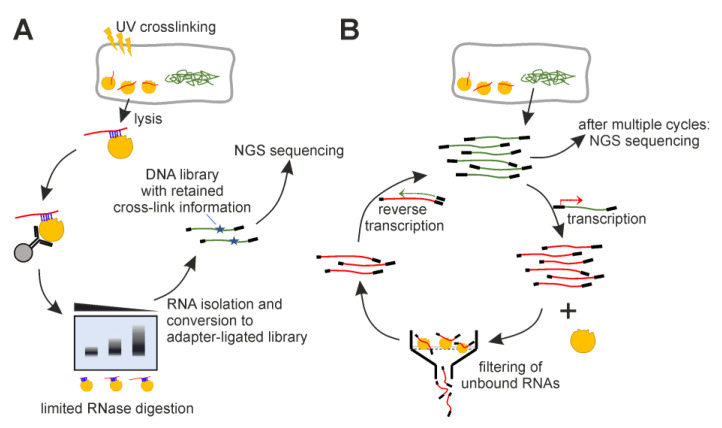
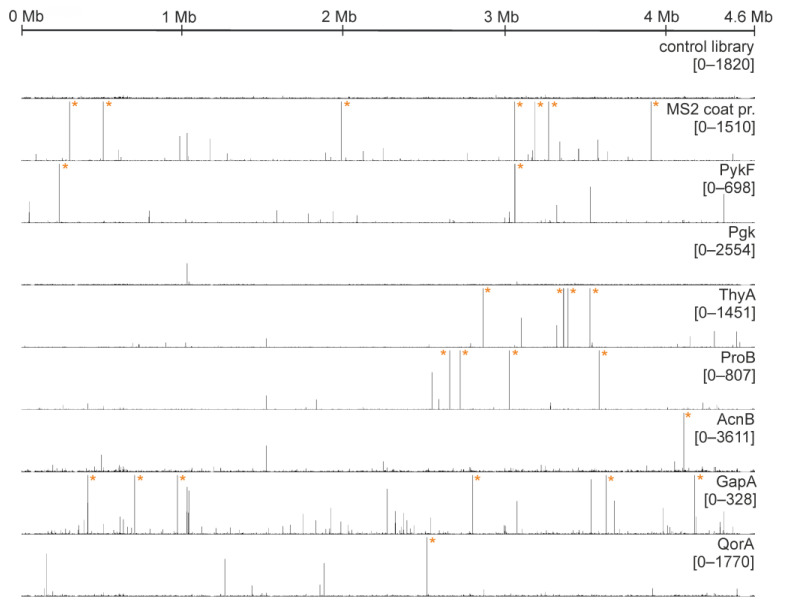
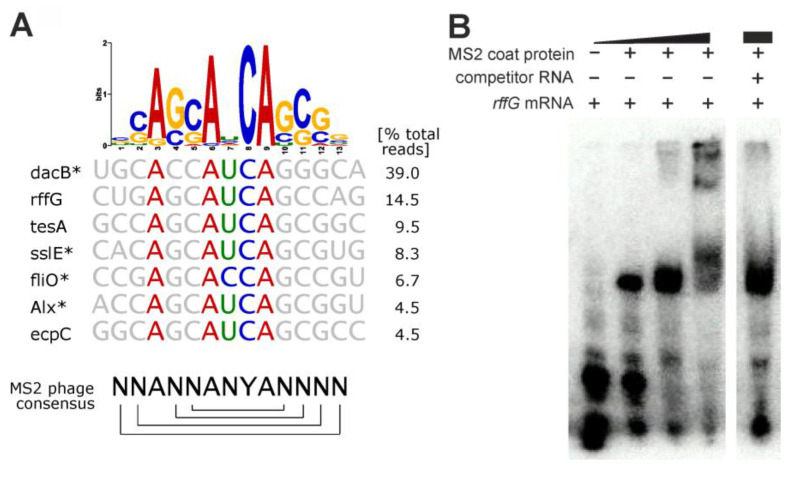
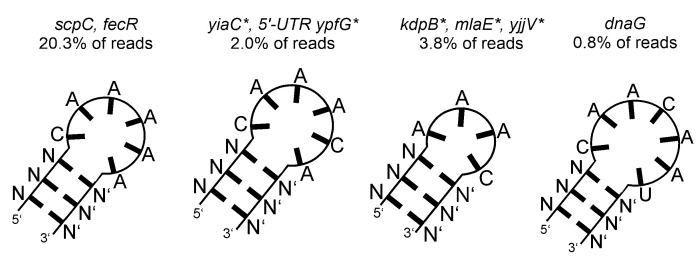
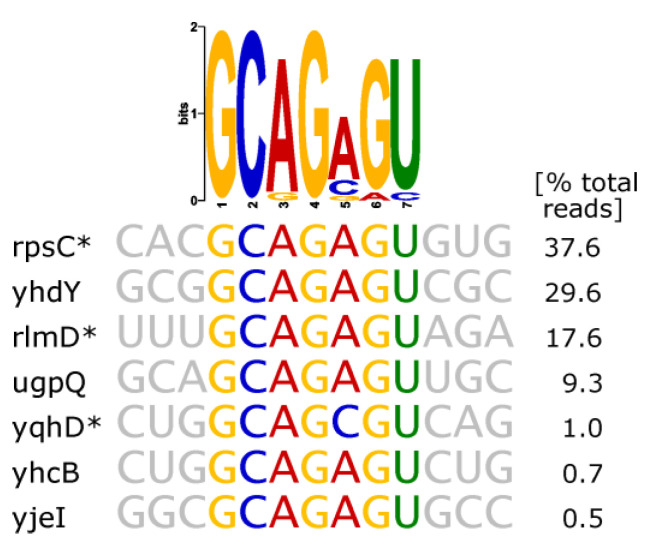
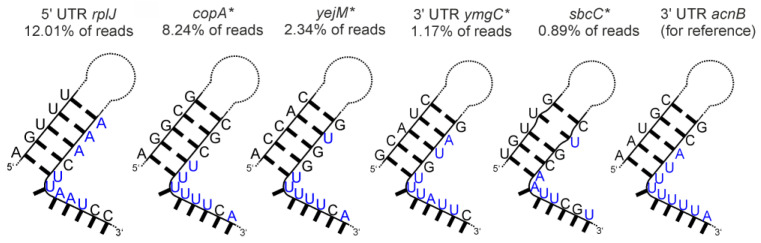
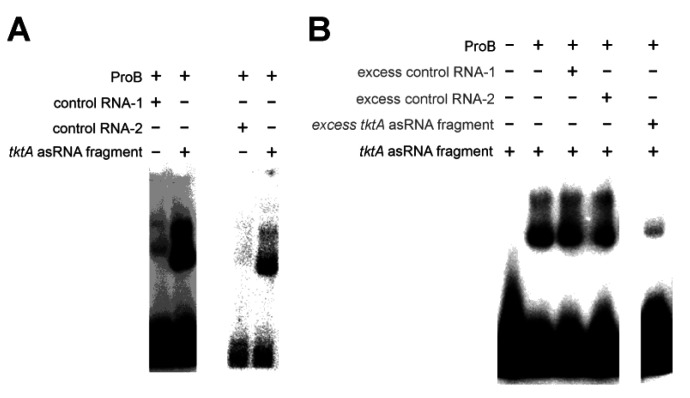
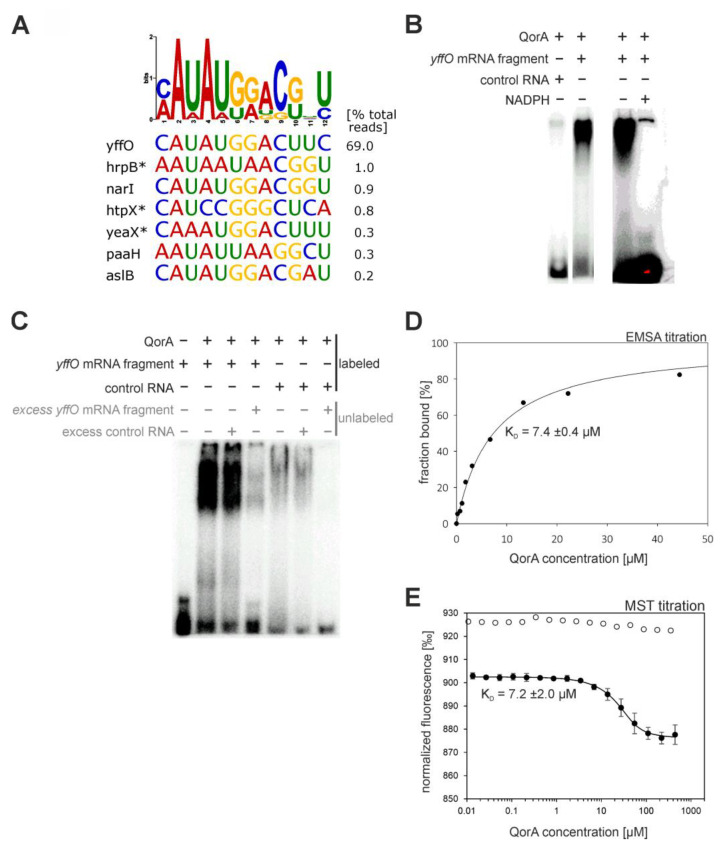
An open research field in cellular regulation is the assumed crosstalk between RNAs, metabolic enzymes, and metabolites, also known as the REM hypothesis. High-throughput assays have produced extensive interactome data with metabolic enzymes frequently found as hits, but only a few examples have been biochemically validated, with deficits especially in prokaryotes. Therefore, we rationally selected nineteen Escherichia coli enzymes from such datasets and examined their ability to bind RNAs using two complementary methods, iCLIP and SELEX. Found interactions were validated by EMSA and other methods. For most of the candidates, we observed no RNA binding (12/19) or a rather unspecific binding (5/19). Two of the candidates, namely glutamate-5-kinase (ProB) and quinone oxidoreductase (QorA), displayed specific and previously unknown binding to distinct RNAs. We concentrated on the interaction of QorA to the mRNA of yffO, a grounded prophage gene, which could be validated by EMSA and MST. Because the physiological function of both partners is not known, the biological relevance of this interaction remains elusive. Furthermore, we found novel RNA targets for the MS2 phage coat protein that served us as control. Our results indicate that RNA binding of metabolic enzymes in procaryotes is less frequent than suggested by the results of high-throughput studies, but does occur.

Keywords: MS2 phage; REM hypothesis; RNA-binding protein; SELEX; metabolic enzymes; prokaryotes; quinone oxidoreductase; unconventional RNA binding.


Conflict of interest statement

The authors declare no conflict of interest.

Figures

Figure 1
Figure 1
Schematic overview of experiments. (A) iCLIP—UV-light exposure induces covalent cross-linking of proteins and RNAs in proximity. Immunoprecipitation isolates the enzyme of interest. If RNA can be detected in a limited RNase titration, it is isolated and processed into an NGS-applicable DNA library by reverse transcription and adapter ligation. (B) SELEX—Fragmented E. coli DNA is processed into an RNA library by adapter ligation and transcription. The RNA library is exposed to the enzyme, and resulting complexes are isolated via filter binding. The bound RNAs are isolated and reverse-transcribed into DNA to enable PCR re-amplification. The process is repeated multiple times, ideally until the filter binding assay retains significantly increased RNA amounts.
Figure 2
Figure 2
Distribution maps of sequenced reads. The X-axis represents the whole genome. The Y-axis is scaled to 2% of respective total read number for each lane. The numbers below the protein name indicate this 2% range. Asterisks mark read numbers surpassing the displayed scale.
Figure 3
Figure 3
MS2 coat protein SELEX results. (A) Sequence logo derived from all genomic sequences mapped to significant read clusters. Below, gene names and aligned sequences are shown for the seven largest read clusters, comprising an accumulated 87% of total mapped reads. On the bottom, the consensus sequence of the MS2 operator hairpin (brackets indicate base pairing) is shown for reference. Asterisks indicate antisense orientation of the enriched RNA relative to the respective gene. (B) Competition EMSA validating the interaction between MS2 coat protein (0.34–34 µM) and a radiolabeled 36 nt rffG mRNA fragment (700 nM). The competitor RNA (70 µM) is an artificially designed 40 nt fragment with random sequence (all sequences listed in Table S5).
Figure 4
Figure 4
Secondary structure predictions of the top four RNA fragments enriched in the Pgk SELEX experiment. The underlying gene names and the read cluster size (as % of total mapped reads) are indicated. Asterisks indicate antisense orientation of the enriched RNA relative to the respective gene.
Figure 5
Figure 5
Thymidylate synthase SELEX results. The sequences of largest read clusters and a derived sequence logo are shown. Asterisks indicate antisense orientation of the enriched RNA relative to the respective gene.
Figure 6
Figure 6
Secondary structure predictions of six RNA fragments enriched in the AcnB SELEX experiment. The underlying gene names and the read cluster size (as % of total mapped reads) are indicated. Asterisks indicate antisense orientation of the enriched RNA relative to the respective gene. The AU-rich sequences are highlighted in blue.
Figure 7
Figure 7
EMSAs validating the specific interaction between glutamate-5-kinase (ProB) and the tktA antisense RNA (asRNA) fragment. (A) ProB (8 µM), control RNA-1 (2 µM), control RNA-2 (1 µM), tktA asRNA fragment (lane 2: 2 µM, lane 4: 1 µM). (B) Competition EMSA, unlabeled RNA indicated by grey text. ProB (8 µM), unlabeled control RNA-1 (100 µM), unlabeled control RNA-2 (100 µM), tktA asRNA fragment (labeled: 2 µM, unlabeled: 100 µM). RNA sequences are listed in Table S5.
Figure 8
Figure 8
Results and validation of the quinone oxidoreductase (QorA) SELEX experiment. (A) Sequence logo and underlying sequences of largest read clusters. Asterisks indicate antisense orientation of the enriched RNA relative to the respective gene. (B) EMSAs validating the specific interaction between quinone oxidoreductase (QorA) and the yffO mRNA fragment. QorA (14 µM), yffO mRNA fragment (12 µM), unrelated control RNA (12 µM), NADPH (20 mM). The red color indicates oversaturation of the picture in that area. (C) Competition EMSA, excess unlabeled RNA indicated as grey text. QorA (14 µM), yffO mRNA fragment (labeled: 12 µM, unlabeled: 130 µM) control RNA (labeled: 12 µM, unlabeled: 130 µM). RNA sequences are listed in Table S5. (D) Evaluation of EMSA titration of 350 nM yffO mRNA fragment. The graph of the fitted hyperbolic binding equation and resulting KD are displayed. (E) Evaluation of MST titration of 10 nM Cy5-labeled yffO mRNA fragment, followed by relative fluorescence at 670 nm. The graph of the fitted binding equation and resulting KD are displayed. White data points represent an analogous titration in the presence of 10 mM NADPH.

Similar articles

Cited by

References

    1. Lunde B.M., Moore C., Varani G. RNA-binding proteins: Modular design for efficient function. Nat. Rev. Mol. Cell Biol. 2007;8:479–490. doi: 10.1038/nrm2178. - DOI - PMC - PubMed
    1. Hacisuleyman E., Goff L.A., Trapnell C., Williams A., Henao-Mejia J., Sun L., McClanahan P., Hendrickson D.G., Sauvageau M., Kelley D.R., et al. Topological organization of multichromosomal regions by the long intergenic noncoding RNA Firre. Nat. Struct. Mol. Biol. 2014;21:198–206. doi: 10.1038/nsmb.2764. - DOI - PMC - PubMed
    1. Creamer K.M., Lawrence J.B. XIST RNA: A window into the broader role of RNA in nuclear chromosome architecture. Philos. Trans. R. Soc. Lond. Ser. B Biol. Sci. 2017;372:20160360. doi: 10.1098/rstb.2016.0360. - DOI - PMC - PubMed
    1. Fuller G.G., Han T., Freeberg M.A., Moresco J.J., Ghanbari Niaki A., Roach N.P., Yates J.R., 3rd, Myong S., Kim J.K. RNA promotes phase separation of glycolysis enzymes into yeast G bodies in hypoxia. Elife. 2020;9:e48480. doi: 10.7554/eLife.48480. - DOI - PMC - PubMed
    1. Ottoz D.S.M., Berchowitz L.E. The role of disorder in RNA binding affinity and specificity. Open Biol. 2020;10:200328. doi: 10.1098/rsob.200328. - DOI - PMC - PubMed

Grants and funding

This research received no external funding.

LinkOut - more resources