. 2023 Jul 17;12(14):1871.
doi: 10.3390/cells12141871.

Src-Dependent NM2A Tyrosine Phosphorylation Regulates Actomyosin Remodeling

Affiliations

Src-Dependent NM2A Tyrosine Phosphorylation Regulates Actomyosin Remodeling

Cláudia Brito et al. Cells. .

Abstract

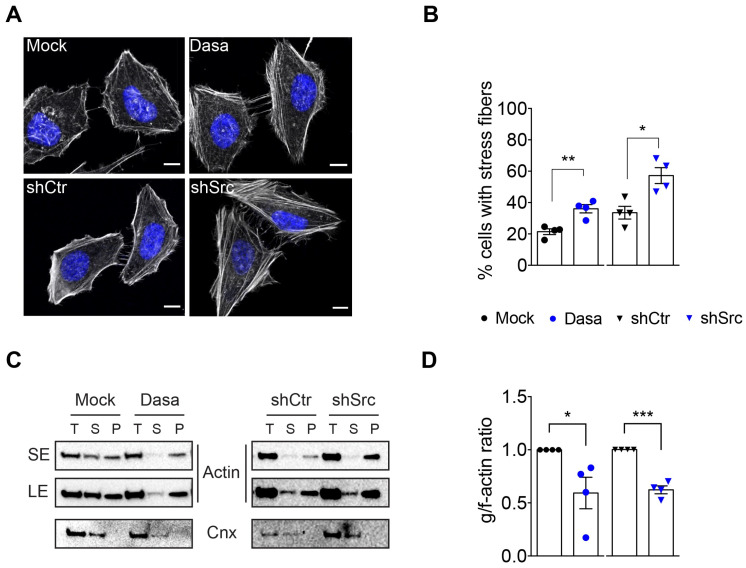
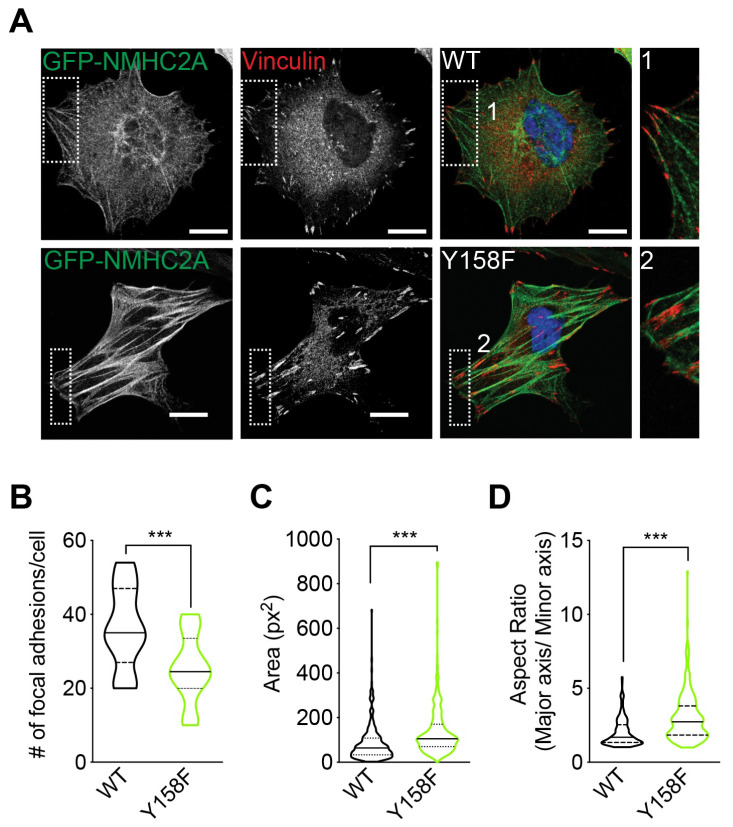
Non-muscle myosin 2A (NM2A) is a key cytoskeletal enzyme that, along with actin, assembles into actomyosin filaments inside cells. NM2A is fundamental for cell adhesion and motility, playing important functions in different stages of development and during the progression of viral and bacterial infections. Phosphorylation events regulate the activity and the cellular localization of NM2A. We previously identified the tyrosine phosphorylation of residue 158 (pTyr158) in the motor domain of the NM2A heavy chain. This phosphorylation can be promoted by Listeria monocytogenes infection of epithelial cells and is dependent on Src kinase; however, its molecular role is unknown. Here, we show that the status of pTyr158 defines cytoskeletal organization, affects the assembly/disassembly of focal adhesions, and interferes with cell migration. Cells overexpressing a non-phosphorylatable NM2A variant or expressing reduced levels of Src kinase display increased stress fibers and larger focal adhesions, suggesting an altered contraction status consistent with the increased NM2A activity that we also observed. We propose NM2A pTyr158 as a novel layer of regulation of actomyosin cytoskeleton organization.

Keywords: NM2A; Src kinase; actomyosin cytoskeleton; cell migration; cytoskeletal remodeling.


Conflict of interest statement

The authors declare that they have no conflict of interest.

Figures

Figure 1
Figure 1
Actomyosin organization is regulated by the NMHC2A pTyr158 status. (A) Percentage of transfected cells determined by the quantification of GFP positive cells by flow cytometry. Each dot corresponds to a single independent experiment. Values are the means ± SEM (n = 3). (B) Expression levels of the different variants shown as the MFI (mean fluorescence intensity) of the GFP positive cells determined by flow cytometry. Each dot corresponds to a single independent experiment. Values are the means ± SEM (n = 3). (C) Representative confocal microscopy images of HeLa cells ectopically expressing either GFP-NMHC2A-WT, -Y158E, or -Y158F (green) and stained with phalloidin for f-actin (red) and DAPI (blue). Scale bar, 10 µm. (DF) Scoring of the percentage of cells displaying (D,E) NMHC2A aggregation or (F) stress fibers in HeLa cells ectopically expressing the indicated NMHC2A variants or co-expressing HSP90 in (E). Each dot corresponds to an independent experiment. Values are the means ± SEM; p-values were calculated using a two-tailed unpaired Student’s t-test; * p < 0.05, ** p < 0.01. (G) Immunoblots showing the levels of globular (g)- and filamentous (f)-actin in HeLa cells ectopically expressing NMHC2A WT or Y158F variants. g- and f-actin from the total cell lysates (T) were separated by ultracentrifugation. g-actin was recovered from supernatant fractions (S) while f-actin remained associated with pellet fractions (P). Calnexin was used as a loading control (Cnx). (H) The g-/f-actin ratio quantified from immunoblot images. Each dot corresponds to an independent experiment. Values are the means ± SEM (n = 4); the p-value was calculated using a two-tailed unpaired Student’s t-test; ** p < 0.01.
Figure 2
Figure 2
Src kinase controls actomyosin cytoskeleton organization in HeLa cells. (A) Confocal microscopy images of control (mock and shCtr) and Src-impaired (Dasatinib-treated and shSrc) HeLa cells stained with phalloidin for f-actin (greyscale) and with DAPI (blue). Scale bar, 10 µm. (B) Percentage of cells with stress fibers quantified from images similar to those shown in (A). Values are the means ± SEM (n = 4); p-values were calculated using a two-tailed unpaired Student’s t-test, * p < 0.05, ** p < 0.01. (C) Immunoblots showing the levels of globular (g)- and filamentous (f)-actin in HeLa cells treated as in (A). g- and f-actin from the total cell lysates (T) were separated by ultracentrifugation. g-actin was recovered from supernatant fractions (S) while f-actin was associated with pellet fractions (P). Calnexin was used as a loading control (Cnx). Actin levels are shown with both short exposure (SE) and long exposure (LE). (D) Quantification of the g-/f-actin ratio was conducted using immunoblot signals. Values are the means ± SEM (n = 4); p-values were calculated using a two-tailed unpaired Student’s t-test, * p < 0.05, *** p < 0.001. In (B,D), each dot or triangle corresponds to an independent experiment.
Figure 3
Figure 3
The number and the morphology of focal adhesions in HeLa cells are determined by the phosphorylation status of NMHC2A in Tyr158. (A) Representative confocal microscopy images of HeLa cells ectopically expressing GFP-NMHC2A-WT or GFP-NMHC2A-Y158F (green), immunolabeled for vinculin (red) and stained with DAPI (blue). The insets (1 and 2) show the focal adhesion morphology. Scale bar, 10 µm. (B) Quantification of the number of focal adhesions per cell from images similar to those shown in (A). Each dot corresponds to the mean number of focal adhesions per cell obtained from three independent experiments. Values are the means ± SEM; p-value was calculated using a two-tailed unpaired Student’s t-test, *** p < 0.001 (C,D) Quantification of the focal adhesion (C) area and (D) aspect ratio from images similar to those shown in A. Each dot corresponds to a single focal adhesion. Values are the means ± SEM (n > 140); p-values were calculated using a two-tailed unpaired Student’s t-test, *** p < 0.001.
Figure 4
Figure 4
The lack of NMHC2A pTyr158 impairs the motility of HeLa cells. (A,B) Quantification of cell shape parameters of HeLa cells ectopically expressing GFP-NMHC2A-WT or -Y158F: (A) area and (B) aspect ratio. Cells were stained with phalloidin and quantifications were performed using Fiji™. Each dot represents a single cell. Values are the means ± SEM (n > 160); p-values were calculated using a two-tailed unpaired Student’s t-test, ** p < 0.01. (C) Sequential frames of the timelapse microscopy Movie S1, from 0 to 10 h 30 min. HeLa cells ectopically expressing GFP-NMHC2A-WT or GFP-NMHC2A-Y158F are shown. The movement of individual cells over time was analyzed using the Fiji™ Manual Tracking plugin and is represented by colored lines. Scale bar, 50 μm. (D,E) Quantification of cell motility parameters using the Manual Tracking plugin of Fiji™: (D) velocity and (E) accumulated distance in HeLa cells as in A. The data were obtained from movies similar to Movie S1. Each dot represents a single cell. Values are the means ± SEM (n > 200); p-value was calculated using a two-tailed unpaired Student’s t-test, *** p < 0.001.
Figure 5
Figure 5
NMHC2A pTyr158 controls the dynamic assembly of bipolar filaments in HeLa cells. (A) Representative confocal microscopy timelapse images of Fluorescence Recovery After Photobleaching (FRAP) experiments in HeLa cells ectopically overexpressing either GFP-NMHC2A-WT or -Y158F. Insets of the bleached region in dashed lines. Scale bar, 5 μm. (B) Plot of the normalized mean fluorescence intensity recovery curves obtained for each condition tested (black, WT; green, Y158F). Values are the means ± SEM (n ≥ 40 cells). (C,D) Quantification of the (C) mobile fraction and the (D) half-maximal recovery time (T-half) obtained from the curve fitting of each individual recovery curve. Each dot represents a single cell. Values are the means ± SEM (n ≥ 40 cells); p-values were calculated using a two-tailed unpaired Student’s t-test, * p < 0.05 (E) Representative confocal microscopy images of HeLa cells ectopically expressing either GFP-NMHC2A-WT or -Y158F (green), immunolabeled to detect pMLC (red) and stained with DAPI (blue). Scale bar, 15 µm. (F) Levels of pMLC in cells expressing the different NMHC2A variants, quantified using Fiji™. Each dot corresponds to a single cell. Values are the means ± SEM (n > 300); p-value was calculated using a two-tailed unpaired Student’s t-test, *** p < 0.001. (G) Immunoblot showing the levels of phosphorylated MLC (pMLC) and the total levels of MLC in whole cell lysates of HeLa cells expressing either GFP-NMHC2A-WT or -Y158F. (H) Quantification of pMLC immunoblot signals normalized to that of MLC. Each dot corresponds to an independent experiment. Data correspond to means ± SEM (n = 5); p-value was calculated using a two-tailed unpaired Student’s t-test, * p < 0.05.

Similar articles

Cited by

References

    1. Vicente-Manzanares M., Ma X., Adelstein R.S., Horwitz A.R. Non-muscle myosin II takes centre stage in cell adhesion and migration. Nat. Rev. Mol. Cell Biol. 2009;10:778–790. doi: 10.1038/nrm2786. - DOI - PMC - PubMed
    1. Brito C., Sousa S. Non-Muscle Myosin 2A (NM2A): Structure, Regulation and Function. Cells. 2020;9:1590. doi: 10.3390/cells9071590. - DOI - PMC - PubMed
    1. Heissler S.M., Manstein D.J. Nonmuscle myosin-2: Mix and match. Cell. Mol. Life Sci. 2013;70:1–21. doi: 10.1007/s00018-012-1002-9. - DOI - PMC - PubMed
    1. Liu X., Billington N., Shu S., Yu S.H., Piszczek G., Sellers J.R., Korn E.D. Effect of ATP and regulatory light-chain phosphorylation on the polymerization of mammalian nonmuscle myosin II. Proc. Natl. Acad. Sci. USA. 2017;114:E6516–E6525. doi: 10.1073/pnas.1702375114. - DOI - PMC - PubMed
    1. Kendrick-Jones J., Taylor K.A., Scholey J.M. Phosphorylation of nonmuscle myosin and stabilization of thick filament structure. Methods Enzym. 1982;85:364–370. - PubMed

Publication types

MeSH terms

Grants and funding

This work was funded by FEDER—Fundo Europeu de Desenvolvimento Regional funds through the COMPETE 2020—Operational Program for Competitiveness and Internationalization (POCI), Portugal 2020, by Portuguese funds through FCT—Fundação para a Ciência e a Tecnologia/Ministério da Ciência, Tecnologia e Ensino Superior in the framework of the project POCI-01-0145-FEDER-030863 (PTDC/BIA-CEL/30863/2017). CB, FSM, and JMP were supported by FCT fellowships (SFRH/BD/112217/2015, SFRH/BPD/94458/2013, and SFRH/BD/143940/2019, respectively). CB is a Fulbright and FLAD fellow. SS receives support from the FCT CEEC program (CEECINST/00091/2018/CP1500/CT0006 and 2022.04457.CEECIND). This publication was funded by National Funds through FCT-Fundação para a Ciência e a Tecnologia, I.P., under the project UIDB/04293/2020.

LinkOut - more resources