. 2023 Jul 12:16:1198713.
doi: 10.3389/fnmol.2023.1198713. eCollection 2023.

The PANoptosis-related signature indicates the prognosis and tumor immune infiltration features of gliomas

Affiliations

The PANoptosis-related signature indicates the prognosis and tumor immune infiltration features of gliomas

Jingjing Song et al. Front Mol Neurosci. .

Abstract

Background: Gliomas are the most common primary tumors of the central nervous system, with high heterogeneity and highly variable survival rates. Accurate classification and prognostic assessment are key to the selection of treatment strategies. One hallmark of the tumor is resistance to cell death. PANoptosis, a novel mode of programmed cell death, has been frequently reported to be involved in the innate immunity associated with pathogen infection and played an important role in cancers. However, the intrinsic association of PANoptosis with glioma requires deeper investigation.

Methods: The genetics and expression of the 17 reported PANoptosome-related genes were analyzed in glioma. Based on these genes, patients were divided into two subtypes by consensus clustering analysis. After obtaining the differentially expressed genes between clusters, a prognostic model called PANopotic score was constructed after univariate Cox regression, LASSO regression, and multivariate Cox regression. The expression of the 5 genes included in the PANopotic score was also examined by qPCR in our cohort. The prognostic differences, clinical features, TME infiltration status, and immune characteristics between PANoptotic clusters and score groups were compared, some of which even extended to pan-cancer levels.

Results: Gene mutations, CNVs and altered gene expression of PANoptosome-related genes exist in gliomas. Two PANoptotic clusters were significantly different in prognosis, clinical features, immune characteristics, and mutation landscapes. The 5 genes included in the PANopotic score had significantly altered expression in glioma samples in our cohort. The high PANoptotic score group was inclined to show an unfavorable prognosis, lower tumor purity, worse molecular genetic signature, and distinct immune characteristics related to immunotherapy. The PANoptotic score was considered as an independent prognostic factor for glioma and showed superior prognostic assessment efficacy over several reported models. PANopotic score was included in the nomogram constructed for the potential clinical prognostic application. The associations of PANoptotic score with prognostic assessment and tumor immune characteristics were also reflected at the pan-cancer level.

Conclusion: Molecular subtypes of glioma based on PANoptosome-related genes were proposed and PANoptotic score was constructed with different clinical characteristics of anti-tumor immunity. The potential intrinsic association between PANoptosis and glioma subtypes, prognosis, and immunotherapy was revealed.

Keywords: PANoptosis; PANoptosome; glioma; immune cell infiltration; prognosis.


Conflict of interest statement

The authors declare that the research was conducted in the absence of any commercial or financial relationships that could be construed as a potential conflict of interest.

Figures
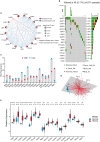
Figure 1
Figure 1
Characterization and alteration of PANoptosome-related genes in glioma. (A) An aggregate of the potential biological interaction of PANoptosome-related genes in glioma. The circle size represented the effect of each gene on the prognosis, and the range of p values calculated by the Log-rank test was p < 0.0001, p < 0.001, p < 0.01, and p < 0.05, respectively. Red dots in the circle are risk factors of prognosis and blue dots in the circle are favorable factors of prognosis. The lines linking genes showed their interactions, and thickness means the correlation strength between them. The positive correlation was marked with red and the negative correlation with blue. (B) The mutation status in 871 glioma patients from TCGA-LGG and TCGA-GBM cohorts. Every waterfall plot represented mutation information of each PANoptosome-related gene. Different colors had corresponding annotations at the bottom which mean different mutation types. The above barplot indicated mutation burden. The right numbers presented mutation frequency individually. (C) Copy number variations (CNVs) frequency of PANoptosome-related genes in TCGA-LGG and TCGA-GBM cohorts. The proportions of different types were shown by the height of the columns. (D) Principal component analysis (PCA) to distinguish gliomas (n = 157) from normal samples (n = 23) in the GSE4290 cohort. (E) The expressions of PANoptosome-related genes between normal tissues (n = 8) and glioma tissues (n = 276) in the GSE16011 cohort (Wilcoxon test, *p < 0.05; **p < 0.01; ***p < 0.001; ****p < 0.0001; ns, not significant).
Figure 2
Figure 2
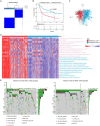
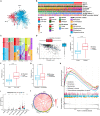
Molecular subtypes of glioma are divided by PANoptosome-related genes. (A) The consensus score matrix of patients with glioma in CGGA cohorts (CGGA-693 and CGGA-325) when k = 2. Two samples would be inclined to be grouped into the same cluster if a higher consensus score was observed between them in different iterations. (B) OS curves for the two PANoptotic clusters based on 626 patients with glioma from CGGA cohorts (CGGA-693 and CGGA-325) (Log-rank test, p < 0.0001). OS, Overall survival. (C) Principal component analysis (PCA) to distinguish cluster 1 (n = 276) from cluster 2 (n = 350) in CGGA cohorts (CGGA-693 and CGGA-325). (D) Heatmap differences of GSVA-based GO enrichment analysis between the two PANoptotic clusters in CGGA cohorts (CGGA-693 and CGGA-325) (Student’s t-tests, ****p < 0.0001). (E) The mutation landscape of PANoptotic cluster 1 and PANoptotic cluster 2 in TCGA cohorts (TCGA-LGG and TCGA-GBM).
Figure 3
Figure 3
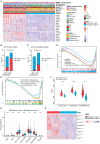
Different PANoptotic clusters showed diverse clinical features and TME infiltration. (A) Unsupervised clustering of PANoptosome-related genes in the CGGA cohorts (CGGA-693 and CGGA-325). The PANoptotic cluster, gender, age, histology, WHO grade, IDH mutation status, 1p19q co-deletion status, and MGMT promoter methylation status were used as patient annotations. Red indicated high expression of genes and blue indicated low expression (Chi-square test, ****p < 0.0001). (B,C) The IDH mutation status and 1p19q co-deletion status of PANoptotic cluster 1 (n = 276) and PANoptotic cluster 2 (n = 350) in CGGA cohorts (CGGA-693 and CGGA-325) (Chi-square test). (D,E) Gene set enrichment analysis (GSEA) in the combined GEO cohort (GSE16011, GSE43378, and GSE43289). (F) Different PANoptotic clusters showed diverse immune scores by ESTIMATE in CGGA cohorts (CGGA-693 and CGGA-325) (Student’s t-test, ****p < 0.0001). (G) The abundance of TME infiltrating cells between the two PANoptotic clusters was analyzed by EPIC in CGGA-693 (Wilcoxon test, **p < 0.01; ****p < 0.0001). (H) Unsupervised clustering of immune checkpoint genes between the two PANoptotic clusters in CGGA cohorts (CGGA-693 and CGGA-325) (Student’s t-test, ***p < 0.001; ****p < 0.0001).
Figure 4
Figure 4
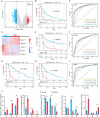
A risk score model based on PANoptotic clusters was constructed to predict the survival of glioma patients. (A) A summary of the differential expressed genes between two PANoptotic clusters in the combined GEO cohort (GSE16011, GSE43378, and GSE43289). (B) OS curves for the high and low PANoptotic score subgroups with the cut-off value 0.3658584 for 347 patients with glioma from the combined GEO cohort (GSE16011, GSE43378, and GSE43289) (Log-rank test, p < 0.0001). (C) The time-dependent receiver operating characteristic curve (ROC) of the PANoptotic score for OS. The area under the curve (AUC) was 0.8053, 0.8869,0.9232 and 0.8919 at 1-year, 2-year, 3-year, and 5-year, respectively, in the combined GEO cohort (GSE16011, GSE43378, and GSE43289). (D) Heatmap of the 5 genes included in the PANoptotic score model of high and low score groups in the combined GEO cohort (GSE16011, GSE43378, and GSE43289) (Student’s t-test, ****p < 0.0001). (E) OS curves for the different PANoptotic score subgroups with the cut-off value 0.3658584 for 626 patients with glioma from CGGA cohorts (CGGA-693 and CGGA-325) (Log-rank test, p < 0.0001). (F) The time-dependent ROC of the PANoptotic score for OS in CGGA (CGGA-693 and CGGA-325). (G,H) OS and PFS curves for the different PANoptotic score subgroups with the cut-off value 0,3,658,584 among 663 glioma samples from TCGA cohorts (TCGA-LGG and TCGA-GBM) (Log-rank test, p < 0.0001). (I) The time-dependent ROC of the PANoptotic score for OS in TCGA cohorts (TCGA-LGG and TCGA-GBM). (J) The mRNA levels of the 5 genes included in PANoptotic score in 3 pairs of glioma and the adjacent relatively normal tissues were measured by real-time PCR (Student’s t-test, *p < 0.05; **p < 0.01).
Figure 5
Figure 5
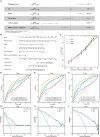
The potential clinical application of the PANoptotic score model and the construction of nomogram. (A) Multivariate Cox regression analysis of PANoptotic score with age, WHO grade, IDH mutation status, 1p19q co-deletion status, and MGMT promoter methylation status in CGGA cohorts (CGGA-693 and CGGA-325). (B) A nomogram based on the multivariate Cox regression analysis for clinical prognosis in CGGA cohorts (CGGA-693 and CGGA-325). (C) The calibration curves of the nomogram for predicting OS at 1, 3, and 5 years in CGGA cohorts (CGGA-693 and CGGA-325). The x-axis means the predicted survival probability from the nomogram, and the y-axis means the actual survival probability. (D–F) Comparison of time-dependent ROC of PANoptotic score and three other previously developed models to evaluate and compare their predictive accuracy at 1, 3, and 5 years in CGGA cohorts (CGGA-693 and CGGA-325). (G–I) Decision curve analysis (DCA) of the nomogram for 1-, 3- and 5-year risk. The x-axis shows the threshold probability, and the y-axis shows the net benefit. The black line means the assumption that no patients died at 1, 3, or 5 years. The green line means the assumption that all patients die at 1, 3, or 5 years. The blue dotted line means the prediction model of the nomogram.
Figure 6
Figure 6
Comparison of differences in clinical features and functional enrichment between the two PANoptotic score groups. (A) Principal component analysis (PCA) to distinguish the high score group (n = 117) from the low score group (n = 509) in CGGA cohorts (CGGA-693 and CGGA-325). (B) Comparison of the distributions of clinical features between the high score group (n = 117) from low score group (n = 509) in CGGA cohorts (CGGA-693 and CGGA-325) (chi-square test, *p < 0.05; ****p < 0.0001). (C) Alluvial diagram showing the changes of PANoptotic clusters, PANoptotic score, WHO grade, histology, gender, and age in CGGA cohorts (CGGA-693 and CGGA-325). (D) Correlation analysis of tumor purity and PANoptotic scores in CGGA cohorts (CGGA-693 and CGGA-325) (Pearson correlation coefficient). (E–G) Comparison of the risk scores of patients with different IDH mutation, 1p19q co-deletion, and MGMT promoter methylation status in CGGA cohorts (CGGA-693 and CGGA-325) (Student’s t-test). (H) GSEA of PANoptotic scores in the combined GEO cohort (GSE16011, GSE43378, and GSE43289). (I) The abundance of TME infiltrating cells between high and low score groups analyzed by EPIC in TCGA cohorts (TCGA-LGG and TCGA-GBM) (Wilcoxon test, ****p < 0.0001). (J) Analyses of the correlation between the PANoptotic scores and immune checkpoints expression in glioma patients in CGGA cohorts (CGGA-693 and CGGA-325) (Pearson correlation coefficient).
Figure 7
Figure 7
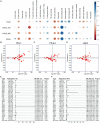
Association of PANoptotic scores with tumor microenvironment immune characteristics and prognosis at the pan-cancer level. (A) The correlation between TME infiltrating cells and PANoptotic scores were analyzed by CIBERSORTx in TCGA and CGGA cohorts (Pearson correlation coefficient, *p < 0.05; **p < 0.01; ***p < 0.001). Sizes of circles indicated relevant correlation coefficients. (B–D) Association of PANoptotic scores with immune checkpoint PD-L1, CTLA-4, and LAG3 in diverse kinds of human tumors from TCGA database. (E,F) Univariate Cox regression analyses to estimate prognostic value (OS/PFS) of PANoptotic score in different cancer types from the TCGA database. The length of the horizontal line means the 95% CI for each group. The vertical dotted line means HR = 1. PFS, progression-free survival.

Similar articles

Cited by

References

    1. Babamale A. O., Chen S. T. (2021). Nod-like receptors: critical intracellular sensors for host protection and cell death in microbial and parasitic infections. Int. J. Mol. Sci. 22:11398. doi: 10.3390/ijms222111398, PMID: - DOI - PMC - PubMed
    1. Boutelle A. M., Attardi L. D. (2021). p53 and tumor suppression: it takes a network. Trends Cell Biol. 31, 298–310. doi: 10.1016/j.tcb.2020.12.011, PMID: - DOI - PMC - PubMed
    1. Charrad M., Ghazzali N., Boiteau V., Niknafs A. (2014). NbClust: an R package for determining the relevant number of clusters in a data set. J. Stat. Softw. 61, 1–36. doi: 10.18637/jss.v061.i06 - DOI
    1. Chen H., Xu C., Yu Q., Zhong C., Peng Y., Chen J., et al. . (2021). Comprehensive landscape of STEAP family functions and prognostic prediction value in glioblastoma. J. Cell. Physiol. 236, 2988–3000. doi: 10.1002/jcp.30060, PMID: - DOI - PubMed
    1. Christgen S., Zheng M., Kesavardhana S., Karki R., Malireddi R. K. S., Banoth B., et al. . (2020). Identification of the PANoptosome: a molecular platform triggering Pyroptosis, apoptosis, and necroptosis (PANoptosis). Front. Cell. Infect. Microbiol. 10:237. doi: 10.3389/fcimb.2020.00237, PMID: - DOI - PMC - PubMed

LinkOut - more resources