. 2023 Nov;17(11):2472-2490.
doi: 10.1002/1878-0261.13499. Epub 2023 Aug 8.

Identifying the personalized driver gene sets maximally contributing to abnormality of transcriptome phenotype in glioblastoma multiforme individuals

Affiliations

Identifying the personalized driver gene sets maximally contributing to abnormality of transcriptome phenotype in glioblastoma multiforme individuals

Jinyuan Xu et al. Mol Oncol. 2023 Nov.

Abstract

High heterogeneity in genome and phenotype of cancer populations made it difficult to apply population-based common driver genes to the diagnosis and treatment of cancer individuals. Characterizing and identifying the personalized driver mechanism for glioblastoma multiforme (GBM) individuals were pivotal for the realization of precision medicine. We proposed an integrative method to identify the personalized driver gene sets by integrating the profiles of gene expression and genetic alterations in cancer individuals. This method coupled genetic algorithm and random walk to identify the optimal gene sets that could explain abnormality of transcriptome phenotype to the maximum extent. The personalized driver gene sets were identified for 99 GBM individuals using our method. We found that genomic alterations in between one and seven driver genes could maximally and cumulatively explain the dysfunction of cancer hallmarks across GBM individuals. The driver gene sets were distinct even in GBM individuals with significantly similar transcriptomic phenotypes. Our method identified MCM4 with rare genetic alterations as previously unknown oncogenic genes, the high expression of which were significantly associated with poor GBM prognosis. The functional experiments confirmed that knockdown of MCM4 could significantly inhibit proliferation, invasion, migration, and clone formation of the GBM cell lines U251 and U118MG, and overexpression of MCM4 significantly promoted the proliferation, invasion, migration, and clone formation of the GBM cell line U87MG. Our method could dissect the personalized driver genetic alteration sets that are pivotal for developing targeted therapy strategies and precision medicine. Our method could be extended to identify key drivers from other levels and could be applied to more cancer types.

Keywords: cancer heterogeneity; driver gene sets; genetic algorithm; integrative analysis; personalization; random walk.


Conflict of interest statement

The authors declare no conflict of interest.

Figures
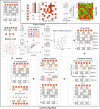
Fig. 1
Fig. 1
The workflow for identifying personalized driver gene sets prioritized by coupling genetic algorithm and random walk. For each cancer individual, all genes with genetic alterations (CNAs or mutations) were collected, genetic algorithm (an optimization algorithm) was used to randomly candidate gene sets from genes with genetic alterations, random walk was used to evaluate the driver effect of each candidate subset on genes in co‐expression protein interaction network, and ssGSEA was used to calculate the enrichment scores of cancer hallmarks based on the stable probabilities of genes as the driver scores (Dscores) of the subset. PCCs were used to measure the consistency between the Dscores of the subset on cancer hallmarks and the dysfunctional enrichment scores (Escores) of cancer hallmarks in transcriptomic change, and the subset with the significant and highest PCC were identified as the personalized driver gene sets for this individual.
Fig. 2
Fig. 2
The extensive heterogeneity in GBM populations. (A) The dysfunctional profile of cancer hallmarks in 378 GBM patients. (B) The correlation of dysfunctional activities among GBM patients. (C) The frequency of CNAs across GBM population. (D) Boxplot for the number of genes with CNAs in GBM patients. (E) The similarity of GBM individuals in CNAs. (F) Boxplot for the distribution of similarity in CNAs. (G) The frequency of mutations across GBM population. (H) Boxplot for the number of genes with mutations in GBM patients. (I) The similarity of GBM individuals in mutations. (J) Boxplot for the distribution of similarity in mutations.
Fig. 3
Fig. 3
The driver gene sets in GBM individuals. (A) The driver genes identified for 98 GBM individuals. (B) The number of driver genes in GBM individuals. (C) The number of GBM individuals with certain numbers of driver genes. (D) The significant correlation coefficients driven by driver gene sets across GBM individuals. (E) The distribution of correlation coefficients across GBM population. (F) The comprehensive driver gene‐hallmark network. Red nodes represent driver genes and orange nodes represent cancer hallmarks.
Fig. 4
Fig. 4
The driver gene set identified by TCGA‐19‐1390. (A) The dysfunctional cancer hallmarks in TCGA‐19‐1390. (B) The correlation between dysfunctional scores and enrichment scores driven by driver genes. (C) The cancer hallmarks were significantly driven by the driver genes. P was calculated by R function cor.test(). (D) The cumulative contributions of driver genes on the dysfunction of cancer hallmarks. (E) The dysfunction of cancer hallmarks driven by the driver genes including PARP1, PDGFRA, DAB1, and CREBL2. (F) The signature E2F_TARGETS cooperatively driven by PARP1, PDGFRA, and CREBL2. (G) The signature G2M_CHECKPOIN cooperatively driven by PARP1 and PDGFRA.
Fig. 5
Fig. 5
Different driver gene sets driving similar transcriptomic phenotypes. (A) The correlation of transcriptomes between TCGA‐19‐1390 and TCGA‐32‐2364. P was calculated by R function cor.test(). (B) The dysfunctional cancer hallmarks in both TCGA‐19‐1390 and TCGA‐32‐2364. (C) The dysfunctional cancer hallmarks significantly enriched by dysregulated transcriptome in GBM individual TCGA‐32‐2364. (D) The correlation between dysfunctional scores and enrichment scores driven by driver genes in GBM individual TCGA‐32‐2364. P was calculated by R function cor.test(). (E) The driver gene sets in TCGA‐19‐1390 and TCGA‐32‐2364. (F) The dysfunction of cancer hallmarks driven by the driver genes, including TP53, RB1, KIT, and LAMA3. (G) The signature E2F_TARGETS cooperatively driven by TP53 and RB1 in TCGA‐32‐2364. (H) The common core genes enriched in E2F_TARGETS driven in TCGA‐19‐1390 and TCGA‐32‐2364.
Fig. 6
Fig. 6
The novel genes of MCM4 and CXCL6 driving the dysfunctional cancer hallmarks in TCGA‐06‐0648. (A) The dysfunctional cancer hallmarks in TCGA‐06‐0648. (B) The correlation between dysfunctional scores and enrichment scores driven by driver genes in GBM individual TCGA‐06‐0648. P was calculated by R function cor.test(). (C) The cumulative contributions of MCM4 and CXCL6 on the dysfunction of cancer hallmarks. (D) The dysfunction of cancer hallmarks driven by MCM4 and CXCL6. (E) High expression of MCM4 were significantly associated with poor GBM prognosis. P was calculated by Log‐rank test.
Fig. 7
Fig. 7
The knockdown of MCM4 in GBM cancer cells. (A) Endogenous MCM4 expression in GBM cell A172, U87MG, U118MG, and U251. (B) SiRNAs could efficiently silence MCM4 expression. (C) The CCK‐8 assay detected the effect of knockdown of MCM4 on cell proliferation of U118MG and U251. (D) Transwell assay detected the effect of knock‐down of MCM4 on cell invasion of U118MG and U251. Scale bars, 40 μm. Magnification ×200. (E) Cell scratch assay detected the effect of knockdown of MCM4 on cell migration of U118MG and U251. Scale bars, 200 μm. Magnification ×200. (F) Clone formation assay detected the effect of knockdown of MCM4 on cell formation abilities of U118MG and U251. NC, normal control; error bars represent standard deviation (SD). Results were summarized as mean ± SD of three independent experiments (*P < 0.05; **P < 0.01; ***P < 0.001, independent Student's t test).
Fig. 8
Fig. 8
The overexpression of MCM4 in GBM cancer cell. (A) Western plot for MCM4 overexpression in GBM cell U87MG. (B) The CCK‐8 assay detected the effect of overexpression of MCM4 on cell proliferation of U87MG. (C) Transwell assay detected the effect of MCM4 overexpression on cell invasion of U87MG. Scale bars, 40 μm. Magnification ×200. (D) Cell scratch assay detected the effect of MCM4 overexpression on cell migration of U87MG. Scale bars, 200 μm. Magnification ×200. (E) Clone formation assay detected the effect of MCM4 overexpression on cell formation abilities of U87MG. NC, normal control; error bars represent standard deviation (SD). Results were summarized as mean ± SD of three independent experiments (**P < 0.01; ***P < 0.001, independent Student's t test).

Similar articles

References

    1. Gerstung M, Jolly C, Leshchiner I, Dentro SC, Gonzalez S, Rosebrock D, et al. The evolutionary history of 2,658 cancers. Nature. 2020;578(7793):122–128. - PMC - PubMed
    1. Pon JR, Marra MA. Driver and passenger mutations in cancer. Annu Rev Pathol. 2015;10:25–50. - PubMed
    1. Dees ND, Zhang Q, Kandoth C, Wendl MC, Schierding W, Koboldt DC, et al. MuSiC: identifying mutational significance in cancer genomes. Genome Res. 2012;22(8):1589–1598. - PMC - PubMed
    1. Ciriello G, Cerami E, Sander C, Schultz N. Mutual exclusivity analysis identifies oncogenic network modules. Genome Res. 2012;22(2):398–406. - PMC - PubMed
    1. Bashashati A, Haffari G, Ding J, Ha G, Lui K, Rosner J, et al. DriverNet: uncovering the impact of somatic driver mutations on transcriptional networks in cancer. Genome Biol. 2012;13(12):R124. - PMC - PubMed