. 2023 Jul 25;9(1):77.
doi: 10.1038/s41421-023-00578-4.

Single-cell transcriptomics reveals intestinal cell heterogeneity and identifies Ep300 as a potential therapeutic target in mice with acute liver failure

Affiliations

Single-cell transcriptomics reveals intestinal cell heterogeneity and identifies Ep300 as a potential therapeutic target in mice with acute liver failure

Jie Yin et al. Cell Discov. .

Abstract

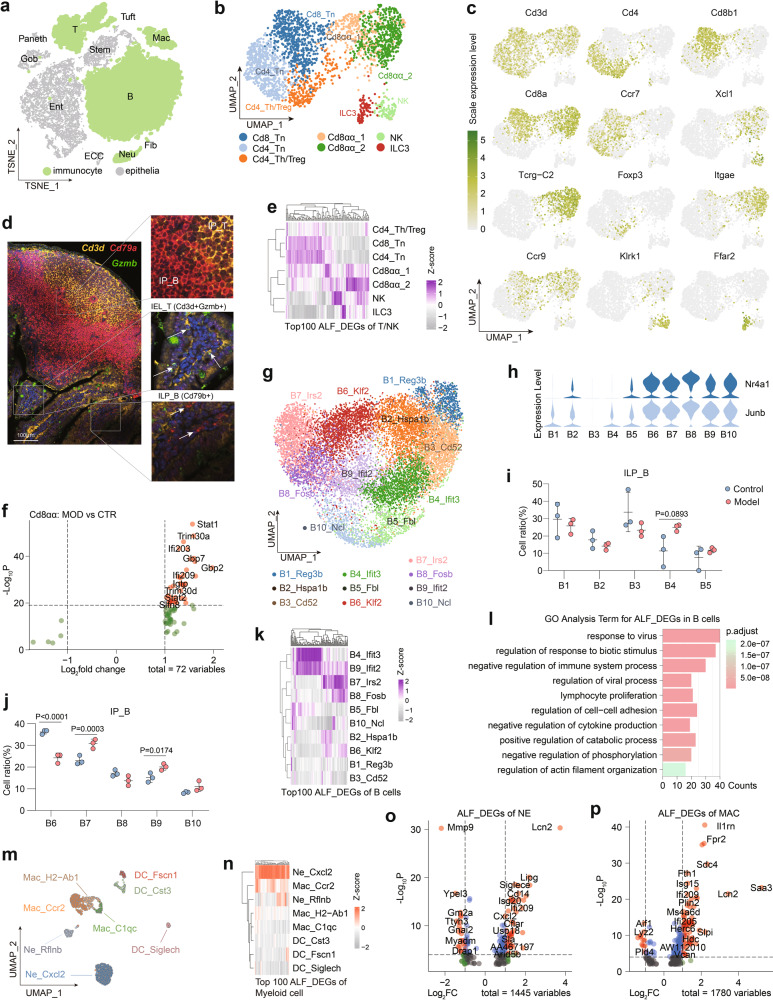
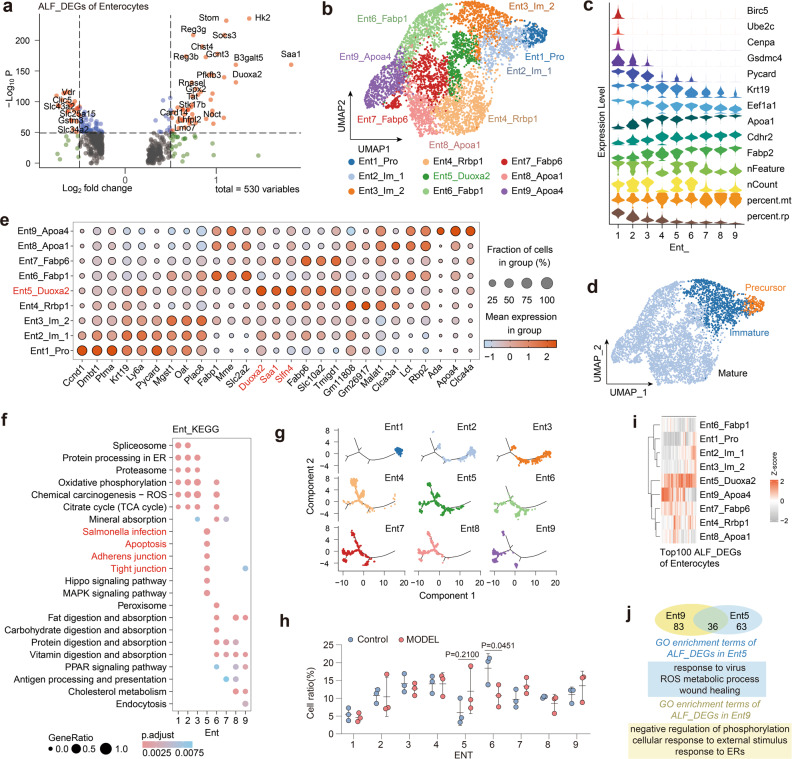
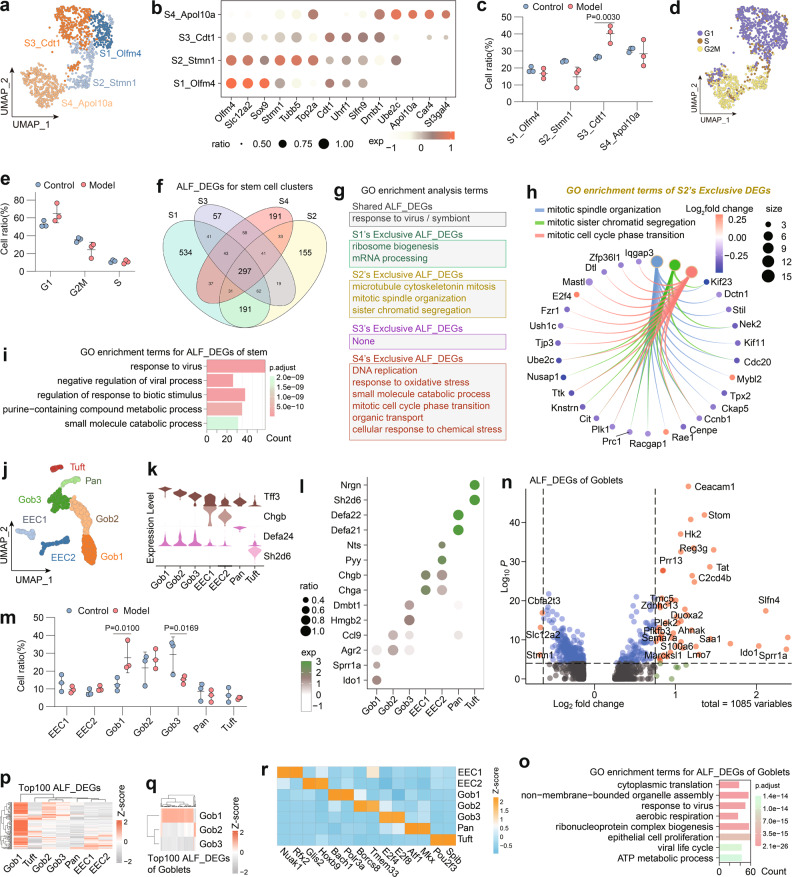
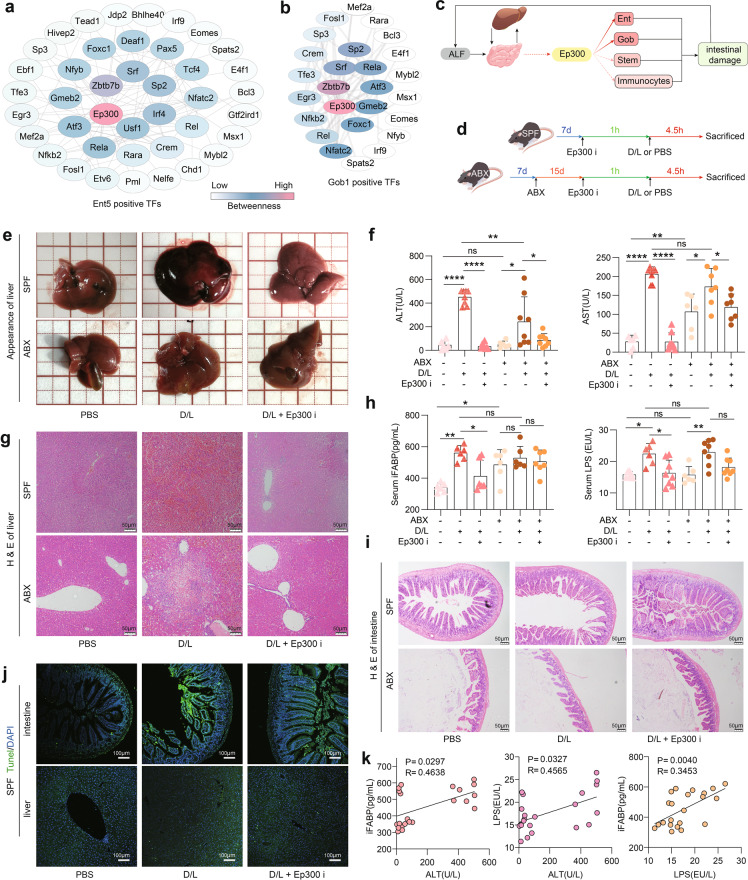
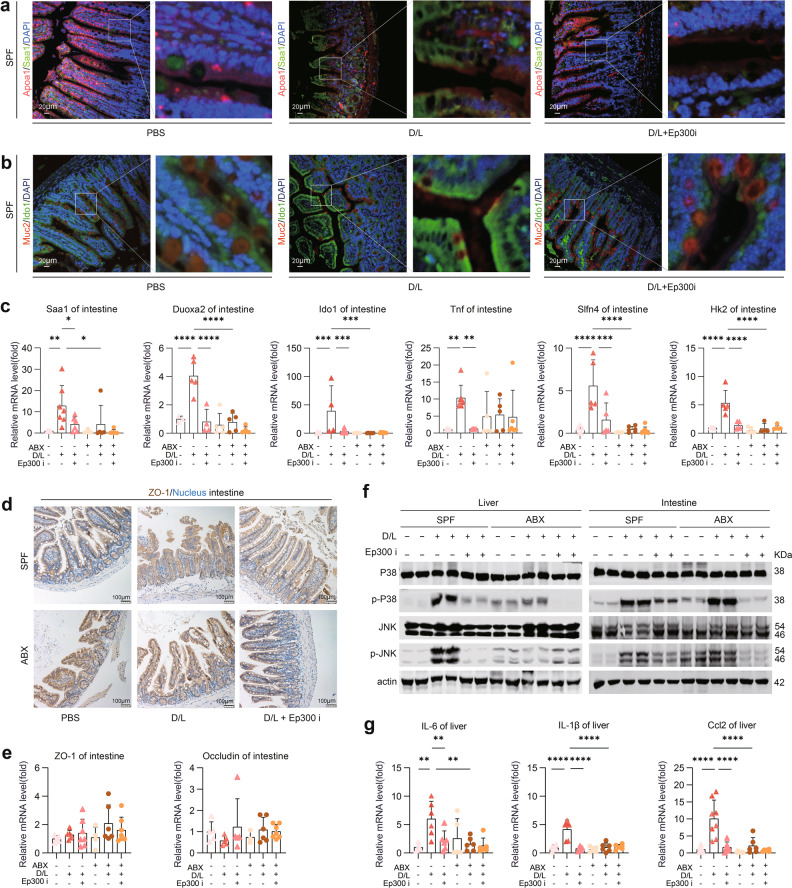
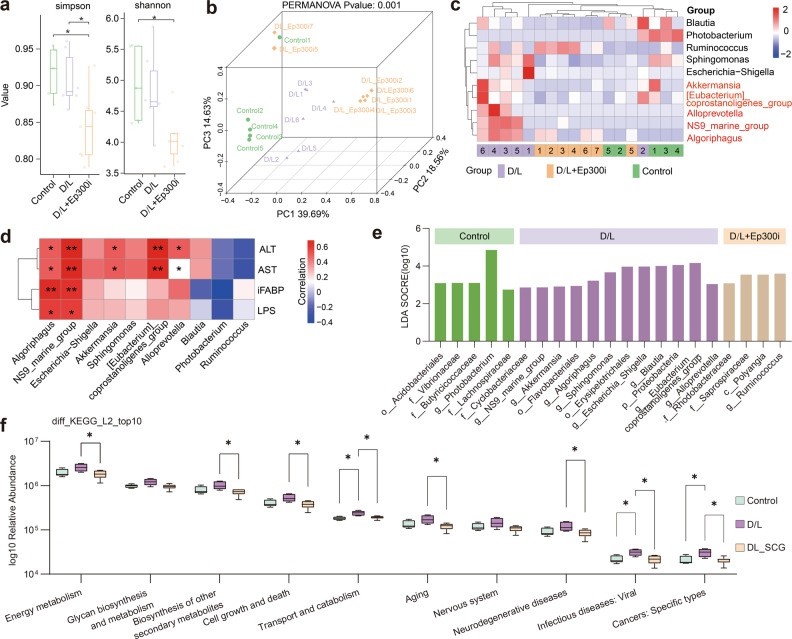
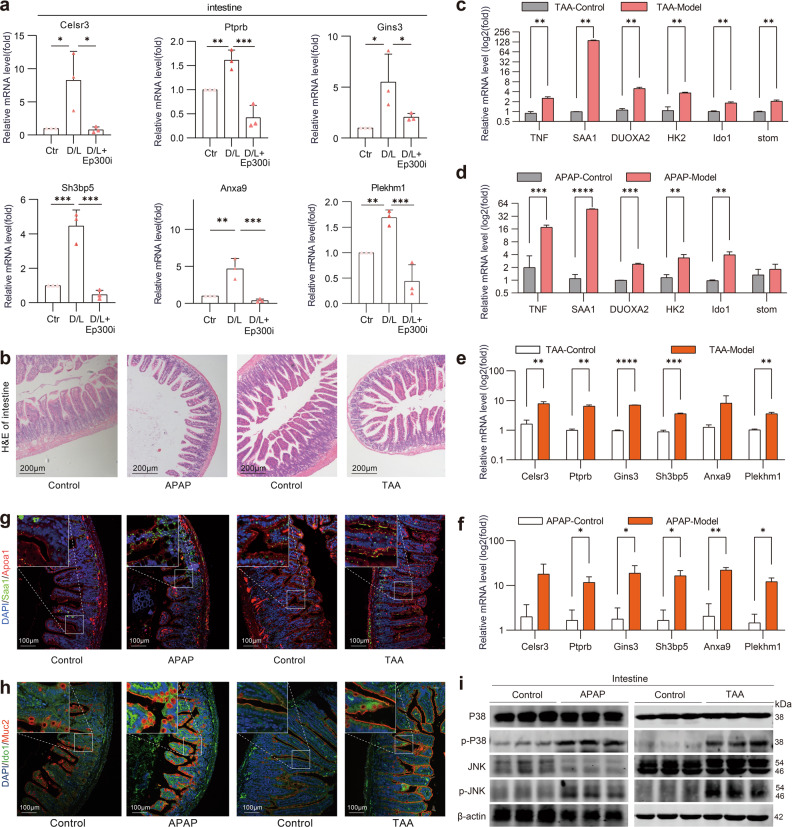
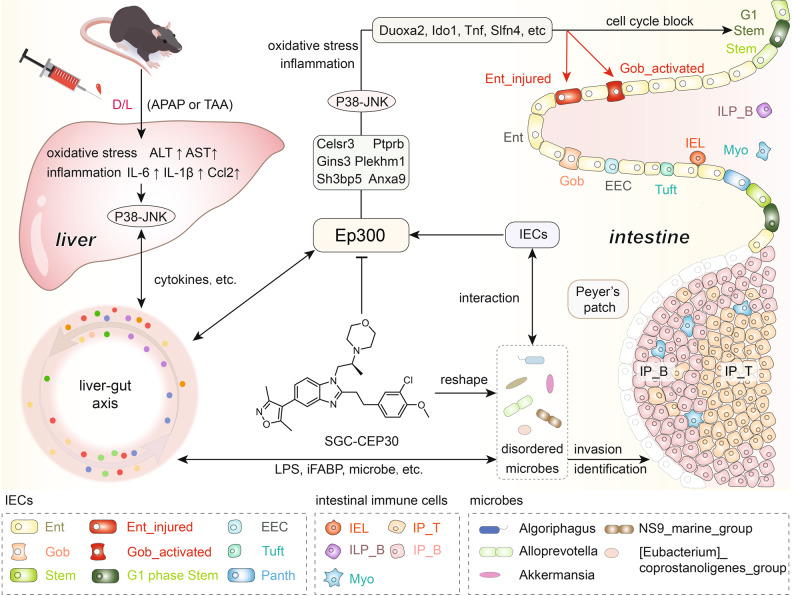
Acute liver failure (ALF) is a severe life-threatening disease associated with the disorder of the gut-liver axis. However, the cellular characteristics of ALF in the gut and related therapeutic targets remain unexplored. Here, we utilized the D-GALN/LPS (D/L)-induced ALF model to characterize 33,216 single-cell transcriptomes and define a mouse ALF intestinal cellular atlas. We found that unique, previously uncharacterized intestinal immune cells, including T cells, B cells, macrophages, and neutrophils, are responsive to ALF, and we identified the transcriptional profiles of these subsets during ALF. We also delineated the heterogeneity of intestinal epithelial cells (IECs) and found that ALF-induced cell cycle arrest in intestinal stem cells and activated specific enterocyte and goblet cell clusters. Notably, the most significantly altered IECs, including enterocytes, intestinal stem cells and goblet cells, had similar activation patterns closely associated with inflammation from intestinal immune activation. Furthermore, our results unveiled a common Ep300-dependent transcriptional program that coordinates IEC activation during ALF, which was confirmed to be universal in different ALF models. Pharmacological inhibition of Ep300 with an inhibitor (SGC-CBP30) inhibited this cell-specific program, confirming that Ep300 is an effective target for alleviating ALF. Mechanistically, Ep300 inhibition restrained inflammation and oxidative stress in the dysregulated cluster of IECs through the P38-JNK pathway and corrected intestinal ecology by regulating intestinal microbial composition and metabolism, thereby protecting IECs and attenuating ALF. These findings confirm that Ep300 is a novel therapeutic target in ALF and pave the way for future pathophysiological studies on ALF.


Conflict of interest statement

The authors declare no competing interests.

Figures

Fig. 1
Fig. 1. Intestinal cell heterogeneity in D/L-induced ALF mice.
a Representative H&E-stained mouse ileal sections. Scale bars, 40 μm. b Schematic overview of the scRNA-seq experiment. c, d UMAP plots of all cells clustered and color-coded by four groups or 12 mice. e Major cell clusters and respective cell-type assignments in UMAP. f Heatmap of marker gene expression in each cell cluster (top three marker genes). g, h Percentages of immune cells in PPs or IE. Means ± SD, two-way ANOVA, n = 6 mice for IE or PPs. i Volcano plot of ALF_DEGs of immune cells. j Top five terms in the GO term enrichment analysis for genes upregulated in immune cells of ALF mice compared to control mice. k Percentages of each type of IECs in control (n = 3) and model (n = 3) mice. Means ± SD, two-way ANOVA. l Volcano plot of ALF_DEGs of IECs. m Top five terms in the GO term enrichment analysis for genes upregulated in IECs of ALF mice compared to control mice.
Fig. 2
Fig. 2. ALF induces intestinal immune cell activation.
a UMAP plot of all immunocytes. b UMAP plot of seven T/NK cell clusters. c Featureplot of key T/NK cell markers used to describe T/NK cell cluster identity and link it to cell type. d Representative images of immunofluorescence (IF) staining for Cd3d, Cd79a and Gzmb in PPs and IE tissues. For all IF analyses, DAPI (blue) was used to stain the nuclei of the cells. Scale bar, 100 μm. e Clustered heatmap of the average expression of the top 100 ALF_DEGs in each T/NK cell cluster. f Volcano plot of ALF_DEGs in Cd8_αα cells. g UMAP plot of eight B cell clusters. h Violin plots showing the expression of Nr4a1 and Junb in B cell clusters. i Percentages of ILP_B cell clusters. Means ± SD, two-way ANOVA. j Percentages of IP_B cell clusters. Means ± SD, two-way ANOVA. k Clustered heatmap of the average expression of the top 100 ALF_DEGs in B cells. l GO term enrichment analysis for upregulated ALF_DEGs in B cells. m UMAP plot of eight myeloid cell clusters. n Clustered heatmap of the average expression of the top 100 ALF_DEGs in myeloid cells. o Volcano plot of ALF_DEGs in neutrophils. p Volcano plot of ALF_DEGs in macrophages. Numbers of mice: model group (n = 3), control group (n = 3).
Fig. 3
Fig. 3. Injured enterocyte cluster in the intestines of D/L-induced ALF mice.
a Volcano plot of ALF_DEGs in enterocytes. b UMAP plot of nine enterocyte clusters. c Violin plot drawn for marker genes and basic quality control information for three levels of maturation of enterocytes. d UMAP plot of three levels of maturation of enterocytes. e Dot plot of gene expression for the top three marker genes of each enterocyte cluster. f KEGG analysis of enterocyte cluster marker genes. g Pseudotime axis of enterocytes with enterocyte clusters distributed on the axes. h Percentages of enterocyte clusters. Means ± SD, two-way ANOVA. i Clustered heatmap of the average expression of the top 100 ALF_DEGs in enterocytes. j Venn diagram of ALF_DEGs and GO terms enrichment analysis of Ent5 and Ent9. Numbers of mice: model group (n = 3), control group (n = 3).
Fig. 4
Fig. 4. ALF induces intestinal stem cell cycle arrest and goblet cell activation.
a UMAP plot of four intestinal stem cell clusters. b Dot plot of the top four marker genes of the intestinal stem cell clusters. c Percentages of intestinal stem cell clusters. Means ± SD, two-way ANOVA. d UMAP plot colored by cell cycle phase based on the results of Scran analysis. e Percentages of intestinal stem cell cycles. Means ± SD, two-way ANOVA. f Venn diagram of ALF_DEGs drawn for each intestinal stem cell cluster. g GO term enrichment analysis for ALF_DEGs of each intestinal stem cell cluster. h Expression of genes related to mitosis in S2 between the control and model mice. i Top five terms in the GO term enrichment analysis for the ALF_DEGs in intestinal stem cells. j UMAP plot of specific IECs. k Violin plots showing key cell markers used to describe goblet cells, EECs, Paneth cells and tuft cells and link them to cell type. l Dot plot of the top two marker genes of specific IECs clusters. m Percentages of specific IECs clusters. Means ± SD, two-way ANOVA. n, o Volcano plot and top five terms in the GO term enrichment analysis for ALF_DEGs in goblet cells. p, q Clustered heatmap of the average expression of the top 100 ALF_DEGs in specific IECs/goblet cells. r Heatmap drawn for TFs specifically activated in specific IECs clusters. Number of mice: model group (n = 3), control group (n = 3).
Fig. 5
Fig. 5. Ep300 inhibition attenuates intestinal and hepatic injury in D/L-induced ALF mice.
a Analysis of the protein–protein interaction network for specific activation of TFs in Ent5 via STRING-Cytoscape. b Analysis of protein–protein interaction networks in Gob1 that specifically activate TFs via STRING-Cytoscape. c Schematic diagram of the mechanism of Ep300 regulation of intestinal cells. d Animal experimental design. e Representative images of the mice livers in each experimental group. f Activity of AST and ALT in mouse serum in the presence or absence of ABX, D/L and Ep300i (means ± SD, two-way ANOVA, ns, no significant difference. *P < 0.05. **P < 0.01. ***P < 0.001. ****P < 0.0001, n = 6–8 mice per group, same as below). g Representative pictures of H&E staining of the mouse liver. Scale bars, 50 μm. h Levels of iFABP and LPS in mouse serum in the presence or absence of ABX, D/L and Ep300i. i Representative pictures of H&E staining of the mouse intestine. Scale bars, 50 μm. j Representative pictures of TUNEL staining of the mouse liver and intestine in the presence or absence of D/L and Ep300i. Scale bars, 100 μm. k Correlation analysis of serum ALT, iFABP and LPS in mice.
Fig. 6
Fig. 6. Ep300 inhibition attenuates ALF in mice by inhibiting specific cell cluster changes via the P38-JNK pathway.
a, b Representative IF images of Apoa1, Saa1, Muc2 and Ido1 in the mouse ileum. Scale bars, 20 μm. c q-PCR analysis of mRNA levels in mouse intestinal (means ± SD, two-way ANOVA. *P < 0.05. **P < 0.01. ***P < 0.001. ****P < 0.0001, n = 5–7 mice, same as below). d Representative immunohistochemistry (IHC) images of ZO-1 in the mouse intestine. Scale bars, 100 μm. e q-PCR analysis of ZO-1 and Occludin mRNA levels in mouse intestinal. f P38, p-P38, JNK and p-JNK expression in mouse liver and intestinal, as analyzed by western blotting assay. g q-PCR analysis of mRNA levels in mouse liver.
Fig. 7
Fig. 7. Ep300 inhibition regulates intestinal microorganism homeostasis.
a Box plot showing the differences in Simpson and Shannon indices between groups (Wilcoxon rank sum test. *P < 0.05). b 3D PCoA plot based on the relative abundance of amplicon sequence variants (ASVs) showing bacterial structural clustering. c Heatmap of the relative abundance of species differing at the genus level (Kruskal–Wallis test). d Correlation analysis of serum biomarkers and differentially distributed species between groups of mice (Kruskal–Wallis test, *P < 0.05. **P < 0.01). e LEfSe showing the differences in abundance between groups. f Box plot of differences in KEGG pathways between groups predicted by PICRUSt2 (Kruskal–Wallis, *P < 0.05).
Fig. 8
Fig. 8. The Ep300-dependent transcriptional program is universal in different mouse ALF models.
a q-PCR analysis of mRNA levels in mouse intestinal. b Representative images of H&E staining of mouse intestinal sections. Scale bar, 200 μm. cf q-PCR analysis of mRNA levels in mouse intestinal. g Representative IF images of Apoa1 and Saa1 in mouse ileum. Scale bars, 100 μm. h Representative IF images of Muc2 and Ido1 in mouse ileum. Scale bars, 100 μm. i P38, p-P38, JNK and p-JNK expression in mouse intestinal as analyzed by western blotting assay.
Fig. 9
Fig. 9. Summary diagram of intestinal cell heterogeneity and the potential mechanism of Ep300i in ALF mice.
Ent enterocytes, Gob goblet cells, IEL intraepithelial lymphocytes, IP_T intestinal PPs T cells, ILP_B intestinal lamina propria B cells, IP_B intestinal PPs B cells, Myo myeloid cells.

Similar articles

Cited by

References

    1. Stravitz RT, Lee WM. Acute liver failure. Lancet. 2019;394:869–881. doi: 10.1016/S0140-6736(19)31894-X. - DOI - PMC - PubMed
    1. Linecker M, et al. Potentially inappropriate liver transplantation in the era of the “sickest first” policy—a search for the upper limits. J. Hepatol. 2018;68:798–813. doi: 10.1016/j.jhep.2017.11.008. - DOI - PubMed
    1. Tilg H, Adolph TE, Trauner M. Gut-liver axis: pathophysiological concepts and clinical implications. Cell Metab. 2022;34:1700–1718. doi: 10.1016/j.cmet.2022.09.017. - DOI - PubMed
    1. Tripathi A, et al. The gut-liver axis and the intersection with the microbiome. Nat. Rev. Gastroenterol. Hepatol. 2018;15:397–411. doi: 10.1038/s41575-018-0011-z. - DOI - PMC - PubMed
    1. Kolodziejczyk AA, et al. Acute liver failure is regulated by MYC- and microbiome-dependent programs. Nat. Med. 2020;26:1899–1911. doi: 10.1038/s41591-020-1102-2. - DOI - PubMed