Review
. 2023 Aug 8;17(15):14347-14405.
doi: 10.1021/acsnano.3c03925. Epub 2023 Jul 24.

Aggregation-Induced Emission (AIE), Life and Health

Haoran Wang  1   2 Qiyao Li  1   3 Parvej Alam  4 Haotian Bai  5 Vandana Bhalla  6 Martin R Bryce  7 Mingyue Cao  8 Chao Chen  2 Sijie Chen  9 Xirui Chen  10 Yuncong Chen  11 Zhijun Chen  12 Dongfeng Dang  13 Dan Ding  14 Siyang Ding  15 Yanhong Duo  16 Meng Gao  17 Wei He  2 Xuewen He  18 Xuechuan Hong  19 Yuning Hong  15 Jing-Jing Hu  20 Rong Hu  21 Xiaolin Huang  10 Tony D James  22 Xingyu Jiang  23 Gen-Ichi Konishi  24 Ryan T K Kwok  2 Jacky W Y Lam  2 Chunbin Li  25 Haidong Li  26 Kai Li  27 Nan Li  28 Wei-Jian Li  29 Ying Li  30 Xing-Jie Liang  31   32 Yongye Liang  33 Bin Liu  34 Guozhen Liu  35 Xingang Liu  34 Xiaoding Lou  20 Xin-Yue Lou  36 Liang Luo  37 Paul R McGonigal  38 Zong-Wan Mao  39 Guangle Niu  8 Tze Cin Owyong  15 Andrea Pucci  40 Jun Qian  41 Anjun Qin  3 Zijie Qiu  1 Andrey L Rogach  42 Bo Situ  43 Kazuo Tanaka  44 Youhong Tang  45 Bingnan Wang  3 Dong Wang  46 Jianguo Wang  25 Wei Wang  29 Wen-Xiong Wang  47 Wen-Jin Wang  39   48 Xinyuan Wang  33 Yi-Feng Wang  31   32 Shuizhu Wu  49 Yifan Wu  30 Yonghua Xiong  10 Ruohan Xu  13 Chenxu Yan  50 Saisai Yan  46 Hai-Bo Yang  29 Lin-Lin Yang  1 Mingwang Yang  2 Ying-Wei Yang  36 Juyoung Yoon  51 Shuang-Quan Zang  27 Jiangjiang Zhang  23   52 Pengfei Zhang  53 Tianfu Zhang  32 Xin Zhang  54   55 Xin Zhang  35 Na Zhao  28 Zheng Zhao  1 Jie Zheng  56 Lei Zheng  43 Zheng Zheng  57 Ming-Qiang Zhu  58 Wei-Hong Zhu  50 Hang Zou  43 Ben Zhong Tang  1   2
Affiliations
Review

Aggregation-Induced Emission (AIE), Life and Health

Haoran Wang et al. ACS Nano. .

Abstract

Light has profoundly impacted modern medicine and healthcare, with numerous luminescent agents and imaging techniques currently being used to assess health and treat diseases. As an emerging concept in luminescence, aggregation-induced emission (AIE) has shown great potential in biological applications due to its advantages in terms of brightness, biocompatibility, photostability, and positive correlation with concentration. This review provides a comprehensive summary of AIE luminogens applied in imaging of biological structure and dynamic physiological processes, disease diagnosis and treatment, and detection and monitoring of specific analytes, followed by representative works. Discussions on critical issues and perspectives on future directions are also included. This review aims to stimulate the interest of researchers from different fields, including chemistry, biology, materials science, medicine, etc., thus promoting the development of AIE in the fields of life and health.

Keywords: aggregation-induced emission; bioimaging; biomedical application; combined therapy; detection; luminescent material; monitoring; phototheranostics; precision medicine.


Conflict of interest statement

The authors declare no competing financial interest.

Figures

Scheme 1
Scheme 1. Schematic Illustration of AIEgens in Phototheranostics Based on the Jablonski Diagram
Scheme 2
Scheme 2. Timeline with the Critical Milestones in the Historical Development of AIE in Life Science and Health
Figure 1
Figure 1
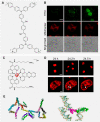
(A) Chemical structure of ID-IQ. (B–G) ID-IQ (yellow) labeled the boundary of chromosomes, which can facilitate segregation of overlapping and touching chromosomes (B–D). The centromere position (indicated by arrows) was clearly distinguished with the help of ID-IQ. These features cannot be easily achieved by Hoechst staining (blue). Scale bars: 1 μm. (H) Fluorescence image of lymphocyte chromosomes costained by ID-IQ (yellow), DAPI (blue), and the chromosome 4q telomere FISH probe (red). (I–N) Enlarged images from panel H. The telomere FISH probe labeled the end of the chromosome outlined by ID-IQ. Scale bars: 5 μm. Adapted with permission from ref (113). Copyright 2020 Wiley-VCH. (O) Photoactivatable dihydro-2-azafluorenones for LDs-specific imaging. Scale bar: 20 μm. Adapted with permission under a Creative Commons Attribution 3.0 Unported License from ref (114). Copyright 2017 The Royal Society of Chemistry. (P) In situ generated DH-HBT for photoactivatable LDs and lysosomes imaging. Adapted with permission under a Creative Commons Attribution 3.0 Unported License from ref (115). Copyright 2018 The Royal Society of Chemistry.
Figure 2
Figure 2
(A) Plots of relative fluorescence intensity (I/I0) for BODIPY 493/503 and DTPA-BT-M in HeLa cells by the continuous scanning via a depletion laser in STED nanoscopy over 30 min. Adapted with permission from ref (123). Copyright 2021 The Royal Society of Chemistry. (B) Fluorescence image of fixed HeLa cell costained with DAPI (blue), Alexa Fluor488-phalloidin (green), and DTPA-BT-F NCs (red) via STED nanoscopy. Scale bar: 5 μm. (C,D) Magnified fluorescence images and their corresponding PL intensities of (C) ROI 1 (Alexa Fluor488-phalloidin) and (D) ROI 2 (DTPA-BT-F NCs). Scale bars: 500 nm. Adapted with permission from ref (127). Copyright 2022 The Royal Society of Chemistry.
Figure 3
Figure 3
(A,B) Time-lapse STED imaging of mitochondrial dynamics (fission: yellow and white arrow; fusion: indigo arrow) in DTPAP-P labeled HeLa cells. The inset values are the precise time points. Scale bars: 2.5 μm. (C,D) Time-dependent fluorescence images of HeLa cells stained by (C) DAPI, (D) DTPAP-P in STED, and (E) their merged fields. The inset values in panel E are their corresponding Pearson’s correlation coefficients. Scale bar: 10 μm. Adapted with permission from ref (128). Copyright 2022 American Chemical Society.
Figure 4
Figure 4
(A) The real-time monitoring of the lysosomal morphology in A549 cells. Scale bar: 10 μm. Adapted with permission under a Creative Commons Attribution 3.0 Unported License from ref (131). Copyright 2015 The Royal Society of Chemistry. (B) Visualization of autophagosomal-lysosomal fusion under two-photon excitation. Scale bar: 10 μm. Adapted with permission from ref (132). Copyright 2014 Wiley-VCH. (C) Dynamic monitoring of the autophagy of the endoplasmic reticulum. Scale bar: 5 μm. Adapted with permission under a Creative Commons CC BY License from ref (133). Copyright 2021 Oxford University Press. (D) Real-time tracking of mitochondria in HeLa cells for different time intervals. R = CH2CH2CH2CH3. Scale bar: 20 μm. Adapted with permission from ref (137). Copyright 2015 Elsevier.
Figure 5
Figure 5
(A) Chemical structure of TPCI. (B) Time-lapse CLSM images of irradiated TPCI-pretreated living HeLa cells costained with MitoTracker. Time interval: 5 s. Scale bar: 13 μm. Adapted with permission from ref (160). Copyright 2019 Wiley-VCH. (C) Chemical structure of DNA light-switching ruthenium complex. (D) DNA aggregation in living cells visualized by confocal microscopy (top, scale bar: 20 μm) and super-resolution Airyscan (bottom, scale bar: 2 μm) at different time intervals. (E) Computer simulation of the induced DNA aggregation mechanism in all-atom MD simulation systems. Adapted with permission from ref (162). Copyright 2021 American Chemical Society.
Figure 6
Figure 6
(A) Chemical structure of P(TPE-2OEG). (B,C) CLSM images of HeLa cells incubated with (B) P(TPE-2OEG) and (C) M(TPE-2OEG) after being treated with 500 μM H2O2 for 6 h and followed by staining with Annexin V-FITC and PI for 5 min. Scale bar: 20 μm. Adapted with permission from ref (171). Copyright 2020 Elsevier. (D) Chemical structure of PTB-EDTA. (E,F) Representative photos of (E) Alizarin Red S staining and (F) PTB-EDTA at indicated differentiation times. Scale bars: 100 μm. Adapted with permission from ref (172). Copyright 2020 Elsevier. (G) Illustration of the intracellular spontaneous amino-yne click polymerization and chemical structure of poly(β-aminoacrylate). (H) CLSM images of HeLa cells with different treatments. (I) CLSM images of HeLa cells with intracellular polymerization followed by Alexa 546 phalloidin labeling. Scale bar: 10 μm. Adapted with permission from ref (173). Copyright 2019 Springer Nature.
Figure 7
Figure 7
(A) Chemical structure of PM-ML. (B) A schematic illustration of an axon wrapped by a myelin sheath. (C) A segment of teased sciatic nerve fibers stained with PM-ML. The inset shows an enlarged region with Schmidt-Lanterman incisures (arrowhead) and a node of Ranvier (asterisk). Scale bar: 5 μm. (D–F) Three-dimensional rendering of Z-stacks of caudal putamen in the optically cleared mouse brain stained with (D) FluoroMyelin Green, (E) FluoroMyelin Red, and (F) PM-ML. Scale bars: 20 μm. (G) Overlaid images of sagittal sections in the cerebellum of wild-type (WT) or shiverer homozygous (Mbpshi/Mbpshi) mice stained with PM-ML (red) and Hoechst 33342 (blue). Scale bars: 50 μm. Adapted with permission from ref (193). Copyright 2021 The National Academy of Sciences.
Figure 8
Figure 8
(A) Chemical structures and emission peaks of QM-based AIEgens in their aggregate states. (B) Transmission electron microscopy and confocal laser scanning microscopy images of the QM-2 and QM-5. (C) NIR fluorescence imaging of tumor-bearing mice after intravenous injection of QM-2 (top) and QM-5 (bottom). (D) The 3D fluorescence imaging of tumor-bearing mice after intravenous injection of QM-5. Adapted with permission from ref (229). Copyright 2015 Wiley-VCH. (E) Illustration of the morphology and size tuning by FNP and their effects on tumor cell imaging of zebrafish. Adapted with permission from ref (230). Copyright 2018 American Chemical Society.
Figure 9
Figure 9
(A) Chemical Structures of the NIR-II fluorophores IR-FX and IR-FXP. (B) Optimized ground-state geometries of IR-FE and IR-FT and their powder fluorescence photograph. Adapted with permission from ref (233). Copyright 2017 Wiley-VCH. (C) Illustration of the encapsulation method for p-FE. (D) 3D imaging of brain vasculature of a mouse injected with p-FE. Exposure time: 5 ms. Scale bar: 6 mm. Adapted with permission under a Creative Commons CC BY License from ref (237). Copyright 2018 Springer Nature.
Figure 10
Figure 10
(A) Fluorescence images of the gastrointestinal tract in BALB/c mice gavaged with HLZ-BTED dots for visualizing intestinal obstruction. (B,C) NIR-II images of (B) the GI tract in normal mice or mice with intestinal obstruction at 5 h after gavage and (C) the GI tract in BALB/c mice that are normal or anesthetized by pentobarbital sodium at 2 h after gavage. Adapted with permission from ref (250). Copyright 2019 The Royal Society of Chemistry. (D) In vivo NIR-IIb imaging for ischemic stroke. Adapted with permission from ref (253). Copyright 2022 CCS Chemistry.
Figure 11
Figure 11
(A) Through-thinned skull cerebrovascular microimaging. (B) NIR-IIb fluorescence GI imaging. Scale bar: 5 mm. Adapted with permission from ref (255). Copyright 2021 Wiley-VCH.
Figure 12
Figure 12
(A) Schematic of preparation of an ONOO-activated NIR afterglow nanoprobe. (B) A series of reactions occurred within the NP for NIR afterglow luminescence. (C,D) Representative afterglow images of the inflammatory sites after injection (in situ) with preirradiated afterglow nanoprobes dissolved in (C) Milli-Q water or (D) 5× PBS buffer at various time points. (E) Representative images of afterglow and fluorescence imaging of a mouse model bearing with left ear allergy while right ear inflammation. Adapted with permission from ref (268). Copyright 2022 American Chemical Society.
Figure 13
Figure 13
(A) NIR-IIa image-guided tumor resection in mouse models. Adapted with permission from ref (270). Copyright 2020 American Chemical Society. (B) NIR-IIb imaging of biliary injuries in rabbit models. Adapted with permission from ref (271). Copyright 2021 American Chemical Society. (C) NIR-IIb detection of the complete uterine obstruction in mouse models. Scale bar: 10 mm. Adapted with permission from ref (272). Copyright 2021 Elsevier. (D) NIR-II and visible fluorescence hybrid image-guided surgery of the mesenteric lymph nodes in rabbit models. Scale bars: 1 cm. Adapted with permission from ref (273). Copyright 2022 Elsevier.
Figure 14
Figure 14
(A) Density functional theory (DFT) calculations of BDP dyes. (B) Tumor imaging and antitumor results treated with BDP-5 nanoparticles. Adapted with permission from ref (381). Copyright 2020 Wiley-VCH. (C) Molecular design approach of AIEgen TPA-S-TPP and its antitumor mechanism. Adapted with permission under a Creative Commons Attribution 3.0 Unported License from ref (382). Copyright 2021 The Royal Society of Chemistry.
Figure 15
Figure 15
Schematic illustration of the GA-targeting mechanism and apoptotic pathway induced by ROS generation. Adapted with permission under a Creative Commons CC BY License from ref (383). Copyright 2022 Springer Nature.
Figure 16
Figure 16
(A) Schematic illustration of ferroptosis-combined oxygen self-sufficient PDT. Adapted with permission from ref (397). Copyright 2022 Elsevier. (B) Chemical structure of TCSVP and the proposed mechanism of enhancing ferroptosis by mitochondrial oxidative stress via AIEgen treatment. (C) Lipid peroxidation (LPO) levels of PLC cells with different treatments. (D) Cell viability of PLC cells with different treatments. (E) Intracellular level of Fe2+ and (F) GPX4 activities of PLC cells with the corresponding treatments. Adapted with permission from ref (398). Copyright 2022 Springer Nature.
Figure 17
Figure 17
(A) CLSM image of 4T1 cancer cells stained with TPE-DPA-TCyP. Scale bar: 10 μm. (B) Representative CLSM image of ecto-calreticulin expression after TPE-DPA-TCyP PDT treatment (DAPI; blue fluorescence). Scale bar: 10 μm. (C) Released ATP and HMGB1 levels of 4T1 cancer cells with different treatments. (D) Schematic illustration of ICD initiation by focused mitochondrial oxidative stress via TPE-DPA-TCyP. (E) Tumor volume during the vaccine experiment. Adapted with permission from ref (403). Copyright 2019 Wiley-VCH.
Figure 18
Figure 18
(A) Molecular design of ITB, ITT, BITB, and BITT. (B) Schematic illustration of NIR-II FLI-guided synergistic PDT-PTT phototherapies with BITT dots. Adapted with permission from ref (422). Copyright 2020 Wiley-VCH. (C) The molecular design (TI, TSI, and TSSI) and illustration of the formation process of TSSI NPs. Adapted with permission from ref (425). Copyright 2020 Wiley-VCH. (D) Schematic illustration of the design principle of NIR-II AIEgens by D/π-bridge manipulation as well as the corresponding construction and photoexcitation of DPBTA-DPTQ NPs. Adapted with permission from ref (428). Copyright 2021 Wiley-VCH.
Figure 19
Figure 19
(A) Schematic illustration of molecular engineering strategies used to design type I PSs and photothermal reagents. Adapted with permission from ref (429). Copyright 2022 American Chemical Society. (B) Schematic illustration of design strategy for NIR-II phototheranostic agents by controlling molecular packing of 4MNVDPP and 6MNVDPP. Adapted with permission from ref (430). Copyright 2022 Wiley-VCH. (C) Schematic demonstration of fluorination strategy for designing A-D-A type NIR-II photothermal agents with synchronously improved QY and PCE. Adapted with permission from ref (431). Copyright 2023 Wiley-VCH.
Figure 20
Figure 20
(A) Chemical structure of TACQ and its bioapplications. (B) TEM images of HeLa cells untreated/treated with TACQ. Adapted with permission from ref (432). Copyright 2021 American Chemical Society. (C) The processes of GCP/miR-140 NPs deep down-regulate the PD-L1 expression. Adapted with permission from ref (442). Copyright 2022 Wiley-VCH.
Figure 21
Figure 21
Schematic illustration of the preparation and assembly process of NK-cell-mimic AIE nanoparticles (NK@ AIEdots) and the “smart” tight-junction (TJ)-modulated blood brain barrier penetration of NK@AIEdots for brain tumor targeted light-up and inhibition. Adapted with permission from ref (444). Copyright 2020 American Chemical Society.
Figure 22
Figure 22
(A) Schematic of DTF-FFP NPs activated by HClO produced by phagocytes to effectively image and ablate the bacteria inside phagocytes. Adapted with permission from ref (464). Copyright 2020 Wiley-VCH. (B) Schematic representation and confocal images of TPEPy-d-Ala for detecting and ablating intracellular bacteria. Adapted with permission from ref (470). Copyright 2020 Wiley-VCH. (C) After binding with the bacterial membrane phospholipids, TBP-1 killed extracellular S. aureus by inducing ROS generation. Meanwhile, TBP-1 induced the autophagy of epithelial cells through regulating mitochondria to accelerate the clearance of intracellular S. aureus. Adapted with permission from ref (472). Copyright 2021 Wiley-VCH. (D) TTTh achieved a high photodynamic killing efficacy toward both extracellular and intracellular S. aureus by disrupting the bacterial membrane integrity and inducing the lysosomal maturation. Adapted with permission from ref (474). Copyright 2022 Wiley-VCH.
Figure 23
Figure 23
(A) AIE-active strategy. (B) QM-based Aβ probe QM-FN-SO3. Adapted with permission from ref (498). Copyright 2019 American Chemical Society. (C) Enzyme-activatable AIE probes: QM-βgal for β-galactosidase, QM-NHαfuc for α-l-fucosidase, DQM-ALP for hydrophilic alkaline phosphatase, and QM-GFTN for Atg4B protease. (D) QM-based probe QM-HSP-CPP for intraoperative pathological fluorescent diagnosis of pancreatic cancer via specific cathepsin E. Adapted with permission from ref (506). Copyright 2022 Wiley-VCH.
Figure 24
Figure 24
(A) Schematic illustration of the AIEgen-based fluorescent aptasensor for detecting intracellular IFN-γ. Adapted with permission from ref (524). Copyright 2018 American Chemical Society. (B) Bright-field and NIR-II fluorescent images and othogonal-view 3D MSOT images of liver ischemia-reperfusion injury in mouse model by the nanoprobe BTPE-NO2@F127. Adapted with permission under a Creative Commons CC BY License from ref (533). Copyright 2021 Springer Nature. (C) Orthogonal-view 3D MSOT images of ulcerative colitis by the nanosystem QM@EP. Adapted with permission from ref (534). Copyright 2022 Elsevier. (D) Bright-field and NIR-II fluorescent images of breast cancer metastasis in mouse model by the nanoprobe NP-Q-NO2. Adapted with permission from ref (535). Copyright 2020 Wiley-VCH.
Figure 25
Figure 25
(A) Schematic illustration of the fluorescent and plasmonic colorimetric dual modality for virus detection. Adapted with permission from ref (538). Copyright 2018 American Chemical Society. (B) Schematic illustration of the test strip developed for the detection of IgM and IgG against SARS-CoV-2 in a human serum sample. Adapted with permission from ref (540). Copyright 2021 American Chemical Society.
Figure 26
Figure 26
(A) Schematic illustration of preparation of a H+ASQ-loaded paper chip and their use in real-time and visual biogenic amine monitoring. Adapted with permission from ref (548). Copyright 2022 Elsevier. (B) The design of an aptamer beacon and its application for the label-free detection of AFB1. Adapted with permission from ref (557). Copyright 2018 American Chemical Society.
Figure 27
Figure 27
(A) Schematic of the 4MC-integrated microfluidic paper-based analytical device (4MC-μPAD). Adapted with permission from ref (563). Copyright 2020 Wiley-VCH. (B) Schematic assay protocol and detection setup for the AIE-based POCT method for one drop of urine. Adapted with permission from ref (565). Copyright 2022 American Chemical Society.

Similar articles

Cited by

References

    1. Urdea M.; Penny L. A.; Olmsted S. S.; Giovanni M. Y.; Kaspar P.; Shepherd A.; Wilson P.; Dahl C. A.; Buchsbaum S.; Moeller G.; Hay Burgess D. C. Requirements for high impact diagnostics in the developing world. Nature 2006, 444 (1), 73–79. 10.1038/nature05448. - DOI - PubMed
    1. Lee G.-H.; Moon H.; Kim H.; Lee G. H.; Kwon W.; Yoo S.; Myung D.; Yun S. H.; Bao Z.; Hahn S. K. Multifunctional materials for implantable and wearable photonic healthcare devices. Nature Reviews Materials 2020, 5 (2), 149–165. 10.1038/s41578-019-0167-3. - DOI - PMC - PubMed
    1. Bujalkova M.; Straka S.; Jureckova A. Hippocrates’ humoral pathology in nowaday’s reflections. Bratislavske lekarske listy 2001, 102 (10), 489–492. - PubMed
    1. World Health Organization . WHO international standard terminologies on traditional medicine in the Western Pacific Region; WHO Regional Office for the Western Pacific: Manila, 2007.
    1. Matlin S. A.; Mehta G.; Krief A.; Hopf H. The Chemical Sciences and Health: Strengthening Synergies at a Vital Interface. ACS Omega 2017, 2 (10), 6819–6821. 10.1021/acsomega.7b01463. - DOI - PMC - PubMed

Publication types