Genomic signatures suggesting adaptation to ocean acidification in a coral holobiont from volcanic CO2 seeps
- PMID: 37481685
- PMCID: PMC10363134
- DOI: 10.1038/s42003-023-05103-7
Genomic signatures suggesting adaptation to ocean acidification in a coral holobiont from volcanic CO2 seeps
Abstract
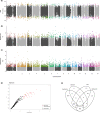
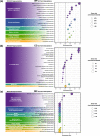
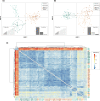
Ocean acidification, caused by anthropogenic CO2 emissions, is predicted to have major consequences for reef-building corals, jeopardizing the scaffolding of the most biodiverse marine habitats. However, whether corals can adapt to ocean acidification and how remains unclear. We addressed these questions by re-examining transcriptome and genome data of Acropora millepora coral holobionts from volcanic CO2 seeps with end-of-century pH levels. We show that adaptation to ocean acidification is a wholistic process involving the three main compartments of the coral holobiont. We identified 441 coral host candidate adaptive genes involved in calcification, response to acidification, and symbiosis; population genetic differentiation in dinoflagellate photosymbionts; and consistent transcriptional microbiome activity despite microbial community shifts. Coral holobionts from natural analogues to future ocean conditions harbor beneficial genetic variants with far-reaching rapid adaptation potential. In the face of climate change, these populations require immediate conservation strategies as they could become key to coral reef survival.
© 2023. The Author(s).
Conflict of interest statement
The authors declare no competing interests.
Figures


Similar articles
-
Decline of a distinct coral reef holobiont community under ocean acidification.Microbiome. 2024 Apr 17;12(1):75. doi: 10.1186/s40168-023-01683-y. Microbiome. 2024. PMID: 38627822 Free PMC article.
-
Transcriptomic Changes in Coral Holobionts Provide Insights into Physiological Challenges of Future Climate and Ocean Change.PLoS One. 2015 Oct 28;10(10):e0139223. doi: 10.1371/journal.pone.0139223. eCollection 2015. PLoS One. 2015. PMID: 26510159 Free PMC article.
-
Functional genomic analysis of corals from natural CO2 -seeps reveals core molecular responses involved in acclimatization to ocean acidification.Glob Chang Biol. 2018 Jan;24(1):158-171. doi: 10.1111/gcb.13833. Epub 2017 Sep 5. Glob Chang Biol. 2018. PMID: 28727232
-
The effects of ocean acidification on fishes - history and future outlook.J Fish Biol. 2023 Oct;103(4):765-772. doi: 10.1111/jfb.15323. Epub 2023 Feb 2. J Fish Biol. 2023. PMID: 36648022 Review.
-
Projecting coral reef futures under global warming and ocean acidification.Science. 2011 Jul 22;333(6041):418-22. doi: 10.1126/science.1204794. Science. 2011. PMID: 21778392 Review.
Cited by
-
Population genomic structure of the sea urchin Diadema africanum, a relevant species in the rocky reef systems across the Macaronesian archipelagos.Sci Rep. 2024 Sep 28;14(1):22494. doi: 10.1038/s41598-024-73354-3. Sci Rep. 2024. PMID: 39341905 Free PMC article.
References
-
- Doney SC, Schimel DS. Carbon and climate system coupling on timescales from the Precambrian to the Anthropocene. Annu Rev. Env. Resour. 2007;32:31–66. doi: 10.1146/annurev.energy.32.041706.124700. - DOI
-
- Khatiwala S, et al. Global ocean storage of anthropogenic carbon. Biogeosciences. 2013;10:2169–2191. doi: 10.5194/bg-10-2169-2013. - DOI
-
- Friedlingstein P, et al. Global carbon budget 2021. Earth Syst. Sci. Data. 2022;14:1917–2005. doi: 10.5194/essd-14-1917-2022. - DOI
-
- Knowlton, N. et al. Coral reef biodiversity. in Life in the World’s oceans: diversity, distribution, and abundance. (ed. Mcintyre, A. D.) 65–79 (Oxford, UK: Wiley-Blackwell, 2010).
Publication types
MeSH terms
Substances
LinkOut - more resources
Full Text Sources

