. 2023 Sep:234:109585.
doi: 10.1016/j.exer.2023.109585. Epub 2023 Jul 21.

Retinal gliosis and phenotypic diversity of intermediate filament induction and remodeling upon acoustic blast overpressure (ABO) exposure to the rat eye

Affiliations

Retinal gliosis and phenotypic diversity of intermediate filament induction and remodeling upon acoustic blast overpressure (ABO) exposure to the rat eye

Lara A Skelton et al. Exp Eye Res. 2023 Sep.

Abstract

Traumatic brain injury (TBI) caused by acoustic blast overpressure (ABO) is frequently associated with chronic visual deficits in military personnel and civilians. In this study, we characterized retinal gliotic response in adult male rats following a single ABO exposure directed to one side of the head. Expression of gliosis markers and intermediate filaments was assessed at 48 h and 1 wk post-ABO exposure, in comparison to age-matched non-exposed control retina. In response to a single ABO exposure, type III IF, glial fibrillary acidic protein (GFAP) was variably induced in a subpopulation of retinal Müller glia in ipsilateral eyes. ABO-exposed eyes exhibited radial Müller glial GFAP filament extension through the inner plexiform layer (IPL) and the inner nuclear layer (INL) through the retina in both the nasal quadrant and juxta-optic nerve head (jONH) eye regions at 1 wk post-ABO. We observed an ∼6-fold increase (p ≤ 0.05) in radial glial GFAP immunolabeling in the IPL in both eye regions, in comparison to regionally matched controls. Similarly, GFAP extension through the INL into the outer retina was elevated ∼3-fold, p ≤ 0.05 in the nasal retina, but exhibited wider variability in the jONH retina. In contrast, constitutive type III IF vimentin exhibited greater remodeling in retinal Müller glia through the jONH retina compared to the nasal retina in response to ABO. We observed areas of lateral vimentin remodeling through the Müller glial end-feet, and greater mid-outer retinal radial vimentin IF extension in a subpopulation of glia at 1 wk post-ABO. We also observed a significant increase in total retinal levels of the type III IF desmin in ABO-exposed retina vs. controls (∼1.6-fold, p ≤ 0.01). In addition, ABO-exposure elicited varied glial induction of developmentally regulated type VI family IFs (nestin and synemin) in subpopulations of Müller cells at 48 h and 1 wk post-ABO. We demonstrate that multiple glial phenotypes emerge in the rat retina following a single ABO exposure, rather than a global homogeneous retinal glial response, involving less well characterized IF protein forms which warrant further investigation in the context of ABO-induced retinal gliosis.


Figures

Fig. 1.
Fig. 1.. Müller glial GFAP induction and assembly in response to a single ABO exposure.
Top: Representative confocal images of GFAP-immunolabeling (magenta) in nasal- and juxta-optic nerve head (jONH) retinal cross-sections from control and ABO-exposed eyes. A, B. Control retinal GFAP localization, sampled in the nasal eye quadrant and jONH, respectively. In control retina GFAP expression was restricted predominantly to the inner-retinal Müller glial endfeet and astrocytic processes (yellow arrows), with occasional radially extending GFAP-IF I glial processes (white arrows); GFAP was expressed in occasional IPL-protruding astrocytic processes (asterisk). C. Nasal quadrant retinal GFAP expression at 48 h post-ABO. GFAP was variably induced in retinal Müller glia post-ABO, exhibiting a classic radial glial IF cytoskeletal extension, indicative of reactive gliosis, ranging from sporadic (mild) to widespread (severe) Müller glial GFAP induction (white arrows). D. jONH retinal GFAP at 48 h post-ABO. Müller glial GFAP-induction exhibited greater variation through the jONH post-ABO, again with ranging density of Müller glial GFAP induction (mild-severe, white arrows). E. Nasal retina at 1 wk post-ABO; varied gliosis was observed with occasionally extended GFAP filaments in mild gliotic retina contrasted with profound GFAP induction and assembly through the outer retina in severely gliotic retina post-ABO with GFAP often extending to the apical Müller extents at the ELM (white arrows and long white arrow, respectively). F. jONH retina at 1 wk post-ABO; GFAP extension post-ABO in the jONH retina mirrored that in the nasal quadrant, exhibiting sparse to dense glial GFAP upregulation but with even greater cell-to-cell variability in induction, albeit with outer retinal filament extension in severely gliotic jONH-retina (white arrows). Scale bar 20 μm. Nuclei counterstained with DAPI (blue). Bottom: G, I; Western blot analyses of GFAP expression in rat retina lysates, and H, K; densitometric quantification. Elevated retinal GFAP was observed by 48 h post-ABO exposure, with varied GFAP upregulation among individual retina samples from 1 wk post-ABO cohort eyes. Open bars: non-exposed controls; light gray bars: 48 h ABO; hatched bars: ABO generated only from criterion 80 psi backpressure; and dark gray bars: 1 wk ABO. Sample sizes shown above bars. Stars denote ABO generated using shock tube backpressures of 56 psi and 45 psi, left to right, respectively. **p ≤ 0.01, ***p ≤ 0.001. Abbreviations: ELM, external limiting membrane; GCL, ganglion cell layer; GFAP, glial fibrillary acidic protein; ONL, outer nuclear layer; OPL, outer plexiform layer; RPE, retinal pigmented epithelium. (For interpretation of the references to colour in this figure legend, the reader is referred to the Web version of this article.)
Fig. 2.
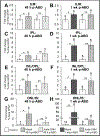
Fig. 2.. Regional quantification of GFAP immunolabeling through retinal layers in nasal eye quadrant and jONH retina at 48 h- and 1 wk-post-ABO vs cohort matched controls.
Particle analysis (FIJI, ImageJ) was used to measure mean % area GFAP immunolabeling in defined retinal regions of equally-thresholded confocal z-stack images and expressed as fold-change relative to matched cohort controls. A, C, E, G: Fold-change in % Area GFAP immunolabeling in each retinal region at 48 h post-ABO. B, D, F, H: Fold-change in % Area GFAP immunolabeling in each retinal region at 1 wk post-ABO. Open bars: cohort-matched control retinas; solid light gray bars: nasal eye quadrant 48 h post-ABO; dotted light gray bars: jONH 48 h post-ABO; solid dark gray bars: nasal eye, 1 wk ABO; dotted dark gray bars: jONH 1 wk post-ABO. Greater GFAP content in the outer retina was observed at 1 wk post-ABO compared to 48 h post-ABO and greater overall GFAP extension was seen in the nasal quadrant vs the jONH retina. *p ≤ 0.05, **p ≤ 0.01. Abbreviations: as in legend, Fig. 1.
Fig. 3.
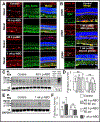
Fig. 3.. Retinal Glial vimentin IF-remodeling and total protein in response to single ABO exposure.
Top: A. GFAP (red) and vimentin (green) co-immunolabeling in retina cross sections from the nasal eye quadrant in control and 48 h post-ABO exposed eyes. Left; Non-exposed control retinas exhibited a typical constitutive expression pattern extending through the Müller cell processes with tapered intensity through the mid- and outer retina. Right; At 48 h post-ABO, no obvious changes in retinal vimentin were observed, while GFAP was induced in a sub-population of glia, (GFAP+/Vim+, yellow arrows) with a remaining varied proportion of Vim+ glia present (green arrows). Occasional GFAP + hypertrophic IPL astrocytes were observed (asterisk). B, Similarly, compared to regionally matched controls (left), no overt changes in retinal vimentin expression was observed at 1 wk post-ABO (right) in the nasal eye quadrant. GFAP often extended further into the outer retina without vimentin co-label in post-ABO retina(red arrows). C. Through the ONH emergence, vimentin was robustly expressed through inner retinal macroglia in non-exposed control eyes (left), exhibiting partial overlap with GFAP. At 1 wk post-ABO, regional vimentin and GFAP remodeling was apparent through some glial processes (right) along the ONH emergence, with regional cytoskeletal hypertrophy (circled). D. Compared to region-matched jONH control retina (left), 48 h post-ABO jONH retina (right) exhibited varied GFAP+/Vim, Vim+/GFAP, and Vim+/GFAP+ glia, without gross changes in vimentin expression at this earlier time point post-ABO (red, green, and yellow arrows, respectively). Interestingly, hypertrophied astrocytes protruding into the retinal IPL were observed at 48 h post-ABO which expressed GFAP but little to no vimentin (asterisk). E. At 1 wk post ABO, regional vimentin hypertrophy was apparent in a subpopulation of Müller glia in the jONH retina (right), with non-tapered glial cytoskeletal vimentin through the mid-to-outer retinal processes, often without GFAP co-labeling (Vim > GFAP, green arrows). F. Another regional comparison within the jONH eye region, with control retina (left) vs 1 wk post-ABO retina, with glia exhibiting extensive GFAP induction and assembly, and accompanying vimentin cytoskeletal remodeling apparent 1 wk post-ABO, with robust glial cytoskeletal Vim+ and GFAP+ co-expression, the latter extending further through to the outer retinal glial processes at the ELM in severely gliotic regions (GFAP > Vim, red arrows). Scale bar, 20 μm. Bottom: G, H. Western blot analyses in whole individual retina lysates at 48 h- and 1 wk post-exposure, respectively, and I, K. densitometric quantification. No overall changes in total retinal vimentin expression levels were observed following ABO. Open bars, non-exposed controls; light gray bar, 48 h post-ABO; hatched bar, 48 h post-ABO generated only from criterion 80 psi backpressure; and dark gray bar, 1 wk post-ABO. Sample sizes shown above bars. Stars denote ABO generated using shock tube backpressures of 56 psi and 45 psi, left to right, respectively. (For interpretation of the references to colour in this figure legend, the reader is referred to the Web version of this article.)
Fig. 4.
Fig. 4.. Altered expression of retinal Type III IF desmin following single ABO exposure.
Upper panels: A. Representative images of non-exposed control retinal desmin immunolabeling from nasal control and 1 wk post-ABO retinas. Left, Control, Nasal retina; GFAP-IF (red) was restricted largely to the astroglia/ILM, (upward blue arrows), while desmin (green) was constitutively expressed through Müller glial processes (green arrows). Desmin expression through OPL processes (cyan arrows) and vascular pericytes (asterisk) was observed. Right,1 wk post-ABO Nasal retina; Radial GFAP upregulation at 1 wk ABO without overt constitutive radial desmin remodeling was observed, with graded Müller cell co-expression of both IFs (yellow arrows); GFAP often extended into the outer retina without accompanying desmin IF (red arrows). While no overt changes in radial glial desmin were observed post-ABO, IF-remodeling through the ILM was observed, with greater lateral GFAP+/desmin+ overlap through the inner retinal cytoskeletal structures (upward blue arrows). B. jONH Control retina (left) and 1 wk post-ABO (right) exhibited a similar GFAP/desmin co-immunolabeling pattern, with discrete lateral spreading of inner retinal IF post-exposure compared to controls. Lower panels: C,E. Western blot analyses of whole retina lysates probed using desmin-pAb following preabsorption against full-length vimentin and GFAP proteins. Sample sizes shown above bars. Immunoreactive doublets at 64/65 kDa, 54/55 kDa, and 47/48 kDa were observed (black arrows). 55 KDa is consistent with the predicted unmodified molecular weight of desmin. A lower-migrating species at Mr ~48 kDa could correspond to calpain-protease degradation product from desmin processing which migrates ~10 kDa lower than full-length desmin (Aweida et al., 2018). While no overall changes in desmin levels were seen at 48 h post-ABO, an increase in the levels of 54/55 kDa and 47/48 kDa desmin forms was observed at 1 wk post-ABO (E). D,F. Quantification of the major immunoreactive desmin forms confirmed no overall changes in retinal desmin protein levels at 48 h post-ABO. Quantification of 1 wk ABO lysates revealed elevated levels of 54/55 kDa, and 47/48 kDa desmin forms, consistent with the expected non-modified and lightly degraded desmin forms, respectively, and no significant change in 64/65 kDa species. G. Western blot analyses of Calpain 1 (Cal. 1) digested overexpressed-desmin and rat retina lysates probed with desmin pAb. 200 ng desmin overexpression lysate or 10 μg rat retina lysate was digested with 2 U calpain 1 with or without the presence of 2 mM protease inhibitor EGTA. Desmin pAb detected multiple MW protein forms ranging from 25 to 75 kDa in HEK293T desmin OE-lysate, absent in vector-control HEK293T lysates, and similar endogenous desmin expression patterns in rat retina lysates, with Cal. 1, resulting in collapse of the immunoreactive desmin forms between 25 and 35 kDa in both overexpression and rat retina lysates. Fully protected retina lysates showed even higher range of desmin species, showing that digest conditions (30 °C, without protease inhibitor cocktail, P8340), also led to minimal desmin degradation. (For interpretation of the references to colour in this figure legend, the reader is referred to the Web version of this article.)
Fig. 5.
Fig. 5.. Synemin upregulation in a subpopulation of retinal Müller glia following single ABO exposure.
Upper panels: A. Representative rat retina cross sections through the nasal eye quadrant, immunolabeled for Synemin (mAb clone B8, red), and Glutamine Synthetase (green). Control; Nasal Retina, (Top Left): mAb B8 immunolabeling revealed basal synemin expression in a variety of cell-types in rat retina and choroid, including RGCs (asterisk), choroidal vasculature (box), presumptive horizontal processes (through the OPL, cyan arrowhead), astrocytes, Müller glial end feet (ILM, blue arrowhead), and faint radial expression through cell processes (white arrowhead). Expression in a subset of INL cell bodies was observed (circled). 48 h post-ABO; Nasal Retina, (Middle-Left panels): Occasional filamentous radial synemin labeling was observed through the IPL in rare Müller glial processes at 48h post blast, with most of the glia exhibiting basal to no radial synemin expression. 1 wk post-ABO, Nasal Retina (bottom left): By 1 wk post-ABO, clusters of Müller glial processes exhibited robust synemin expression. Moreover, contiguous lateral synemin labeling through the ILM end-feet and astrocytic processes was often observed, indicating macroglial synemin cytoskeletal re-modeling (blue arrows, ILM). B. Control, jONH Retina (Top Right); comparable basal retinal synemin expression was observed in jONH retina to that observed in the nasal eye quadrant. 1 wk post-ABO, (mildly gliotic retina, Middle panel, Right); variable Müller glial synemin induction was observed in mildly gliotic retina at 1 wk post-ABO, often without robust GFAP co-induction (orange arrows); graded filamentous synemin colocalization with GFAP in co-expressing Müller glial processes was observed (orange-yellow arrows). Synemin may interact directly with GFAP as an associated binding protein or indirectly in IF heterodimers via vimentin/desmin. 1 wk post-ABO (severely gliotic retina, bottom panel, Right); elevated radial glial synemin expression, with extended, thickened hypertrophic cytoskeletal appearance was observed through a sub-population of Müller cell processes in severely gliotic jONH retina 1 wk post-ABO, glia often exhibiting profound GFAP co-induction (yellow arrows). Hypertrophic GFAP+/Synemin+ astrocytes in the IPL were occasionally observed (circled). Notably, radial filamentous GFAP generally extended further into the outer Müller glial processes than synemin post-ABO (green arrows). Scale bar, 20 μm. Lower panels: C-F. Western blot analyses of whole retinal synemin levels probed using mAb B8. Both alpha (180 kDa)- and beta (150 kDa)- synemin isoforms were detected by B8. C-D. In 48 h post-ABO harvested rat retinas, modest elevation in retinal alpha-synemin levels were observed. Sample sizes shown above bars. Stars denote ABO generated using shock tube backpressures of 56 psi and 45 psi, left to right, respectively. mAb B8 also detected overexpressed synemin (HEK293T system), with little to no signal in matched vector-only control lysates, demonstrating high target specificity of mAb B8 to synemin. E,F. In 1 wk post-ABO retinas there was no differences in either synemin isoform protein levels compared to controls. *p ≤ 0.05, **p ≤ 0.01. Abbreviations: as in legend, Fig. 1. (For interpretation of the references to colour in this figure legend, the reader is referred to the Web version of this article.)
Fig. 6.
Fig. 6.. Variable nestin induction in retinal Müller glia following ABO exposure.
A. GFAP (green) and Nestin (red) co-immunolabeling in nasal-quadrant retina cross sections. Left; Control nasal retina exhibited typical GFAP localization through the inner-retinal macroglia (blue arrow) with occasional radial IF extension, and rare Müller glial GFAP+/nestin+ coexpression, or nestin+ filamentous labeling alone (yellow and red arrows, respectively). Endothelia (asterisks), also exhibited nestin expression, and diffuse nestin labeling through the IPL may indicate lateral glial soma or possibly neuronal expression (boxed). Nestin co-labeling with GFAP through protruding astrocytic processes associated with blood vessels is indicated (circled). Right; at 48 h post-ABO, varied Müller glial induction of GFAP and nestin through radial glial processes was observed, with multiple IF-subtypes exhibiting either predominant cytoskeletal nestin (potentially co-polymerized with vimentin, red arrows), predominant GFAP (green arrows) or graded GFAP/nestin (yellow arrows). Robust cytoskeletal nestin labeling extended into the outer retinal glial processes in some Müller cells (red arrows, outer retina). B. 1 wk post ABO GFAP/nestin immunolabeling, in nasal and jONH retina, compared to controls (top panel and left panel A), nestin was variably induced through Müller glia, with varied GFAP co-induction. C. Triple immunolabeling for synemin (cyan) GFAP (green) and nestin (red) in jONH retina.,Top; in non-exposed control retinas, faint intermittent GFAP, nestin and synemin IF structures were rarely observed through glial processes in the IPL, but interestingly, GFAP+ processes generally co-labeled for synemin, suggesting heteropolymerization within the IF cytoskeletal network, or synemin association with GFAP as an IFAP. Middle: jONH retina, with mild gliosis, at 48 h post-ABO exhibited variable GFAP and Nestin upregulation in some Müller glia, often without accompanying synemin induction. Bottom: jONH retina, with severe gliosis, at 48 h post-ABO with profound induction and extension of GFAP, nestin and synemin through radial Müller glial processes (green, red and cyan arrows, respectively). Interestingly, nestin often exhibited the most extended IF-assembly in some gliotic regions post-ABO, nestin assembly reaching the outer retinal space and ELM, often without GFAP co-labeling (red arrow, outer retina). Scale bars 20 μm. Bottom; D-G. Western blotting analyses of whole individual retina lysates using anti-nestin mAb-401. D,E. Expression of multiple high molecular weight nestin forms was observed in both control and post-ABO rat retina lysates, consistent with known post-translational phosphorylation events (Sahlgren et al., 2001) and multiple translated nestin splice-forms expressed in Rattus norvegicus (splice forms CRA_a-c Genbank EDM00748.1 to 750.1). We observed that the ~170 kDa nestin species in Western blots (the major predicted un-modified form) was modestly upregulated post-ABO. F,G. Densitometric quantification summarizing the protein level changes observed for 170 kDa nestin, and summed 170–280 kDa migrating nestin forms, normalized to housekeeping protein GAPDH for 48 h and 1 wk post-ABO, respectively. Open bars, non-exposed controls; light gray bar, 48 h post-ABO; hatched bar, 48 h post-ABO generated only from use of criterion 80 psi backpressure; and dark gray bar, 1 wk post-ABO. Sample sizes shown above bars. Stars (F) denote ABO generated using shock tube backpressures of 56 psi and 45 psi, left to right, respectively. *p ≤ 0.05, **p ≤ 0.01. Abbreviations: as in legend, Fig. 1. (For interpretation of the references to colour in this figure legend, the reader is referred to the Web version of this article.)

Similar articles

Cited by

References

    1. Agnetti G, Herrmann H, Cohen S, 2022. New roles for desmin in the maintenance of muscle homeostasis. FEBS J 289, 2755–2770. - PubMed
    1. Allen RS, Motz CT, Feola A, Chesler KC, Haider R, Ramachandra Rao S, Skelton LA, Fliesler SJ, Pardue MT, 2018. Long-term functional and structural consequences of primary blast overpressure to the eye. J. Neurotrauma 35, 2104–2116. - PMC - PubMed
    1. Allen RS, Motz CT, Singh A, Feola A, Hutson L, Douglass A, Ramachandra Rao S, Skelton LA, Cardelle L, Bales KL, Chesler K, Gudapati K, Ethier CR, Harper MM, Fliesler SJ, Pardue MT, 2021. Dependence of visual and cognitive outcomes on animal holder configuration in a rodent model of blast overpressure exposure. Vis. Res 188, 162–173. - PMC - PubMed
    1. Aweida D, Rudesky I, Volodin A, Shimko E, Cohen S, 2018. GSK3-beta promotes calpain-1-mediated desmin filament depolymerization and myofibril loss in atrophy. J. Cell Biol 217, 3698–3714. - PMC - PubMed
    1. Bellin RM, Huiatt TW, Critchley DR, Robson RM, 2001. Synemin may function to directly link muscle cell intermediate filaments to both myofibrillar Z-lines and costameres. J. Biol. Chem 276, 32330–32337. - PubMed

Publication types