. 2023 Aug 29;42(8):112845.
doi: 10.1016/j.celrep.2023.112845. Epub 2023 Jul 21.

PCDH12 loss results in premature neuronal differentiation and impeded migration in a cortical organoid model

Affiliations

PCDH12 loss results in premature neuronal differentiation and impeded migration in a cortical organoid model

Jennifer Rakotomamonjy et al. Cell Rep. .

Abstract

Protocadherins (PCDHs) are cell adhesion molecules that regulate many essential neurodevelopmental processes related to neuronal maturation, dendritic arbor formation, axon pathfinding, and synaptic plasticity. Biallelic loss-of-function variants in PCDH12 are associated with several neurodevelopmental disorders (NDDs). Despite the highly deleterious outcome resulting from loss of PCDH12, little is known about its role during brain development and disease. Here, we show that PCDH12 loss severely impairs cerebral organoid development, with reduced proliferative areas and disrupted laminar organization. 2D models further show that neural progenitor cells lacking PCDH12 prematurely exit the cell cycle and differentiate earlier when compared with wild type. Furthermore, we show that PCDH12 regulates neuronal migration and suggest that this could be through a mechanism requiring ADAM10-mediated ectodomain shedding and/or membrane recruitment of cytoskeleton regulators. Our results demonstrate a critical involvement of PCDH12 in cortical organoid development, suggesting a potential cause for the pathogenic mechanisms underlying PCDH12-related NDDs.

Keywords: CP: Developmental biology; CP: Molecular biology; PCDH12; cytoskeleton; ectodomain shedding; migration; neural development.


Conflict of interest statement

Declaration of interests The authors declare no competing interests.

Figures
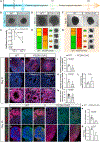
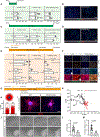
Figure 1.
Figure 1.. Impaired cerebral organoid morphology, ventricular zone, and laminar organization in PCDH12-KO cerebral organoids
(A) Timeline of cerebral organoid formation. (B) Representative bright-field images of WT (left) and PCDH12-KO (right) embryoid bodies (EBs) at day 7 showing brightening edges, indicative of ectodermal differentiation. (C) Quantification of EB coefficient of circularity, defined as 4π(area/perimeter2) at day 7 (WT n = 38; PCDH12-KO n = 39; mean ± SD) and day 10 (WT n = 32; PCDH12-KO n = 34; mean ± SD) p = 0.0042; comparison of fits. (D) Representative bright-field images of WT (left) and PCDH12-KO (right) EBs at day 10 showing surface budding, indicative of neuroepithelial expansion. (E) Percentages of EBs in developmental categories 1 to 4 (right). Category 1: uniform and pronounced surface budding, clear edges; category 2: smoother surface budding, with occasional non-neuroepithelial outgrowths; category 3: few surface buddings with recurrent non-neuroepithelial outgrowths; category 4: no surface budding, lack of clear edges. (F) Representative category 1 WT (left) and category 3 PCDH12-KO (right) cerebral organoids at day 21. (G) Percentages of organoids in developmental categories 1 to 4. Category 1: expanded cerebral tissue with ventricle-like structures; category 2: expanded cerebral tissue with ventricle-like structures, alongside non-neuronal outgrowths; category 3: minimal cerebral expansion with fewer and smaller ventricle-like structures; category 4: no cerebral expansion, with cell processes extending into the Matrigel. (H) Immunofluorescence images of day 21 WT (left) and category 3 (middle) and category 4 (right) PCDH12-KO organoids stained with N-cadherin (red). (I) Quantification of N-cadherin-defined cortical rosettes in day 21 organoids. Each point represents the number of rosettes per organoid (WT n = 7; PCDH12-KO n = 12; mean + SD; unpaired t test with Welch’s correction). (J) Immunofluorescence images of day 21 WT (left) and category 3 (middle) and category 4 (right) PCDH12-KO organoids stained with phospho-vimentin (p-Vim; red), and phospho-histone H3 (pH-H3; green). (K) Average number of anchored mitotic cells per cortical rosette in day 21 organoids. Each point represents the average number per organoid (WT n = 6; PCDH12-KO n = 11; mean + SD; Mann-Whitney test). (L) Total number of mitotic cells per rosette in day 21 organoids. Each point represents the average number per organoid (WT n = 7; PCDH12-KO n = 12; mean + SD; Mann-Whitney test). (M) Immunofluorescence images of day 21 WT (left) and category 3 (middle) and category 4 (right) PCDH12-KO organoids stained with Sox2 (red). (N) Quantification of ventricular zone thickness in day 21 organoids, defined by the thickness of the SOX2+ layer. Each point represents the average ventricular zone thickness per cortical rosette (n = 27 for WT and PCDH12-KO; mean + SD; unpaired t test with Welch’s correction). (O) Immunofluorescence images of day 40 WT (left) and PCDH12-KO (right) organoids stained with PAX6 (red) and TBR2 (green). Examples of neural rosettes are highlighted by dashed lines. (P) Average ratio of TBR2+ relative to PAX6+ cells per rosette in day 40 organoids (WT n = 12; PCDH12-KO n = 6; mean + SD; unpaired t test). (Q) Immunofluorescence images of day 40 WT (left) and PCDH12-KO (right) organoids stained with CTIP2 (green) and TBR1 (red). Examples of rosettes are highlighted by dashed lines. (R) Average CTIP2/TBR1 Pearson’s correlation coefficients showing degree of colocalization in day 40 organoids (WT n = 6; PCDH12-KO n = 4; mean + SD; Mann-Whitney test). Data were obtained from 2 different cell lines for each genotype and from 3 independent differentiations. Scale bars represent 100 μm (B, D, H, O, and Q), 50 μm (J and M), and 1 mm (F).
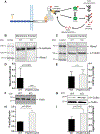
Figure 2.
Figure 2.. PCDH12-KO neural progenitor cells show premature cell cycle withdrawal, early neuronal differentiation, and impaired migration
(A) Quantifications of the percentages of BrdU+ and Ki67+ cells, and BrdU labeling index (double-positive BrdU+ - Ki67+ cells/Ki67+ cells) after a 30 min BrdU pulse (n = 9 for WT; n = 13 for PCDH12-KO; mean + SD; unpaired t test). (B) Representative images of WT (left) and PCDH12-KO (right) NPC cultures after a 30 min BrdU pulse. Cells were stained with BrdU (green) and Ki67 (red). (C) Quantifications of the percentages of BrdU+ and Ki67+ cells, and cell cycle re-entry index (double-positive BrdU+ - Ki67+ cells/BrdU+ cells) after a 24 h BrdU pulse (n = 3 for WT; n = 5 for PCDH12-KO; mean + SD; Mann-Whitney test). (D) Representative images of WT (left) and PCDH12-KO (right) NPC cultures after a 24-h BrdU pulse. Cells were stained with BrdU (green) and Ki67 (red). (E) Percentages of PAX6+, doublecortin (DCX)+, and MAP2+ cells at 0, 14, and 21 days post-FGF removal (WT n = 4 for Pax6 and DCX at days 0, 14, and 21 and MAP2 at days 0 and 21; n = 3 for MAP2 at day 14; PCDH12-KO n = 5 for PAX6, DCX, and MAP2 at days 0, 14, and 21; mean + SD; multiple unpaired t tests). (F) Immunofluorescence images of WT (left) and PCDH12-KO (right) cultures at days 0 and 21 post-FGF removal. NPCs are labeled with PAX6 (white), immature neurons with DCX (green), and mature neurons with MAP2 (red). (G) Timeline of the neurosphere migration assay. (H) Percentages of cells distributed within 50 μm incremental bins from the edge of the neurosphere 5 days post-plating (WT n = 4 neurospheres; PCDH12-KO n = 7 neurospheres; mean + SD; **p = 0.0067; ***p = 0.0002; multiple unpaired t tests). (I) Representative images of WT (left) and PCDH12-KO (right) neurospheres stained with MAP2 (red) 5 days post-plating. (J) Representative 16 h live-imaging sequence for WT (top) and PCDH12-KO (bottom) neurospheres. (K) Representative migration plots of five WT (black) and PCDH12-KO (red) migrating neurons over 16 h. All track starting points were normalized to a common origin. (L and M) Quantifications of directionality of neuron motion (L) (a value of 1 translates to a straight-line migration from the starting point) and Euclidean distance (M) (straight line between migration start and endpoints). Each data point represents a neuron (WT n = 30; PCDH12-KO n = 18 neurons; mean + SD; Mann-Whitney test for directionality; Welch’s t test for Euclidean distance). Immunofluorescence data: n = 3 independent experiments. Live-imaging data: n = 4 independent experiments. Scale bars represent 200 μm (B, D, F, and J) and 100 μm (I).
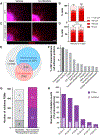
Figure 3.
Figure 3.. PCDH12 recruits WAVE1 at the plasma membrane and affects actin cytoskeleton regulation
(A) Potential interaction between PCDH12 and the actin cytoskeleton. (B and C) Representative western blots of WT and PCDH12-KO membrane (B) and cytosolic fractions (C) from NPCs. (D and E) WAVE1 quantification in NPC membrane fractions, relative to N-cadherin (D), and cytosolic fractions, relative to α-tubulin (E) (n = 3 independent experiments; mean + SD; Mann-Whitney test). (F) Representative immunoblots of F- and G-actin in WT and PCDH12-KO NPCs. (G) Representative western blot of total and phospho-cofilin in NPCs. (H) Quantification of the F-/G-actin ratio (n = 3 independent experiments; mean + SD; unpaired t test). (I) Ratio of phosphorylated to total cofilin in WT and PCDH12-KO NPCs (n = 4 independent experiments; mean + SD; unpaired t test).
Figure 4.
Figure 4.. PCDH12 ectodomain is detected in the CSF and is involved in neuronal migration
(A) Representative images of WT neurospheres stained with MAP2 (red) 5 days post-plating treated with vehicle (left) or ADAM-10 inhibitor GI254023X (right). (B) Average percentages of cells distributed within 50 mm incremental bins from the edge of WT neurospheres (n = 15 vehicle- and n = 18 GI254023X-treated neurospheres; mean + SD; Brown-Forsythe and Welch ANOVA tests). (C) Representative images of PCDH12-KO neurospheres stained with MAP2 (red) 5 days post-plating treated with vehicle (left) or GI254023X (right). (D) Average percentages of cells distributed within 50 μm incremental bins from the edge of PCDH12-KO neurospheres (n = 7 vehicle- and n = 5 GI254023X-treated PCDH12-KO neurospheres; mean + SD; Brown-Forsythe and Welch ANOVA tests). (E) Venn diagram of total proteome from CSF showing the overlap between transmembrane and cell adhesion proteins. (F) Composition of CSF transmembrane cell adhesion proteins. (G) Total number of peptides for each subclass of protocadherins present in CSF. (H) Total number of validated peptide spectrum matches (PSMs) and peptides (hatched bars) among δ2-protocadherins. Data were obtained from 2 different cell lines for each genotype and from 3 independent migration assays. Scale bar represents 100 μm.

Similar articles

Cited by

References

    1. Hirano S, and Takeichi M (2012). Cadherins in brain morphogenesis and wiring. Physiol. Rev 92, 597–634. 10.1152/physrev.00014.2011. - DOI - PubMed
    1. Miyamoto Y, Sakane F, and Hashimoto K (2015). N-cadherin-based adherens junction regulates the maintenance, proliferation, and differentiation of neural progenitor cells during development. Cell Adhes. Migrat 9, 183–192, 10.1080/19336918.2015.1005466. - DOI - PMC - PubMed
    1. Hor CHH, and Goh ELK (2018). Rab23 Regulates Radial Migration of Projection Neurons via N-cadherin. Cereb Cortex 28, 1516–1531. 10.1093/cercor/bhy018. - DOI - PMC - PubMed
    1. Lee DK, Lee H, Yoon J, Hong S, Lee Y, Kim KT, Kim JW, and Song MR (2019). Cdk5 regulates N-cadherin-dependent neuronal migration during cortical development. Biochem. Biophys. Res. Commun 514, 645–652. 10.1016/j.bbrc.2019.04.166. - DOI - PubMed
    1. Hoshina N, Tanimura A, Yamasaki M, Inoue T, Fukabori R, Kuroda T, Yokoyama K, Tezuka T, Sagara H, Hirano S, et al. (2013). Protocadherin 17 regulates presynaptic assembly in topographic corticobasal Ganglia circuits. Neuron 78, 839–854. 10.1016/j.neuron.2013.03.031. - DOI - PubMed

Publication types