. 2023 Aug;26(8):1379-1393.
doi: 10.1038/s41593-023-01380-x. Epub 2023 Jul 20.

An adaptive behavioral control motif mediated by cortical axo-axonic inhibition

Affiliations

An adaptive behavioral control motif mediated by cortical axo-axonic inhibition

Kanghoon Jung et al. Nat Neurosci. 2023 Aug.

Abstract

Genetically defined subgroups of inhibitory interneurons are thought to play distinct roles in learning, but heterogeneity within these subgroups has limited our understanding of the scope and nature of their specific contributions. Here we reveal that the chandelier cell (ChC), an interneuron type that specializes in inhibiting the axon-initial segment (AIS) of pyramidal neurons, establishes cortical microcircuits for organizing neural coding through selective axo-axonic synaptic plasticity. We found that organized motor control is mediated by enhanced population coding of direction-tuned premotor neurons, with tuning refined through suppression of irrelevant neuronal activity. ChCs contribute to learning-dependent refinements by providing selective inhibitory control over individual pyramidal neurons rather than global suppression. Quantitative analysis of structural plasticity across axo-axonic synapses revealed that ChCs redistributed inhibitory weights to individual pyramidal neurons during learning. These results demonstrate an adaptive logic of the inhibitory circuit motif responsible for organizing distributed neural representations. Thus, ChCs permit efficient cortical computation in a targeted cell-specific manner.


Conflict of interest statement

The authors declare no competing interests.

Figures

Fig. 1
Fig. 1. Improved directional control of movement with learning.
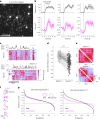
a, Schematic of the spatial navigation task on a multi-textured floating ball maze, in which head-fixed mice freely navigate toward a goal spot in the target quadrant (Q1) based on tactile cues. Two-photon calcium imaging was simultaneously performed in layer 2/3 of premotor cortex (M2). b, Representative movement trace (100 s) of mice in the experimental (water restricted) and control (water ad libitum) groups from training sessions 1 to 7 (left) and their two-dimensional projection (right). A circle with a dashed line indicates the goal spot on the ball. Heat map and contour lines of the times of mice spent on the location are presented. c, Average movement speed (n = 27 mice for the experimental group; n = 14 mice for the control group; two-way repeated-measures ANOVA, Fgroup = 3.85, P = 0.072). d, Average movement acceleration (two-way repeated-measures ANOVA, Fgroup = 154, P = 0.24). e, Average number of successes obtained in training sessions (two-way repeated-measures ANOVA, Fgroup = 26.97, P = 1.73 × 10−4). f, Percentage of time spent in each quadrant during navigation in the experimental group. g, Average latency to reward (two-way repeated-measures ANOVA, Fgroup = 7.43, P = 0.017). h, Average goal proximity (two-tailed t-test, t = −5.19, P = 1.03 × 10−6 for the experimental group; t = 1.15, P = 0.26 for the control group). i, Movement accuracy (two-tailed t-test, t = −7.04, P = 2.01 × 10−10 for the experimental group; t = 1.74, P = 0.09 for the control group). j, Cumulative turning angle over time in sessions 1 and 7. k, Comparison of cumulative turning angle between the experimental and control groups (two-tailed t-test, t = −5.84, P = 5.76 × 10−8 for the experimental group; t = 0.019, P = 0.98 for the control group). NS, not significant; *P < 0.05; ***P < 0.001; error bars indicate s.e.m. In the box plot, the midline, box size and whisker indicate median, 25th–75th percentile and 10th–90th percentile, respectively. Exp, experimental; CW, clockwise; CCW, counterclockwise; a.u., arbitrary units. Source data
Fig. 2
Fig. 2. Motor learning refines direction coding through the suppression of irrelevant activity.
a, Schematic of MD. An average pixel-based activity map of MD (top, n = 6 mice). Color-coded map of PDs of direction-tuned neurons (bottom, von Mises fitting, P value of correlation coefficients, P < 0.05, and DSI ≥ 0.4), colored according to their PD. Non-direction-tuned neurons (P ≥ 0.05 or DSI < 0.4) are shown in gray. b, Example heat map of premotor neurons’ tuning for MD in early learning (session 1, top) and late learning (session 7, bottom). Data are sorted from the location of peak likelihood probability P(active|MD). Corresponding precisions of population responses for each MD (right). c, Changes of average precision curves of population responses. d, Comparison of population response precisions (n = 6 mice for the experimental group, two-tailed paired t-test, t = −4.98, P = 0.0042; n = 5 mice for the control group, t = 2.56, P = 0.063). e, Normalized percentage of active cells in the population as a function of distance from the PD (n = 830 cells for early, n = 937 cells for late in the experimental group; n = 705 cells for early, n = 671 cells for late in the control group). f, Changes in the percentage of active cells (two-tailed Student’s t-test, t = 5.149, P = 0.0036 for the experimental group; t = 0.106, P = 0.920 for the control group). g, Movement speed (top), posterior probabilities (middle) and corresponding actual and decoded MD estimated with MAP (bottom). h, Changes in posterior probabilities, P(MD|active), normalized by chance level (dashed line) as a function of distance from MD with learning. i, Probability distributions of decoding error. j, Pairwise correlations with respect to ΔPD normalized by early session 1 (angular difference in PD between neuronal pairs, n = 58,456 pairs for session 1, n = 67,143 pairs for session 7 for the experimental group; n = 51,285 pairs for session 1, n = 45,156 pairs for session 7 for the control group). **P < 0.01; error bars and shading indicate s.e.m. Exp, experimental. Source data
Fig. 3
Fig. 3. Manipulation of PV-INs alters global neural activity.
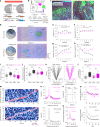
a, Behavioral performance of the number of successes with training and photo-inhibition. Inactivation of PV-INs, but not SOM-INs, resulted in a deficit in finding a hidden goal (n = 8 mice for PV-NpHR, one-way repeated-measures ANOVA, Fsession = 30.0, P = 8.69 × 10−6, Fisher multiple comparisons tests, ***P < 0.001; n = 5 mice for SOM-NpHR, Fsession = 0.42, P = 0.67). b, Schematic of blockage of GABA release from PV-INs by expressing TeTxLC in PV-Cre mice. c, Representative image of increased excitability in PV-TeTxLC mice (n = 6 mice). d, Average transient fluorescence traces of premotor neurons aligned to movement onset (n = 647 cells from six mice for PV-TeTxLC, n = 480 cells from seven mice for PV control). e, An example of movement speed (top), the normalized activity of neurons (middle) and probability of maximum neuron activation (bottom) aligned to movement onsets. f, Average movement speed (top) and corresponding changes of the probability of maximum neuron activation (bottom) aligned to movement onsets. g, Example pairwise correlation matrices. h, Population fraction of neuronal pairs with positive and negative correlation (n = 31,660 pairs for PV-TeTxLC, n = 24,061 pairs for control; chi-square test, χ2 = 1.03 × 104, P = 0). in, The activity of PV-INs and ChCs related to the movement initiation. i, An example field of view showing premotor neurons expressing GCaMP6s (green) and flex-tdTomato (red). j, An example trace of movement speed (top) and corresponding heat map of transient fluorescence signals of PV-INs (bottom). k, The normalized activity of PV-INs aligned to movement onset (n = 59 cells from seven mice in PV control). l, The normalized activity of neurons aligned to movement onset in the PV-TeTxLC group (n = 647 cells from six mice in PV-TeTxLC). m, Average ΔF/F traces of PV-INs (top) and neurons in the PV-TeTxLC group (bottom) aligned to movement onset. n, Probability distributions of peak activity timing of PV-INs and neurons in the PV-TeTxLC group aligned to movement onset. ***P < 0.001; error bars and shadings indicate s.e.m. Source data
Fig. 4
Fig. 4. Sparse, sequential activity is preserved in ChC manipulation.
a, Example image of the axonal projection of ChCs (expressing mCherry, in magenta) to AISs (post hoc AnkG staining, in cyan) of neighboring L2/3 neurons (expressing GCaMP6s, in green, n = 9 mice). Axonal boutons of ChCs innervating an AIS (right). Yellow arrowheads indicate putative cartridges associated with AISs. Gray dashed lines indicate laminar boundaries for cortical layers 1 to 2/3. b, Schematic of selective abolition of GABA release from ChCs in M2 by expressing TeTxLC in ChC-Flp mice (Nkx2.1-2a-CreER::Flex-FlpO mice). c, An example of movement speed (top), the normalized activity of neurons (middle) and probability of maximum neuron activation (bottom) aligned to movement onsets in ChC-TeTxLC and ChC control. d, Average movement speed (top) and corresponding changes in the probability of maximum neuron activation (bottom) aligned to movement onsets. e, Example pairwise correlation matrices of ChC-TeTxLC and ChC control mice. f, Population fraction of neuronal pairs with positive and negative correlation (n = 14,082 pairs for ChC-TeTxLC, n = 57,956 pairs for ChC control; two-tailed chi-square test, χ2 = 1.21, P = 0.27). gj, The activity of ChCs related to the movement initiation. g, The normalized activity of ChCs aligned to movement onset (35 cells from three mice). h, The normalized activity of neurons aligned to movement onset in the ChC-TeTxLC group (n = 982 cells from nine mice). i, Average ΔF/F traces of ChCs (top) and neurons in the ChC-TeTxLC group (bottom) aligned to movement onset. j, Probability distributions of peak activity timing of ChCs and neurons in the ChC-TeTxLC group aligned to movement onset. Error bars and shading indicate s.e.m. NS, not significant. Source data
Fig. 5
Fig. 5. Chemogenetic inhibition of ChCs disrupts the direction selectivity of premotor neurons.
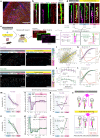
a, In vivo two-photon Ca2+ imaging of ChC and neighboring neurons expressing GCaMP6s and selectively co-expressing the chemogenetic silencer hM4Di-mCherry in ChCs of M2, in an FlpO-dependent manner, using Nkx2.1-2a-CreER::Flex-FlpO mice (ChC-Flp mice, n = 9). b, Bath-application of CNO (10 μM) reduced the firing rate in ChCs expressing hM4Di. Example whole-cell current-clamp recording from a ChC. c, The average number of successes of ChC-hM4Di mice increased with training from sessions 1 to 7. CNO or saline injection was followed on session 8 or 9 (n = 9 mice, one-way repeated-measures ANOVA, Fsession = 31.1, P = 3.09 × 10−6; Fisher multiple comparisons tests, session 7 versus CNO, P = 2.40 × 10−6; session CNO versus saline, P = 7.58 × 10−6; session 7 versus saline, P = 0.53). d, Cumulative turning angle of ChC-hM4Di mice across conditions (session 7, CNO and saline). In the box plot, the midline, box size and whisker indicate median, 25th–75th percentiles and 10th–90th percentiles, respectively. e, Comparison of cumulative turning angle across conditions (one-way repeated-measures ANOVA, Fsession = 8.99, P = 0.0024; Fisher multiple comparisons tests, session 7 versus CNO, P = 0.0035; session 7 versus saline, P = 0.45; CNO versus saline, P = 0.0013). f, Comparison of performance between conditions (n = 6 mice for ChC control with saline or CNO; n = 9 mice for ChC-hM4Di with saline or CNO, one-way ANOVA, Fsession = 9.50, P = 2.06 × 10−4). In the box plot, the midline, square, box size and whisker indicate median, mean, 25th–75th percentiles and 10th–90th percentiles, respectively. g, Example ΔF/F traces of a ChC during locomotion in CNO and saline conditions. h, Average ΔF/F traces of ChCs aligned to movement onset in CNO and saline conditions (six ChC-hM4Di mice, n = 497 cells for CNO; n = 475 cells for saline). i, Co-activity percentage of neurons during periods of locomotion and rest (two-tailed Friedman test, χ2 = 9.33, P = 0.0094 for locomotion; χ2 = 0.33, P = 0.85 for rest). j, Example tuning curves of each individual premotor neuron for MD in CNO (top) and saline (bottom) conditions. Data are sorted from the location of peak likelihood probability P(active|MD). Corresponding precisions of population responses for each MD (right). k, Average precision curves of population responses across later learning, CNO and saline conditions. l, Comparison of population response precisions (one-way repeated-measures ANOVA, Fsession = 6.39, P = 0.016; Fisher multiple comparisons tests, session 7 versus CNO, P = 0.0068; session CNO versus saline, P = 0.023; session 7 versus saline, P = 0.486). m, Normalized percentage of active cells in the population as a function of distance from the PD (n = 484 cells for session 7, n = 407 cells for CNO, n = 582 cells for saline). n, Changes in the percentage of active cells across conditions (one-way repeated-measures ANOVA with Greenhouse–Geisser correction, Fsession = 7.26, P = 0.037; Fisher multiple comparisons tests, session 7 versus CNO, P = 0.006; session CNO versus saline, P = 0.011; session 7 versus saline, P = 0.372). o, Pairwise correlations with respect to ΔPD normalized by session 7 (angular difference in PD between neuronal pairs, n = 17,933 pairs for session 7; n = 24,205 pairs for CNO; n = 22,735 pairs for saline). *P < 0.05; **P < 0.01; ***P < 0.001; NS, not significant; CW, clockwise; CCW, counterclockwise. Error bars and shading indicate s.e.m. Source data
Fig. 6
Fig. 6. Variability of ChC activity increases during learning.
a, Representative field of view showing L2 ChCs expressing GCaMP6 (n = 3 mice). b, Example fluorescence traces from ChCs that show increased activity during episodes of locomotion. c, Movement speed and the heat map of ChC activity during navigation in sessions 1 and 7. The synchronous activation of ChCs in session 1 during locomotion becomes asynchronous in session 7. d, Changes in the correlation between a pair of ChCs (n = 189 pairs in 35 cells from three mice; two-tailed Wilcoxon signed-rank test, Z = 11.92, P = 0). e, Example correlation matrix of ChCs in sessions 1 and 7. f, Various temporal relationships between activity of ChC (magenta) and neighboring M2 neurons (gray) during episodes of locomotion in ChC-hM4Di mice. g, Cell-to-cell Pearson’s correlation of ChC–M2 neuron pairs in sessions 1 and 7 during locomotion and rest epochs (four ChC-hM4Di mice, n = 1,957 pairs for session 1, two-tailed two-sample Kolmogorov–Smirnov test, locomotion versus rest, D = 0.076, P = 2.12 × 10−5; n = 1,723 pairs for session 7, locomotion versus rest, D = 0.28, P = 4.049 × 10−61). ***P < 0.001; shadings indicate s.e.m. Source data
Fig. 7
Fig. 7. Abolition of ChC inhibition impairs the refinement of direction coding and motor learning.
a, Generation of Nkx2.1-2a-CreER::Flex-FlpO mice. Nkx2.1-2a-CreER::Flex-FlpO mice were generated by crossing Nkx2.1-2a-CreER with ROSA-Flex-FlpO mouse lines. The targeting vector containing Rosa26 homology arms, a CAG promoter and a FLEX-Flp cassette was constructed. Similarly to Nkx2.1-2a-CreER::Ai14, Tmx was administered to timed pregnant Swiss Webster females by oral gavage at E17. b, Schematic for selective abolition of GABA release from ChCs in M2 by expressing TeTxLC in ChC-Flp mice (Nkx2.1-2a-CreER::Flex-FlpO mice). c, A representative image of ChC neurons expressing TeTxLC-HA and neighboring neurons expressing GCaMP6s in Nkx2.1-2a-CreER::Flex-FlpO mice (left, n = 9 mice) and post hoc validation of ChCs’ axonal projection to the AIS of neighboring PyNs by AnKG staining (right). Yellow arrowheads indicate putative cartridges associated with AISs. dl, Behavioral impact of ChC manipulation. d, Representative movement traces of mice in ChC control (top) and ChC-TeTxLC (bottom) navigating on the multi-textured floating ball maze in session 7 (100 s). A circle with a dashed line indicates the goal spot on the ball. Heat map and contour lines of the times of mice spent on the location are presented. e, Average movement speed (n = 9 mice for ChC-TeTxLC group; n = 8 mice for ChC control group; two-way repeated-measures ANOVA, Fgroup = 1.16, P = 0.32). f, Average movement acceleration (two-way repeated-measures ANOVA, Fgroup = 3.22, P = 0.12). g, Average number of successes obtained in training sessions (two-way repeated-measures. ANOVA, Fgroup = 8.54, P = 0.011). h, Average latency to reward (two-way repeated-measures ANOVA, Fgroup = 7.81, P = 0.0136). i, Average goal proximity (two-tailed t-test, t = −2.52, P = 0.017 for ChC control; t = 1.38, P = 0.177 for ChC-TeTxLC). j, Movement accuracy (two-tailed t-test, t = −3.80, P = 6.67 × 10−4 for ChC control; t = −1.05, P = 0.30 for ChC-TeTxLC). k, Cumulative turning angle over time in sessions 1 and 7. l, Comparison of cumulative turning angle between ChC-TeTxLC and ChC control (two-tailed t-test, t = −3.21, P = 3.51 × 10−3 for ChC control; t = −1.39, P = 0.175 for ChC-TeTxLC). m, Example tuning curves of individual premotor neurons for movement. Data are sorted from the location of peak likelihood probability P(active|MD). n, Normalized percentage of active cells in the population as a function of distance from the PD (n = 378 cells for session 1, n = 416 cells for session 7 in ChC-TeTxLC; n = 665 cells for session 1, n = 689 cells for session 7 in ChC control). o, Changes of the percentage of active cells from session 1 to session 7 (n = 5 mice for ChC-TeTxLC, two-tailed Student’s t-test. t = 0.56, P = 0.606; n = 4 mice for ChC control. t = −17.97, P = 3.76 × 10−4). p, Pairwise correlations with respect to ΔPD normalized by session 1 (angular difference in PD between neuronal pairs, n = 15,028 pairs for session 1, n = 22,589 pairs for session 7 for ChC-TeTxLC; n = 57,956 pairs for session 1, n = 62,104 pairs for session 7 for ChC control). q, Changes in posterior probabilities, P(MD|active), normalized by chance level (dashed line) as a function of distance from MD with learning. NS, not significant; *P < 0.05; **P < 0.01; ***P < 0.001; error bars and shading indicate s.e.m. In the box plot, the midline, box size and whisker indicate median, 25th–75th percentile and 10th–90th percentile, respectively. 2p, two-photon; CW, clockwise; CCW, counterclockwise; a.u., arbitrary units. Source data
Fig. 8
Fig. 8. Heterogeneous axo-axonic synaptic plasticity underlies organized motor control.
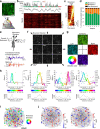
a,b, Immunostaining of the AIS by AnkG (green) and inhibitory postsynaptic gephyrin (red) visualizes the corresponding synaptic composition (yellow) of ChC (magenta) to AIS contacts. DAPI stains nuclei (blue; n = 22 in total). c, Schematics of automated detection of ChC-innervated AISs (ChC–AISs). d, Representative examples of ChC–AIS evaluation of Pre-SSE and Post-SSE. Filled and empty arrows indicate ChC–AIS and non-ChC–AIS synapses, respectively. SSE values were classified into three subgroups (high: >1.5 for Pre-SSE, >0.6 for Post-SSE; low: <0.5 for Pre-SSE, <0.1 for Post-SSE; mid: between high and low). White triangles indicate gephyrin puncta on the AIS associated (filled) and non-associated (open) with the ChC cartridge. eh, Examples of pre-SSE and post-SSE distribution in each slice for the experimental (learning) group and the control group (n = 10 and n = 12 for the experimental group and control group, respectively). i, Scatter plot of pre-SSEs and post-SSEs for each group. j, SSEs by the position of AISs within the cortical layer 2 for each group (n = 5 and n = 6 for the experimental group and control group). k,l, CDFs from individual mice (P = 5 × 10−5 for k and P = 2 × 10−11 for l; error bars = s.e.m., left axis) and the difference between the averages for the experimental and control conditions (experimental versus control, right axis). m,n, Probabilities by pre-SSE and post-SSE strength subgroups (high, mid and low) from individual mice. Error bars indicate s.e.m. Differences of probability distributions for pre-SSE and post-SSE (experimental versus control) (o,p) and proportional changes (experimental versus control) in the probability of each subgroup (q,r), which is confirmed by 10 independent robust random samplings (n = 3,000 each). In both SSEs, high and low subgroups were increased. The results were compared to proportional changes between unlabeled random pairs. For bootstrapping statistics (or), the mean and error of each bin were calculated from 10 distributions generated by independent robust random sampling (n = 3,000). For each random sampling, the probability distribution of a mouse was randomly selected from each condition (experimental and control) and used to calculate differences. Error bars indicate s.d.; P = 2.0 × 10−4 for all bins. s, Model for axo-axonic structural plasticity by heterosynaptic competition. The CDFs were tested by two-tailed two-sample Kolmogorov–Smirnov test, and the other distributions were tested by two-tailed Wilcoxon–Mann–Whitney test. Scale bars, 100 μm (a,eh) and 5 μm (b,d). Every fluorescence image is presented by maximum intensity projection of the corresponding volumetric stack with pseudo-colors. ***P < 0.001; ****P < 0.0001; *****P < 0.00001. C, control; E, experimental; Exp., experimental. Source data
Extended Data Fig. 1
Extended Data Fig. 1. The premotor cortex is required for organized purposive motor control.
(a-j) Blockage of local glutamate release in the premotor cortex impaired organized motor control. (a) Schematic of virus injection of tetanus toxin light-chain, which blocks local glutamate transmission from excitatory neurons in the premotor cortex by co-expressing AAV1.CaMKII-Cre and AAV1.Flex-tetanus toxin light-chain for CaMKII-TeTxLC group. (b) Representative movement trace (100 s) of a mouse in CaMKII-TeTxLC group on the ball (left) from training sessions 1 to 7 and its 2-dimensional projection (right). (c) Average movement speed of CaMKII-TeTxLC (n = 27 for the experimental group, Exp; n = 7 for CaMKII-TeTxLC; two-way repeated measures ANOVA, Fgroup = 0.45, P = 0.53). (d) Average movement acceleration (two-way repeated measures ANOVA, Fgroup = 19.59, P = 0.0044). (e) Average number of successes obtained in training sessions (two-way repeated measures. ANOVA, Fgroup = 24.11, P = 0.0027). (f) Average latency to reward of CaMKII-TeTxLC (two-way repeated measures ANOVA, Fgroup = 24.11, P = 3.50 × 10⁻⁴). (g) Average goal proximity of CaMKII-TeTxLC (two-tailed t -test, t = −5.19, P = 1.03 × 10⁻⁶ for Exp; t = −0.06, P = 0.95 for CaMKII-TeTxLC). (h) Movement accuracy of CaMKII-TeTxLC (two-tailed t -test, t = −7.04, P = 2.01 × 10⁻¹⁰ for Exp; t = −1.54, P = 0.135 for CaMKII-TeTxLC). (i) Cumulative turning angle of CaMKII-TeTxLC over time in Sessions 1 and 7. (j) Comparison of cumulative turning angle between Exp and CaMKII-TeTxLC (two-tailed t -test, t = −5.84, P = 5.76 × 10⁻⁸ for Exp; t = −2.05, P = 0.050 for CaMKII-TeTxLC). n.s., not significant; ** P < 0.01; *** P < 0.001; Error bars indicate s.e.m. In the box plot, the midline, box size, and whisker indicate median, 25-75th percentile, and 10-90th percentile, respectively. Source data
Extended Data Fig. 2
Extended Data Fig. 2. Movement direction selective responses of premotor neurons.
(a) Schematic of the navigation task on ball maze with 2-photon calcium imaging and a representative field of view of layer 2/3 premotor neurons expressing GCaMP6. (b) An example trace of mouse movement speed (top), aligned averaged fluorescence transients (middle), and a corresponding heat-map raster plot (bottom). Shading indicates s.e.m. (c) Normalized fluorescence transients of premotor neurons aligned to movement onsets. (d) Summary graph of movement-related neurons throughout training. (e) Schematic that depicts the estimation of movement direction based on forward-backward and right-left speeds. (f) Average fluorescence imaging frames during responses to varying movement directions (n = 6 mice). (g) A color-coded, pixel-based map of neuron activity with respect to movement direction tuning. (h) Top, four example calcium transient events by movement direction (dots) and direction tuning curves of premotor neurons (top, colored-curve). Movement direction is color-coded. The gray line indicates the average tuning curve from shuffled data. Bottom, corresponding z-scores of the actual tuning curves normalized by the tuning curves of the shuffled data (n = 100 for random shuffling). Error bars indicate s.e.m. (i) An exemplary preferred direction map. The color indicates the preferred direction of individual cells. Black and gray color indicate non-direction-tuned neurons. The salt-and-pepper layout of color indicates functional heterogeneity in direction-selectivity in the premotor cortex. (j) Two examples of the heterogeneous spatial distribution of ΔPD (angular difference in preferred direction) between neuronal pairs. The same neuronal population as in i, with color-coding by ΔPD (angular difference in preferred direction between reference neuron and another direction-tuned neuron). Numbered neurons indicate reference neurons. Source data
Extended Data Fig. 3
Extended Data Fig. 3. Population coding of movement direction in premotor neurons.
(a) Movement direction tuning curves for each individual premotor neuron sorted from peak probability location (top). The prior probability of movement direction (middle). The marginal likelihood of being active (bottom). (b) Tuning curves of neurons corresponding to movement direction at a given moment (top) and posterior probability of movement direction (bottom) given activity from all neurons (left) from active neurons (center), and from inactive neurons (left). Actual movement direction (MD) and decoded movement direction estimated with maximum a posteriori (MAP) are shown. (c) An example of changes in posterior probabilities, P(MD|A), normalized by chance level (dotted line) from a mouse of the experiential group, for active (left) and inactive neurons (right) as a function of distance from movement direction with learning. (d) Sparse population coding of movement direction during navigation; animal’s movement direction (MD, magenta), preferred directions of individual active direction-tuned neurons (PD, gray), and population vector (PoV, the vector sum of the preferred directions, blue) are superimposed. Corresponding maps of active neurons during movement. (e) Comparison between movement direction and sparse population vector. Each dot is color-coded by the percentage of coactive neurons in the population. (f) The angular error between the population vector and actual movement direction as a function of the number of coactive direction-tuned (DT) cells. The dotted line with a negative slope coefficient indicates a linear fit of the data. (g) An example of population coding of movement direction in session 1 (top) and session 7 (bottom). Magenta, cyan, and gray arrow lines indicate an animal’s movement direction, population vector direction, and active neurons’ preferred direction, respectively (left). Preferred direction map of the active population (right, filled ROIs). The filled color and ROI arrow indicate the corresponding preferred direction. (h) Polar distribution of angular errors between PoV and MD in the experimental group (session 1, gray; session 7, light blue). (i) Changes of the cumulative distribution of similarity index between PoV and MD with learning (two-tailed two-sample Kolmogorov-Smirnov test, D = 0.0495, P = 0.0003 for the experimental group, n = 6 mice; D = 0.027, P = 0.12 for the control group, n = 5 mice). (j) Polar distribution of angular errors between PD and MD in the experimental group (session 1, gray; session 7, light blue). (k) Changes of the cumulative distribution of similarity index between active neurons’ PD and MD with learning (two-tailed two-sample Kolmogorov-Smirnov test, D = 0.0533, P = 2.68×10⁻¹⁰ for the experimental group, n = 6 mice; D = 0.0584, P = 2.61×10⁻¹⁰ for the control group, n = 5 mice). ***P < 0.001; n.s., not significant. Error bars indicate s.e.m. Source data
Extended Data Fig. 4
Extended Data Fig. 4. Silencing perisomatic inhibition disrupts organized motor control.
(a) 2-dimensional projections of representative movement traces of mice on the ball in PV-NpHR and SOM-NpHR groups with photoinhibition (Session 8) and without photoinhibition (Session 9). Blockage of local glutamate release in the premotor cortex impaired organized motor control. (b) Average movement speed of PV-NpHR and SOM-NpHR (n = 8 mice for PV-NpHR, one-way repeated measures ANOVA with Greenhouse-Geisser correction for Sessions 7, 8, and 9, Fsession = 10.16, P = 0.0019, Fisher multiple comparisons tests, Session 7 vs. 8, P = 0.003; Session 7 vs. 9, P = 0.61, Session 8 vs. 9, P = 0.001; n = 5 mice for SOM-NpHR, Fsession = 1.08, P = 0.38). (c) Average movement acceleration (PV-NpHR, one-way repeated measures ANOVA for sessions 7, 8, and 9, Fsession = 0.45, P = 0.65; SOM-NpHR, Fsession = 3.69, P = 0.07). (d) Average latency to reward (PV-NpHR, one-way repeated measures ANOVA with Greenhouse-Geisser correction for sessions 7, 8, and 9, Fsession = 9.55, P = 0.014, Fisher multiple comparisons tests, Session 7 vs. 8, P = 0.002; Session 7 vs. 9, P = 0.97, Session 8 vs. 9, P = 0.0021; SOM-NpHR, Fsession = 0.094, P = 0.84). (e) Average goal proximity of PV-NpHR and SOM-NpHR in Sessions 7, 8, and 9 (PV-NpHR, one-way repeated measures ANOVA with Greenhouse-Geisser correction, Fsession = 40.67, P = 3.05 × 10⁻⁵, Fisher multiple comparisons tests, Session 7 vs. 8, P = 2.12 × 10⁻⁶; Session 7 vs. 9, P = 0.84, Session 8 vs. 9, P = 1.56 × 10⁻⁶; SOM-NpHR, Fsession = 1.57, P = 0.28). (f) Movement accuracy of PV-NpHR and SOM-NpHR in Sessions 7, 8, and 9 (PV-NpHR, one-way repeated measures ANOVA with Greenhouse-Geisser correction, Fsession = 13.9, P = 4.72 × 10⁻⁴. Fisher multiple comparisons tests, Session 7 vs. 8, P = 7.39 × 10⁻⁴; Session 7 vs. 9, P = 0.62, Session 8 vs. 9, P = 2.84 × 10⁻⁴; SOM-NpHR, Fsession = 3.06, P = 0.14). (g) Cumulative turning angle of PV-NpHR and SOM-NpHR over time. (h) Comparison of cumulative turning angle between PV-NpHR and SOM-NpHR (PV-NpHR, two-tailed Friedman test for Sessions 7, 8, and 9, χ2(2) = 13, P = 0.0015, Dunn’s multiple comparisons tests, Session 7 vs. 8, P = 0.037; Session 7 vs. 9, P = 0.95, Session 8 vs. 9, P = 0.0014; SOM-NpHR, χ2(2) = 2.8, P = 0.25). n.s., not significant; ** P < 0.01; *** P < 0.001; Error bars indicate s.e.m. In the box plot, the midline, box size, and whisker indicate median, 25-75th percentile, and 10-90th percentile, respectively. Source data
Extended Data Fig. 5
Extended Data Fig. 5. Genetical labeling of cortical chandelier cells in L2/3 premotor cortex.
(a) Generation of Nkx2.1-2a-CreER::Ai14 mice. Nkx2.1-2a-CreER::Ai14 were generated by crossing Nkx2.1-2a-CreER with Ai14 mouse lines. A 2A-CreER cassette was inserted into the frame immediately after an open reading frame of an Nkx2.1 gene. To induce CreER activity in the offspring, tamoxifen was administered to timed pregnant SW females by oral gavage at E17. (b) A representative image of ChC located in layer 2/3 premotor cortex. (c) Light-sheet microscope image of ChCs’ densely branching axonal cartridges in layer 2/3 of the premotor cortex. (d) Cortical depth of ChC soma location from pia (n = 90 ChCs from 5 mice). Most of the ChCs marked by viral expression were located in the upper L2/3 (87 out of 90 ChCs) and 3 % of the ChCs were in the L5 (3 out of 90 ChCs). In the box plot, the white line, box size, and whisker indicate median, 25-75th percentile, and 10-90th percentile, respectively. Source data
Extended Data Fig. 6
Extended Data Fig. 6. Sparse expression of tetanus toxin light chain in parvalbumin interneurons.
(a) Example image of the expressions of AAV-hSyn-GCaMP6s (green) and AAV-hSyn-FLEX-TeTxLC-P2A-NLS-dTomato (red, 1:2,000 diluted) in L2/3 premotor cortex of PV-Cre mice (sparse PV-TeTxLC, n = 7 mice). (b) Example image of the expressions of AAV-hSyn-GCaMP6s (green) and AAV-hSyn-FLEX-TeTxLC-P2A-NLS-dTomato (magenta) in L2/3 premotor cortex of Vipr2-Cre mice (ChC-TeTxLC, n = 5 mice). (c) The density of cells expressing TeTxLC (n = 7 mice for sparse PV-TeTxLC; n= 5 mice for expression of ChC-TeTxLC ; n= 11 mice for expression of FLEX -tdTomato in Vipr2-Cre mice, ChC-tdT; one-way ANOVA, Fgroup = 0.62, P = 0.547). (d) Average movement speed (top), the normalized activity of premotor neurons (middle), and probability of maximum neuron activation (bottom) aligned to movement onset for sessions 1 and 7 in sparse PV-TeTxLC (n = 624 cells for session 1 and 739 cells for session 7, 7 mice) and PV control (n = 480 cells for session 1 and 533 cells for session 7, 7 mice). Shading indicates s.e.m. (e) The average number of successes for sparse PV-TeTxLC and PV control mice increased with learning (n = 7 mice for sparse PV-TeTxLC; n = 7 mice for PV control; two-way repeated measures ANOVA, Fgroup = 0.050, P = 0.831). (f) The average latency to reward for sparse PV-TeTxLC and PV control mice decreased with learning (n = 7 mice for sparse PV-TeTxLC; n = 7 mice for PV control; two-way repeated measures ANOVA, Fgroup = 0.346, P = 0.578). n.s., not significant; Error bars and shading indicate s.e.m. Source data
Extended Data Fig. 7
Extended Data Fig. 7. Automated detection of ChC-AIS interaction.
(a-b) Example images of AIS and ChC in the M2 of Vipr2-Cre mice expressing AAV1-CAG-Flex-tdTomato. (c-d) Detected AISs and ChC axonal bouton cartridges by an automated detection tool. (e) Detected ChC-innervated AISs (ChC-AISs) with the white colocalized area (n = 22 for a-e). Representative images are maximum intensity projections of 400 × 206 × 10 μm3. Scale bar = 100 μm for a-e. The dotted lines represent the layer 1/2 border (white) and the 250 μm-deep from the border approximately (yellow). (f) Probability distribution of ChC somas and ChC-AISs by their position in layer 2. Only ChC-AISs within the range from 0 to 250 μm from layer 1/2 borders were considered as in layer 2 and analyzed further. (g) Examples of samples (125 × 125 × 10 μm3) used to evaluate the performance of automated AIS detection (n = 6; Scale bar = 100 μm). (h) Performance of AIS detection evaluated by comparing the results to manual detection in 4 different categories (Sensitivity = probability that a manually detected AIS is detected automatically. Accuracy = probability that an automatically detected AIS is detected manually. Merge = probability that an automatically detected AIS corresponds to multiple AISs in manual detection. Shortening = probability that an automatically detected AIS length is significantly shorter than manual detection). Source data
Extended Data Fig. 8
Extended Data Fig. 8. Evaluation of ChC-AIS synaptic structural efficacy.
(a) Automatically detected segments were processed to extract quantities as the total AIS length (LAIS), the ChC cartridge length (LChC), the AIS length covered by ChC (LChC_AIS), the area of ChC on AIS (AChC-AIS), and z-scored intensity of gephyrin puncta on AIS and ChC-AIS (ZAIS and ZChC-AIS) for characterization. Those quantities were used to compute the defined characteristic value of presynaptic structural efficacy (Pre-SSE) and postsynaptic structural efficacy (Post-SSE). Every image represents the maximum intensity projection of the corresponding volumetric stack (Details in Methods). (b-e) Normalized histograms of Pre-SSE and Post-SSE from mice in the control group (n = 6 mice) and the experimental (learning) group (n = 5 mice). (f-i) We performed a random sampling test (n = 3000) repetitively (10 times) to compare individual distributions after training. The difference in probability was significant between the Experimental and Control condition (E vs C). We did not observe any significant difference between any other pair (random sampling from the Control and Control (C vs C), Exp. vs. Exp. (E vs E), or Unlabeled vs. Unlabeled (U vs U)). The distributions were compared by a two-tailed Wilcoxon-Mann-Whitney test. Source data

Update of

Similar articles

Cited by

References

    1. Xu T, et al. Rapid formation and selective stabilization of synapses for enduring motor memories. Nature. 2009;462:915–919. - PMC - PubMed
    1. Lai CSW, Franke TF, Gan W-B. Opposite effects of fear conditioning and extinction on dendritic spine remodelling. Nature. 2012;483:87–91. - PubMed
    1. Peters AJ, Chen SX, Komiyama T. Emergence of reproducible spatiotemporal activity during motor learning. Nature. 2014;510:263–267. - PubMed
    1. Hofer SB, Mrsic-Flogel TD, Bonhoeffer T, Hubener M. Experience leaves a lasting structural trace in cortical circuits. Nature. 2009;457:313–317. - PMC - PubMed
    1. Petreanu L, et al. Activity in motor–sensory projections reveals distributed coding in somatosensation. Nature. 2012;489:299–303. - PMC - PubMed

Publication types