. 2023 Jul 20;14(1):4368.
doi: 10.1038/s41467-023-39262-2.

Antiviral HIV-1 SERINC restriction factors disrupt virus membrane asymmetry

Affiliations

Antiviral HIV-1 SERINC restriction factors disrupt virus membrane asymmetry

Susan A Leonhardt et al. Nat Commun. .

Abstract

The host proteins SERINC3 and SERINC5 are HIV-1 restriction factors that reduce infectivity when incorporated into the viral envelope. The HIV-1 accessory protein Nef abrogates incorporation of SERINCs via binding to intracellular loop 4 (ICL4). Here, we determine cryoEM maps of full-length human SERINC3 and an ICL4 deletion construct, which reveal that hSERINC3 is comprised of two α-helical bundles connected by a ~ 40-residue, highly tilted, "crossmember" helix. The design resembles non-ATP-dependent lipid transporters. Consistently, purified hSERINCs reconstituted into proteoliposomes induce flipping of phosphatidylserine (PS), phosphatidylethanolamine and phosphatidylcholine. Furthermore, SERINC3, SERINC5 and the scramblase TMEM16F expose PS on the surface of HIV-1 and reduce infectivity, with similar results in MLV. SERINC effects in HIV-1 and MLV are counteracted by Nef and GlycoGag, respectively. Our results demonstrate that SERINCs are membrane transporters that flip lipids, resulting in a loss of membrane asymmetry that is strongly correlated with changes in Env conformation and loss of infectivity.


Conflict of interest statement

The authors declare no competing interests.

Figures
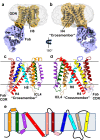
Fig. 1
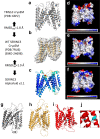
Fig. 1. The integral membrane protein hSERINC3 is comprised of two α-helical bundles connected by a ~40-residue, highly tilted, “crossmember” helix.
CryoEM map of full-length, WT hSERINC3 (a, b: gold) with a bound Fab (a, b: purple). The associated GDN detergent micelle is shown in transparent gray. c, d The cryoEM map shows that hSERINC3 is comprised of two α-helical bundles. The Fab-proximal bundle contains H5, 6, 7, and 10, and the distal bundle contains H1, 2, 3, and 9. The two bundles are connected by a long 40-residue, diagonal “crossmember” α-helix (H4). H4 is paired with H8, which has an ill-defined density in the full-length WT map attributed to conformational variability (a) and is well-ordered in the ΔICL4 deletion mutant (Supplementary Fig. 6e). e TM α-helices in the primary structure colored as in c and d. The horizontal lines in ce demarcate the bilayer-embedded region of hSERINC3.
Fig. 2
Fig. 2. Conservation in the molecular design of Drosophila TMS1d, hSERINC3 structures and AlphaFold SERINC models, with location of hSERINC5 point mutants that abrogate restriction.
a The Drosophila TMS1d monomer extracted from the cryoEM structure of the hexameric protein. b The WT hSERINC3 cryoEM model and map. c An AlphaFold model of hSERINC3 colored by pLDDT confidence score (blue, very high; cyan, high; yellow, low; orange very low). Low and very low-confidence loops were the same regions missing in the cryoEM maps and were removed for comparison. Backbone RMSDs for the TM domains were calculated in PyMOL. RMSDs are lower when aligning the TM bundles separately. df Vacuum electrostatic surface potentials for each model calculated in PyMOL demonstrating fairly similar electrostatic distributions for the three models (red, anionic and blue, cationic). Ribbon representation of AlphaFold 3D models for g hSERINC2 (gray), h hSERINC3 (gold), and i hSERINC5 (red). Point mutations in H8 and H9 are colored in cyan and boxed. j Closeup of (i) highlighting the hSERINC5-S328I mutation in H8 and the V396C and F397L mutations in H9 that abrogate restriction. (H1 was removed for clarity.).
Fig. 3
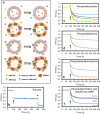
Fig. 3. Fluorescent proteoliposome assay demonstrates that hSERINC3 exhibits lipid flipping activity for PC, PE, and PS.
a Cartoon showing that the membrane-impermeable, reducing agent dithionite eliminates NBD fluorescence. hSERINC is displayed as being inserted randomly inside-out/outside-in, with blue showing the water cavity between the α-helical bundles. The NBD-glucose assay shows that (i) empty liposomes and (ii) hSERINC3-containing liposomes are not leaky. (iii) Exterior leaflet NBD-lipids should be accessible to dithionite resulting in ~50% reduction in fluorescence. (iv) Liposomes containing hSERINC3 should expose inner leaflet NBD-lipids for reduction by dithionite, resulting in ~100% loss of fluorescence. b NBD-glucose assay demonstrates that liposomes containing a high concentration of hSERINC3 (1.5 µg/mg lipid) are not leaky. The dithionite reduces the fluorescence of extravesicular NBD-glucose (60 µM). The stable fluorescent signal from 100 to 500 s indicates the protection of the encapsulated NBD-glucose from dithionite. Confirmation of entrapment was indicated by the reduction of fluorescence to near-zero upon solubilization of the liposomes at 500 s by the addition of Triton X-100 (indicated by *). cf Arrows indicate the addition of dithionite at 100 s. The blue curves correspond to the fluorescent profiles for empty liposomes, which display a 40–50% loss of fluorescence upon the addition of dithionite. c Representative profiles display the direct dependence of the fluorescent signal on the concentration of hSERINC3 in liposomes containing NBD-PC. Blue, purple, green, yellow, and orange curves correspond to 0.0, 0.25, 0.5, 1.0, and 1.5 µg/mg lipid of hSERINC3, respectively (assuming 100% reconstitution of protein) (n = 2). d, e The fluorescent signals of NBD-PS and NBD-PE, respectively, drop to near-zero upon the addition of dithionite to liposomes containing 1.5 µg/mg lipid of hSERINC3. f The adenosine receptor A2AAR (1.5 µg/mg lipid) is a known lipid transporter and serves as a positive control for the assay (green). The glutamate transfer homolog GltpH (1.5 µg/mg lipid) has previously been shown to not have lipid flipping activity and serves as a negative control for the assay (purple). b, df Data were representative fluorescence traces of at least three independent experiments. Source data are provided as a Source Data file.
Fig. 4
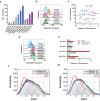
Fig. 4. PS exposure by hSERINC5 on virus particles correlates with inhibition of infectivity and conformational changes in Env and is antagonized by HIV-1 Nef and MLV GlycoGag.
a HIV-1NL4-3ΔNef particles were produced in the presence of indicated plasmids and titered on TZM-Bl indicator cells by luciferase assay. Results represent the mean of n = 7 independent experiments ± SEM. b HIV-1NL4-3ΔRTΔNef virus particles containing Gag-GFP and CD63-mRFP were produced in the presence of indicated hSERINC5 or mTMEM16F plasmid, bound to anti-CD63 magnetic beads, stained with Alexa647-annexin V, and imaged by flow cytometry. Histograms depict annexin V intensity for the GFP-positive population. Results reflect one representative experiment of n = 3 biological replicates. c PS exposure was assessed as in (b) and plotted in relation to virus infectivity as in (a) for the indicated hSERINC5 (S5) or mTMEM16F proteins. Values represent mean ± SD from n = 3 independent experiments. d HIV-1NL4-3ΔNef or NefC-expressing virus particles were produced in the presence of indicated hSERINC5 or mTMEM16F plasmid and analyzed as in (b). Histograms depict annexin V intensity for the GFP-positive population from one representative of n = 3 independent experiments. e Annexin V mean fluorescence intensity is shown for HIV-1 particles ± Nef as in (d). Values represent the mean ± SEM from n = 3 independent experiments. Percent annexin V-positive MLV particles imaged by confocal microscopy as in (Supplementary Fig. 9). Values represent the mean ± SEM from five independent experiments. f HIV-1NL4-3ΔRTΔNef virus particles were produced in the presence of WT hSERINC5 or the F397L mutant and the conformational state of HIV-1 Env was analyzed by single-molecule FRET (see also Supplementary Fig. 10). N is the number of individual dynamic molecule traces complied into a population FRET histogram (gray lines) and fitted into a three-state Gaussian distribution (solid) centered at ~0.15-FRET, ~0.35-FRET, and ~0.6-FRET. Histogram error bars represent the mean FRET probabilities ± SEM. g HIV-1NL4-3ΔRTΔNef virus particles were produced in the presence of mTMEM16F GY (blue) or mTMEM16F DW (red) and the conformational state of HIV-1 Env was analyzed by single-molecule FRET as in (f). Source data are provided as a Source data file.
Fig. 5
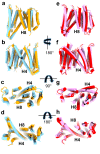
Fig. 5. hSERINC3 cryoEM and hSERINC5 AlphaFold analysis reveal conformational states consistent with an alternating access mechanism for lipid flipping.
ad Superposition of full-length, WT hSERINC3 (gold) and ΔICL4-hSERINC3 cryoEM models (blue) shows a rotation of the helical bundles around H8. eh The top two AlphaFold models of hSERINC5 also reveal conformational states similar to those of the hSERINC3 cryoEM structures. The domain rotations seen in the cryoEM structures and AlphaFold models involve a hinge-like flexion of the H4 crossmember helix in the center of the bilayer (*) consistent with an alternating access mechanism. In the WT hSERINC3 cryoEM map, H8 is disordered, whereas the rod-like density for H8 is well-defined in ΔICL4-hSERINC3 (Supplementary Fig. 7e). Similarly, H8 has lower confidence scores in the hSERINC5 AlphaFold models, and there is a large difference in the conformation of H8 in the top two models. These observations suggest that H8 dynamics are integral to SERINC conformational changes and support a role for ICL4 in the regulation of these structural states.

Similar articles

Cited by

References

    1. Inuzuka M, Hayakawa M, Ingi T. Serinc, an activity-regulated protein family, incorporates serine into membrane lipid synthesis. J. Biol. Chem. 2005;280:35776–35783. - PubMed
    1. Rosa A, et al. HIV-1 Nef promotes infection by excluding SERINC5 from virion incorporation. Nature. 2015;526:212–217. - PMC - PubMed
    1. Usami Y, Wu Y, Gӧttlinger HG. SERINC3 and SERINC5 restrict HIV-1 infectivity and are counteracted by Nef. Nature. 2015;526:218–223. - PMC - PubMed
    1. Dai W, Usami Y, Wu Y, Gӧttlinger H. A long cytoplasmic loop governs the sensitivity of the anti-viral host protein SERINC5 to HIV-1 Nef. Cell Rep. 2018;22:869–875. - PMC - PubMed
    1. Diehl, W. E. et al. Influence of different glycoproteins and of the virion core on SERINC5 antiviral activity. Viruses10.3390/v13071279 (2021). - PMC - PubMed

Publication types