Resistance training diminishes mitochondrial adaptations to subsequent endurance training in healthy untrained men
- PMID: 37470322
- PMCID: PMC11062412
- DOI: 10.1113/JP284822
Resistance training diminishes mitochondrial adaptations to subsequent endurance training in healthy untrained men
Abstract
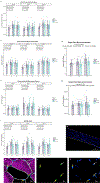
We investigated the effects of performing a period of resistance training (RT) on the performance and molecular adaptations to a subsequent period of endurance training (ET). Twenty-five young adults were divided into an RT+ET group (n = 13), which underwent 7 weeks of RT followed by 7 weeks of ET, and an ET-only group (n = 12), which performed 7 weeks of ET. Body composition, endurance performance and muscle biopsies were collected before RT (T1, baseline for RT+ET), before ET (T2, after RT for RT+ET and baseline for ET) and after ET (T3). Immunohistochemistry was performed to determine fibre cross-sectional area (fCSA), myonuclear content, myonuclear domain size, satellite cell number and mitochondrial content. Western blots were used to quantify markers of mitochondrial remodelling. Citrate synthase activity and markers of ribosome content were also investigated. RT improved body composition and strength, increased vastus lateralis thickness, mixed and type II fCSA, myonuclear number, markers of ribosome content, and satellite cell content (P < 0.050). In response to ET, both groups similarly decreased body fat percentage (P < 0.0001) and improved endurance performance (e.g. , and speed at which the onset of blood lactate accumulation occurred, P < 0.0001). Levels of mitochondrial complexes I-IV in the ET-only group increased 32-66%, while those in the RT+ET group increased 1-11% (time, P < 0.050). Additionally, mixed fibre relative mitochondrial content increased 15% in the ET-only group but decreased 13% in the RT+ET group (interaction, P = 0.043). In conclusion, RT performed prior to ET had no additional benefits to ET adaptations. Moreover, prior RT seemed to impair mitochondrial adaptations to ET. KEY POINTS: Resistance training is largely underappreciated as a method to improve endurance performance, despite reports showing it may improve mitochondrial function. Although several concurrent training studies are available, in this study we investigated the effects of performing a period of resistance training on the performance and molecular adaptations to subsequent endurance training. Prior resistance training did not improve endurance performance and impaired most mitochondrial adaptations to subsequent endurance training, but this effect may have been a result of detraining from resistance training.
Keywords: HIIT; aerobic training; mitochondrial remodelling; skeletal muscle; strength training.
© 2023 The Authors. The Journal of Physiology © 2023 The Physiological Society.
Figures


Update of
-
Resistance Training Diminishes Mitochondrial Adaptations to Subsequent Endurance Training.bioRxiv [Preprint]. 2023 Apr 6:2023.04.06.535919. doi: 10.1101/2023.04.06.535919. bioRxiv. 2023. Update in: J Physiol. 2023 Sep;601(17):3825-3846. doi: 10.1113/JP284822 PMID: 37066356 Free PMC article. Updated. Preprint.
Comment in
-
Resistance towards endurance training-mediated skeletal muscle mitochondrial adaptations: implications for individuals with type 1 diabetes mellitus.J Physiol. 2023 Nov;601(21):4665-4666. doi: 10.1113/JP285685. Epub 2023 Oct 7. J Physiol. 2023. PMID: 37804115 No abstract available.
Similar articles
-
Resistance Training Diminishes Mitochondrial Adaptations to Subsequent Endurance Training.bioRxiv [Preprint]. 2023 Apr 6:2023.04.06.535919. doi: 10.1101/2023.04.06.535919. bioRxiv. 2023. Update in: J Physiol. 2023 Sep;601(17):3825-3846. doi: 10.1113/JP284822 PMID: 37066356 Free PMC article. Updated. Preprint.
-
Comparison of two lower-body modes of endurance training on lower-body strength development while concurrently training.J Strength Cond Res. 2009 May;23(3):979-87. doi: 10.1519/JSC.0b013e3181a0629d. J Strength Cond Res. 2009. PMID: 19387377 Clinical Trial.
-
Skeletal Muscle Adaptive Responses to Different Types of Short-Term Exercise Training and Detraining in Middle-Age Men.Med Sci Sports Exerc. 2021 Oct 1;53(10):2023-2036. doi: 10.1249/MSS.0000000000002684. Med Sci Sports Exerc. 2021. PMID: 33867497 Clinical Trial.
-
The Effect of Two Different Concurrent Training Programs on Strength and Power Gains in Highly-Trained Individuals.J Sports Sci Med. 2018 May 14;17(2):167-173. eCollection 2018 Jun. J Sports Sci Med. 2018. PMID: 29769816 Free PMC article.
-
Training Considerations for Optimising Endurance Development: An Alternate Concurrent Training Perspective.Sports Med. 2019 May;49(5):669-682. doi: 10.1007/s40279-019-01072-2. Sports Med. 2019. PMID: 30847824 Review.
Cited by
-
Proteolytic markers associated with a gain and loss of leg muscle mass with resistance training followed by high-intensity interval training.Exp Physiol. 2023 Oct;108(10):1268-1281. doi: 10.1113/EP091286. Epub 2023 Aug 17. Exp Physiol. 2023. PMID: 37589512 Free PMC article.
-
Skeletal muscle myosin heavy chain protein fragmentation as a potential marker of protein degradation in response to resistance training and disuse atrophy.bioRxiv [Preprint]. 2024 May 25:2024.05.24.595789. doi: 10.1101/2024.05.24.595789. bioRxiv. 2024. Update in: Exp Physiol. 2024 Oct;109(10):1739-1754. doi: 10.1113/EP092093 PMID: 38826385 Free PMC article. Updated. Preprint.
-
Effects of low-load resistance training with blood flow restriction on muscle fiber myofibrillar and extracellular area.Front Physiol. 2024 Feb 20;15:1368646. doi: 10.3389/fphys.2024.1368646. eCollection 2024. Front Physiol. 2024. PMID: 38444764 Free PMC article.
-
Sequencing Effects of Concurrent Strength and Endurance Training on Selected Measures of Physical Fitness in Young Male Soccer Players: A Randomized Matched-Pairs Trial.Sports Med Open. 2024 May 23;10(1):62. doi: 10.1186/s40798-024-00726-4. Sports Med Open. 2024. PMID: 38782805 Free PMC article.
-
Skeletal muscle myosin heavy chain fragmentation as a potential marker of protein degradation in response to resistance training and disuse atrophy.Exp Physiol. 2024 Oct;109(10):1739-1754. doi: 10.1113/EP092093. Epub 2024 Aug 24. Exp Physiol. 2024. PMID: 39180757 Free PMC article.
References
-
- Balsalobre-Fernandez C, Santos-Concejero J & Grivas GV. (2016). Effects of Strength Training on Running Economy in Highly Trained Runners: A Systematic Review With Meta-Analysis of Controlled Trials. J Strength Cond Res 30, 2361–2368. - PubMed
-
- Bassett DR Jr. & Howley ET. (2000). Limiting factors for maximum oxygen uptake and determinants of endurance performance. Med Sci Sports Exerc 32, 70–84. - PubMed
-
- Beattie K, Kenny IC, Lyons M & Carson BP. (2014). The effect of strength training on performance in endurance athletes. Sports Med 44, 845–865. - PubMed
-
- Borg GA. (1982). Psychophysical bases of perceived exertion. Med Sci Sports Exerc 14, 377–381. - PubMed
Publication types
MeSH terms
Grants and funding
LinkOut - more resources
Full Text Sources

