. 2023 Jul 19;14(1):4348.
doi: 10.1038/s41467-023-39936-x.

Characterising the RNA-binding protein atlas of the mammalian brain uncovers RBM5 misregulation in mouse models of Huntington's disease

Affiliations

Characterising the RNA-binding protein atlas of the mammalian brain uncovers RBM5 misregulation in mouse models of Huntington's disease

Meeli Mullari et al. Nat Commun. .

Abstract

RNA-binding proteins (RBPs) are key players regulating RNA processing and are associated with disorders ranging from cancer to neurodegeneration. Here, we present a proteomics workflow for large-scale identification of RBPs and their RNA-binding regions in the mammalian brain identifying 526 RBPs. Analysing brain tissue from males of the Huntington's disease (HD) R6/2 mouse model uncovered differential RNA-binding of the alternative splicing regulator RBM5. Combining several omics workflows, we show that RBM5 binds differentially to transcripts enriched in pathways of neurodegeneration in R6/2 brain tissue. We further find these transcripts to undergo changes in splicing and demonstrate that RBM5 directly regulates these changes in human neurons derived from embryonic stem cells. Finally, we reveal that RBM5 interacts differently with several known huntingtin interactors and components of huntingtin aggregates. Collectively, we demonstrate the applicability of our method for capturing RNA interactor dynamics in the contexts of tissue and disease.


Conflict of interest statement

The authors declare no competing interests.

Figures
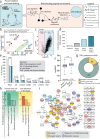
Fig. 1
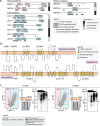
Fig. 1. Experimental setup for brain-pCLAP.
a Experimental workflow of brain-pCLAP: Brain halves from four mice (4X) were homogenized and the right half was cross-linked using UV-light (254 nm). Cells were spun down, and lysates were LysC treated, pre-cleared with empty beads and RNA-peptide complexes were purified using oligo(dT) beads. After elution and trypsin treatment, peptides were analysed using LC-MS/MS. The same experiment was conducted in parallel without the pre-clearance step. b PCA plot of MS data from all samples. c ‘Filter1’: Volcano plot comparing peptide intensities between cross-linked (XL) and non-cross-linked (noXL) samples (two-tailed t test with multiple-testing correction). Each detected peptide is represented by a dot and dots highlighted in black represent peptides from proteins with canonical RBDs. The lines represent thresholds for significant enrichment in the cross-linked (XL) and non-cross-linked samples (noXL). d Percentage of proteins previously annotated as RNA-binding in the proteome and proteins inferred from peptides identified by pCLAP before and after the two data filtering steps. e Number of proteins with shown canonical RBDs in the proteome and in brain-pCLAP with and without the data filtering steps. The p value indicates the enrichment of the fraction of proteins containing each domain in the final brain-pCLAP dataset over the fraction of these protein in the brain proteome (one-tailed Fischer’s exact test with FDR correction) (colours as in (d)). f Abundance distribution of total brain proteome and brain-pCLAP. The middle of the box signifies the mean, the box boundaries represent the 25th and 75th percentile and the whiskers reach to the minimum and maximum value of the dataset. n = 4 biologically independent animals. p value calculated using two-tailed t test, ****p < 0.0001. Source data are provided as a Source data file. g Donut plot showing the number of proteins identified by brain-pCLAP, which have also been identified as RBPs from cell line based studies and the number of known RBPs among the proteins specific to this study. h GO term enrichment for cellular compartment for proteins identified as RBPs specifically by brain-pCLAP or those overlapping with cell line based studies. i String network of the 95 proteins identified in this study as RNA binding not identified in previous cell culture-based studies.
Fig. 2
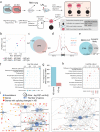
Fig. 2. Brain-pCLAP identifies known and novel RBPs.
a Locations of RNA-binding peptides identified by brain-pCLAP mapped to linear depictions of RBPs. Tissue expression data taken from brain atlas. b Schematic of membrane bound synaptic vesicle proteins identified as RNA-binding by brain-pCLAP, showing their trans-membrane domains as well as the locations of peptides identified by brain-pCLAP as RNA-binding regions (blue stars). c Data demonstrating RNA-binding ability of PGRMC1 and PGRMC2. Left: Volcano plots (as in Fig. 1c) with peptides from PGRMC1 or PGRMC2 marked in black. Middle: Schematic depiction of both proteins showing their trans-membrane and cytochrome b5-like domains and where the peptides identified by brain-pCLAP are located. Right: CLIP autoradiography for GFP-tagged PGRMC1 and PGRMC2, with visualization of the isotope labelled protein-RNA complex. The left lane is a no cross-link control, followed by the cross-linked samples from highest to lowest concentration of RNase (dilutions 1:10, 1:100 or 1:1000). The arrow points to the expected size of the protein. Each lane of each CLIP experiment represents a replicate of independently grown cells.
Fig. 3
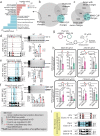
Fig. 3. Comparison of active RBPs in a HD and WT mouse brain samples.
a Volcano plot comparing peptides identified by brain-pCLAP in WT or HD mouse brain samples (two-tailed t-test with multiple-testing correction). b Linear representation of RBM5, its domains and brain-pCLAP identified peptides, with the regulated peptide highlighted by an arrow. c Average Log2 intensities of RBM5 peptides from all brain-pCLAP experiments in this study. d Average Log2 expression intensity of RBM5 peptide spanning amino acids 104–115 in the brain proteome. e Western blot of RBM5 and loading control GAPDH from WT and HD mouse brain tissues (left) and quantification of the RBM5 signal normalized to the GAPDH signal (right). For all dot plots, n = 4 biologically independent animals. A two-sided t test was used, data are presented as mean values +/− SD. Source data are provided as a Source data file.
Fig. 4
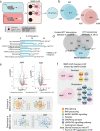
Fig. 4. RBM5-CLIP analysis from WT and HD mouse brain tissues.
a Experimental setup for CLIP analysis from WT and HD brain tissues. Briefly, HD and WT mouse brain tissues were treated with UV-light as for pCLAP. After lysis and partial RNase treatment, RBM5-RNA complexes were isolated using magnetic beads conjugated with either mouse (AbM) or rabbit (AbR) anti-RBM5 antibody and visualised on polyacrilamyde gel. Beads conjugated with unspecific IgG were used as background control. RNA targets bound to RBM5 were then purified and processed by high-throughput sequencing for identification and subsequent analyses. n = 3 independent animals for each sample type. RNA-Seq was subsequently performed from the same samples. b PCA plot showing RBM5-CLIP data with either antibody and the IgG controls. c Number and overlap of RBM5 RNA-targets identified from WT and HD mouse brain tissue (showing targets identified with both antibodies). d Metagene distribution of normalized reads from the RBM5-CLIP samples over exons and flanking intronic regions for all sample groups. e Overlap of RBM5 RNA targets identified by CLIP and RNAs localizing to the synapse (p value calculated by one-tailed Fischer exact test). f GO term enrichment analysis for KEGG pathways on RBM5 RNA targets identified by CLIP. g Number of genes encoding transcripts that are bound differentially by RBM5 in HD. h GO term enrichment analysis for KEGG pathways for the transcripts bound differentially by RBM5 in HD (p values in f, h were calculated using one-sided Fischer’s exact test). i Network of the 10 most significantly enriched GO KEGG pathways among genes encoding transcripts bound differentially by RBM5 in HD, where the GO terms are presented as blue nodes and genes falling under these terms are shown as yellow and red nodes connected with an edge to the nodes. Neurodegeneration relevant terms enlarged on the right.
Fig. 5
Fig. 5. Changes in transcriptome and proteome in HD coincide with changes in RBM5 RNA-binding.
a GO terms enrichment analysis for KEGG pathways for transcripts regulated in HD (p value: Fischer’s exact test with FDR correction). b Overlap of significant changes in HD mouse brains — RBM5-binding changes detected by CLIP analysis, transcriptome expression changes and proteome expression changes (p values: one-tailed Fischer’s exact test corrected for multiple testing). c Overlap of transcripts bound differently by RBM5 in HD and transcripts with intron or exon inclusion changes in HD (p values: one-tailed Fischer’s exact test corrected for multiple testing). df Data demonstrating RBM5 binding changes and splicing changes for Atrx, Ptprn and Adamts10. Left: Transcript regions with significant changes in RBM5-CLIP data and RNA-seq data, with the gene model shown on top. Top six lanes show RBM5-CLIP data: top two lanes show IgG controls, followed by RBM5-CLIP data acquired with either antibody (AbM and AbR) for both genotypes. Bottom two lanes show RNA-seq data for both genotypes. Significantly regulated RBM5-binding events or intron/exon inclusion in HD are highlighted. Top right: Gels showing PCR amplification products (location of primers used for PCR indicated with red arrowheads on gene model shown on the left) and the region of the corresponding isoform amplified (indicated on the right of the gel). Bottom right: Average intensity of quantified gel bands. n = 3 independent animals for HD and WT samples. g Schematic representation of RBM5 KD and OE using lentivirus transduction with RBM5 KD or OE vectors. h Normalized intensities for qPCR on human neurons amplifying an exonic region for RBM5 and intronic region for ATRX, ADAMTS10 and PTRPN in RBM5 KD and OE neurons. Primer locations are indicated with red arrowheads. n = 5 biologically independently differentiated and transduced replicates. i Analysis of previously published RNA-seq data from slower progressing HD R6/1 mouse model (prior to neuronal loss) for the same regions presented for Atrx, Adamts10 and Ptprn in df above. For all dot plots, data are presented as mean values +/− SD, p values: two-tailed t test, *p < 0.05, **p < 0.01, ns = not significant (source data in Source data file).
Fig. 6
Fig. 6. RBM5 interactome of the brain in WT and HD.
a Experimental setup for RBM5 AP-MS from brain tissue. HD and WT mouse brain tissues were lysed in non-denaturing conditions and RBM5 together with its interacting proteins were isolated using magnetic beads conjugated with either mouse (AbM) or rabbit (AbR) anti-RBM5 antibody. Empty beads were used as background control. The interactors of RBM5 were identified using mass-spectrometry. b Number of interactors identified for RBM5 with both antibodies from WT and HD brain tissue (only the proteins identified with both antibodies were considered true interactors). c GO term enrichment analysis for biological processes for the 619 RBM5 protein interactors (WT and HD combined). d Overlap between the proteins identified in this study as RBM5 interactors (WT and HD combined) in the mouse brain and HTT interactomes from previous publications, (one-tailed Fischer’s exact test). e Comparison between the WT and HD RBM5 protein interactome separately for AbM and AbR. Top: Volcano plot comparing the RBM5-interactomes in WT and HD. Bottom: Proteins interacting with RBM5 differently in HD shown in networks (two-sided t test with multiple-testing correction). f Venn diagrams showing the overlap of RBM5 protein interactions differentially regulated in HD identified with both antibodies and network representation of the overlapping proteins.
Fig. 7
Fig. 7. Working model.
The protein–protein interaction landscape involving RBM5 is perturbed in the HD mouse brain, where some proteins interact more (light pink) while others interact less (light blue) with RBM5. Some of the proteins interacting less with RBM5 are also components of HTT aggregates, which could explain the change to the RBM5 protein interactome in HD. Meanwhile RBM5 binds less to some transcripts (light blue) and more to others (light pink) in the HD mouse brain. The change in RBM5 binding to these transcripts then leads to changes in their splicing.

Similar articles

Cited by

References

    1. Dreyfuss G, Kim VN, Kataoka N. Messenger-RNA-binding proteins and the messages they carry. Nat. Rev. Mol. Cell Biol. 2002;3:195–205. doi: 10.1038/nrm760. - DOI - PubMed
    1. Glisovic T, Bachorik JL, Yong J, Dreyfuss G. RNA-binding proteins and post-transcriptional gene regulation. FEBS Lett. 2008;582:1977–1986. doi: 10.1016/j.febslet.2008.03.004. - DOI - PMC - PubMed
    1. Mitchell SF, Parker R. Principles and properties of eukaryotic mRNPs. Mol. Cell. 2014;54:547–558. doi: 10.1016/j.molcel.2014.04.033. - DOI - PubMed
    1. Lukong KE, Chang KW, Khandjian EW, Richard S. RNA-binding proteins in human genetic disease. Trends Genet. 2008;24:416–425. doi: 10.1016/j.tig.2008.05.004. - DOI - PubMed
    1. Pilaz LJ, Silver DL. Post-transcriptional regulation in corticogenesis: how RNA-binding proteins help build the brain. Wiley Interdiscip. Rev. RNA. 2015;6:501–515. doi: 10.1002/wrna.1289. - DOI - PMC - PubMed

Publication types