CHSY3 promotes proliferation and migration in gastric cancer and is associated with immune infiltration
- PMID: 37461041
- PMCID: PMC10351153
- DOI: 10.1186/s12967-023-04333-x
CHSY3 promotes proliferation and migration in gastric cancer and is associated with immune infiltration
Abstract
Background: The glycosyltransferase CHSY3 is a CHSY family member, yet its importance in the context of gastric cancer development remains incompletely understood. The present study was thus developed to explore the mechanistic importance of CHSY3 as a regulator of gastric cancer.
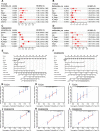
Methods: Expression of CHSY3 was verified by TCGA, GEO and HPA databases. Kaplan-Meier curve, ROC, univariate cox, multivariate cox, and nomogram models were used to verify the prognostic impact and predictive value of CHSY3. KEGG and GO methods were used to identify signaling pathways associated with CHSY3. TIDE and IPS scores were used to assess the immunotherapeutic value of CHSY3. WGCNA, Cytoscape constructs PPI networks and random forest models to identify key Hub genes. Finally, qRT-PCR and immunohistochemical staining were performed to verify CHSY3 expression in clinical specimens. The ability of CHSY3 to regulate tumor was further assessed by CCK-8 assay and cloning assay, EDU assay, migration assay, invasion assay, and xenograft tumor model analysis.
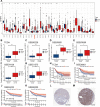
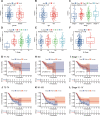
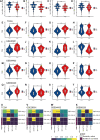
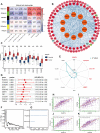
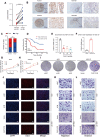
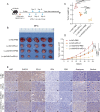
Results: The expression of CHSY3 was discovered to be abnormally upregulated in GC tissues through TCGA, GEO, and HPA databases, and the expression of CHSY3 was associated with poor prognosis in GC patients. Correlation analysis and Cox regression analysis revealed higher CHSY3 expression in higher T staging, an independent prognostic factor for GC. Moreover, elevated expression of CHSY3 was found to reduce the benefit of immunotherapy as assessed by the TIDE score and IPS score. Then, utilizing WGCNA, the PPI network constructed by Cytoscape, and random forest model, the Hub genes of COL5A2, POSTN, COL1A1, and FN1 associated with immunity were screened. Finally, the expression of CHSY3 in GC tissues was verified by qRT-PCR and immunohistochemical staining. Moreover, the expression of CHSY3 was further demonstrated by in vivo and in vitro experiments to promote the proliferation, migration, and invasive ability of GC.
Conclusions: The results of this study suggest that CHSY3 is an important regulator of gastric cancer progression, highlighting its promise as a therapeutic target for gastric cancer.
Keywords: CHSY3; Gastric cancer; IPS; Prognosis; TIDE.
© 2023. The Author(s).
Conflict of interest statement
The authors declare that the research was conducted in the absence of any commercial or financial relationships that could be construed as a potential conflict of interest.
Figures


Similar articles
-
The prognostic implications and tumor-promoting functions of CHSY3 in gastric cancer.Front Immunol. 2024 May 15;15:1364979. doi: 10.3389/fimmu.2024.1364979. eCollection 2024. Front Immunol. 2024. PMID: 38812506 Free PMC article.
-
Weighted correlation network analysis identifies FN1, COL1A1 and SERPINE1 associated with the progression and prognosis of gastric cancer.Cancer Biomark. 2021;31(1):59-75. doi: 10.3233/CBM-200594. Cancer Biomark. 2021. PMID: 33780362
-
CHSY3 can be a Poor Prognostic Biomarker and Mediates Immune Evasion in Stomach Adenocarcinoma.Front Genet. 2022 Apr 27;13:876588. doi: 10.3389/fgene.2022.876588. eCollection 2022. Front Genet. 2022. PMID: 35571047 Free PMC article.
-
Correlation analysis of lipid metabolism genes with the immune microenvironment in gastric cancer and the construction of a novel gene signature.Clin Transl Oncol. 2023 May;25(5):1315-1331. doi: 10.1007/s12094-022-03038-9. Epub 2022 Dec 15. Clin Transl Oncol. 2023. PMID: 36520384
-
High expression of TMEM200A is associated with a poor prognosis and immune infiltration in gastric cancer.Pathol Oncol Res. 2023 Jan 19;29:1610893. doi: 10.3389/pore.2023.1610893. eCollection 2023. Pathol Oncol Res. 2023. PMID: 36741965 Free PMC article.
Cited by
-
Advancing bladder cancer management: development of a prognostic model and personalized therapy.Front Immunol. 2024 Jul 22;15:1430792. doi: 10.3389/fimmu.2024.1430792. eCollection 2024. Front Immunol. 2024. PMID: 39104534 Free PMC article.
-
The Up-Regulated Expression of Mitochondrial Membrane Molecule RHOT1 in Gastric Cancer Predicts the Prognosis of Patients and Promotes the Malignant Biological Behavior of Cells.Mol Biotechnol. 2024 Mar 6. doi: 10.1007/s12033-024-01107-8. Online ahead of print. Mol Biotechnol. 2024. PMID: 38448731
-
DDX52 gene expression in LUAD tissues indicates potential as a prognostic biomarker and therapeutic target.Sci Rep. 2023 Oct 13;13(1):17434. doi: 10.1038/s41598-023-44347-5. Sci Rep. 2023. PMID: 37833424 Free PMC article.
-
Novel prognostic biomarker TBC1D1 is associated with immunotherapy resistance in gliomas.Front Immunol. 2024 Mar 11;15:1372113. doi: 10.3389/fimmu.2024.1372113. eCollection 2024. Front Immunol. 2024. PMID: 38529286 Free PMC article.
-
The prognostic implications and tumor-promoting functions of CHSY3 in gastric cancer.Front Immunol. 2024 May 15;15:1364979. doi: 10.3389/fimmu.2024.1364979. eCollection 2024. Front Immunol. 2024. PMID: 38812506 Free PMC article.
References
Publication types
MeSH terms
Substances
LinkOut - more resources
Full Text Sources
Medical
Miscellaneous

