. 2023 Jul 17;9(1):251.
doi: 10.1038/s41420-023-01549-0.

Neuroprotective effect of a medium-chain triglyceride ketogenic diet on MPTP-induced Parkinson's disease mice: a combination of transcriptomics and metabolomics in the substantia nigra and fecal microbiome

Affiliations

Neuroprotective effect of a medium-chain triglyceride ketogenic diet on MPTP-induced Parkinson's disease mice: a combination of transcriptomics and metabolomics in the substantia nigra and fecal microbiome

Wenlong Zhang et al. Cell Death Discov. .

Abstract

The ketogenic diet (KD) is a low carbohydrate and high-fat protein diet. It plays a protective role in neurodegenerative diseases by elevating the levels of ketone bodies in blood, regulating central and peripheral metabolism and mitochondrial functions, inhibiting neuroinflammation and oxidative stress, and altering the gut microbiota. However, studies on ketogenic therapy for Parkinson's disease (PD) are still in their infancy. Therefore, we examined the possible protective effect of KD in a 1-methyl-4-phenyl-1,2,3,6-tetrahydropyridine (MPTP)-induced PD mouse model, examined the mouse gut microbiota and its metabolites, and performed transcriptomics and metabolomics on the substantia nigra of mice. Our results showed that a long-term medium-chain triglyceride KD (MCT-KD) significantly reduced MPTP-induced damage to dopaminergic (DA) neurons, exerted antioxidant stress through the PI3K/Akt/Nrf2 pathway, and reversed oxidative stress in DA neurons. The MCT-KD also reduced mitochondrial loss, promoted ATP production, and inhibited the activation of microglia to protect DA neurons in MPTP-induced PD mice. MCT-KD altered the gut microbiota and consequently changed the metabolism of substantia nigra neurons through gut microbiota metabolites. Compared to the MPTP group, MCT-KD increased the abundance of gut microbiota, including Blautia and Romboutsia. MCT-KD also affects purine metabolism in the substantia nigra pars compacta (SNpc) by altering fecal metabolites. This study shows that MCT-KD has multiple protective effects against PD.


Conflict of interest statement

The authors declare no competing interests.

Figures
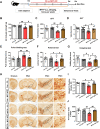
Fig. 1
Fig. 1. MCT-KD improved motor deficits and protected DA neuron loss in PD mice.
A Experimental design for medium-chain triglyceride KD (MCT-KD) treatment in MPTP-induced PD mice. B The limb-grip strength test was used to measure the muscle strength of the forelimbs. C Total travel distance of the mice in the open field experiment. D Mean velocity of the mice in the open field experiment. E The pole-climbing test was used to assess the motor coordination of mice. F The rotarod test was used to assess the motor coordination of mice. G The grasping test was used to assess the grip strength of mice; n = 10 for each of the Ctrl + CD group, Ctrl + MCT-KD group, MPTP + CD group, and MPTP + MCT-KD group. H Immunohistochemical staining of TH-positive neurons in the striatum and pars compacta of substantia nigra (SNpc) in the Ctrl + CD group, Ctrl + MCT-KD group, MPTP + CD group, and MPTP + MCT-KD group. The ellipse represents the boundary of the SNpc, and the middle box represents the area expanded in the right column. I Quantification of the TH-positive density in the striatum. J Quantification of TH-positive neurons in the SN; n = 6. Data are presented as the mean ± SEM. **p < 0.01 vs. the Ctrl + CD group. ##p < 0.01, #p < 0.05 vs. the MPTP + CD group. One-way ANOVA with Tukey’s post hoc analysis was used for comparison among multiple groups.
Fig. 2
Fig. 2. MCT-KD increased TH expression and DA synthesis in PD mice.
AD Western blots and quantitative analysis showed the expression levels of TH and DAT in the SN and striatum in the Ctrl + CD group, MPTP + CD group, and MPTP + MCT-KD group; n = 3 per group. EH Expression levels of dopamine, DOPAC, 5-HT, and 5-HIAA were assessed by HPLC‐MS/MS analysis; n = 4 per group. I, J β-hydroxybutyrate and glucose in plasma were measured; n = 10. Data are presented as the mean ± SEM. **p < 0.01, *p < 0.05 vs. the Ctrl + CD group. ##p < 0.01, #p < 0.05 vs. the MPTP + CD group. Statistical significance was determined by one-way ANOVA and Tukey’s tests for post hoc comparisons.
Fig. 3
Fig. 3. RNA-sequencing analysis of the ketogenic diet in MPTP-induced PD mouse model.
A, B Volcano plots showing the differentially expressed genes (DEGs) between the Ctrl + CD group and MPTP + CD group, as well as between the MPTP + CD group and MPTP + MCT-KD group. C Hierarchical clustering of 43 representative MPTP + MCT-KD group reversed DEGs that were decreased in the MPTP + CD group compared to the Ctrl + CD group. D PCoA diagram based on the OTU matrix of mouse DEG in the MPTP + CD group and MPTP + MCT-KD group. The ellipse represents the standard deviation of the samples. E Kyoto Encyclopedia of Genes and Genomes (KEGG) pathways enriched by DEGs among the Ctrl + CD group, MPTP + CD group, and MPTP + MCT-KD group. Blue tones show the oxidative-stress relative pathways. F, G Number and p-values of identified DEGs in oxidative-stress related KEGG pathways. H, I Log2(fold change) and p-values of 43 individual DEGs enriched in KEGG pathways.
Fig. 4
Fig. 4. Ketogenic diet targets the PI3K-Akt pathway in the MPTP-induced PD mouse model.
A, B Western blots and quantitative analysis showing the expression levels of P-PI3K, PI3K, P-Akt, Akt, and Nrf2 in the SN in the Ctrl + CD group, MPTP + CD group, and MPTP + MCT-KD group; n = 3 per group. C, D Contents of SOD and GSH in the three groups. E Relative GSH/GSSH ratio in the three groups; n = 5 per group. Data are presented as the mean ± SEM. **p < 0.01, *p < 0.05 vs. the Ctrl group. ##p < 0.01, #p < 0.05 vs. the MPTP + MCT-KD group. F Ultrastructural analysis of mitochondria for the original and magnified images in the three groups. G Immunofluorescent studies of TH (green) and Bcl-2 (red) in the SN. H Content of ATP in SN; n = 6 per group. Data are presented as the mean ± SEM. **p < 0.0. vs. the Ctrl + CD group, ##p < 0.01 vs. the MPTP + CD group. I, J Western blots and quantitative analysis showed the expression levels of Bcl-2 and Bax; n = 3 per group. Data are presented as the mean ± SEM. **p < 0.01, *p < 0.05 vs. the Ctrl + CD group. ##p < 0.01, #p < 0.05 vs. the MPTP + CD group. K Representative graphs of Mito-Sox (red) and Hoechst (blue) upon β-hydroxybutyrate (BHB) treatment in the control or MPP+-treated cells. L Representative graphs of ROS (green) and Hoechst (blue) upon BHB treatment in the control or MPP+-treated cells. n = 4 per group. M, N Quantification of the relative Mito-Sox and ROS fluorescence intensity in the four groups; n = 4 per group. O, P Contents of SOD and GSH upon BHB treatment in the control or MPP + -treated cells. n = 4 per group. Q, R Relative GSH/GSSH and NADPH/NADP+ ratio in the control or MPP + -treated cells. n = 4 per group. Data are presented as the mean ± SEM. **p < 0.01, *p < 0.05 vs. the Control group. ##p < 0.01, #p < 0.05 vs. the MPP+ group. &&p < 0.01, &p < 0.05 vs. the MPP+ + BHB group. Statistical significance was determined by one-way ANOVA and Tukey’s tests for post hoc comparisons.
Fig. 5
Fig. 5. Ketogenic diet alleviates fecal microbiota dysbiosis in the MPTP-induced PD mouse model.
A, B Boxplot of the Simpson diversity index (A) and Shannon diversity index (B) in the Ctrl + CD group, MPTP + CD group, and MPTP + MCT-KD group. Data are presented as the mean ± SEM. **p < 0.01, *p < 0.05 vs. the Ctrl group. ##p < 0.01, #p < 0.05 vs. the MPTP + MCT-KD group. C Sample rank abundance curve for each group. D Boxplot of weighted Unifrac rank (R = 0.301, p = 0.001). E PCoA diagram based on the OTU matrix of mice fecal microbiota. F Heatmap analysis of the relative abundances of fecal microbiota at the family level in the three groups. G Relative abundances of fecal microbiota at the family level in the three groups. H Relative abundance of significantly altered fecal microbiota between the MPTP group and MPTP + MCT-KD group. Data are presented as the mean ± SEM. **p < 0.01, *p < 0.05 vs. the MPTP + MCT-KD group. I Mean Decrease Gini analysis of fecal microbiota alterations at the family level. J Graphical phylogenetic analysis of gut microbiota alterations among the three groups. Each dot represents the relative abundance of fecal microbiota. K Ternary phase diagram shows the ratio relationship of different fecal microbiota of the three groups. The circle sizes represent the average relative abundance of species. Statistical significance was determined using one-way ANOVA and Tukey’s tests for post hoc comparisons.
Fig. 6
Fig. 6. Metabolomic analysis of fecal pellets of MPTP-treated mice.
A, B Volcano plots showing the DEGs between the Ctrl + CD group and MPTP + CD group, as well as between the MPTP + CD group and MPTP + MCT-KD group. C, D Hierarchical clustering of representative differential metabolites in fecal pellets among the three groups. E Correlation analysis of the top 15 different fecal pellet metabolites between the Ctrl group and MPTP group. F Correlation analysis of the top 15 different fecal pellet metabolites between the MPTP group and MPTP + MCT-KD group. G OPLS-DA analysis of fecal pellet metabolites among the three groups. H, I Relative abundance of the main differential fecal pellet metabolites among the three groups. J Differential metabolites in feces were analyzed by KEGG functional annotation and enrichment analysis. Data are presented as the mean ± SEM. **p < 0.01, *p < 0.05 vs. the MPTP + MCT-KD group. ##p < 0.01, #p < 0.05 vs. the Ctrl group. Statistical significance was determined using one-way ANOVA and Tukey’s tests for post hoc comparisons.
Fig. 7
Fig. 7. Metabolomic analysis of ketogenic diet treatment in the SNpc of MPTP-treated mice.
A, B Volcano plots showing the DEGs between the Ctrl + CD group and MPTP + CD group, as well as between the MPTP + CD group and MPTP + MCT-KD group. C Correlation analysis of the top 15 different metabolites in the SNpc between the Ctrl + CD group and MPTP + CD group. D Correlation analysis of the top 15 different metabolites in SNpc between the MPTP + CD group and MPTP + MCT-KD group. E Functional annotation and enrichment analysis of differential metabolite KEGG. F Hierarchical clustering of representative differential metabolites in SNpc among three groups. G Functional annotation and enrichment analysis of differential metabolite KEGG between the Ctrl + CD group and MPTP + CD group. H Functional annotation and enrichment analysis of differential metabolite KEGG between the MPTP + CD group and MPTP + MCT-KD group. I Number of differential metabolites between the Ctrl + CD group and MPTP + CD group based on the HMDB database. J Number of differential metabolites between the MPTP + CD group and MPTP + MCT-KD group based on the HMDB database. K, L Relative differential metabolite abundance among three groups. Data are presented as the mean ± SEM. **p < 0.01, *p < 0.05 vs. the MPTP + MCT-KD group. ##p < 0.01, #p < 0.05 vs. the Ctrl group. Statistical significance was determined using one-way ANOVA and Tukey’s tests for post hoc comparisons.
Fig. 8
Fig. 8. Ketogenic diet attenuates neuroinflammation in the SN of PD mice.
A Iba1 was used to stain microglia in the Ctrl + CD group, Ctrl + MCT-KD group, MPTP + CD group, and MPTP + MCT-KD group. Maximum intensity projection of fluorescence images was transformed into binary images and then skeletonized. BD Quantitative analysis of the number of endpoints, process length, and cell body volume of Iba1-positive cells after skeletonization; n = 6 per group. EG Quantitative analysis of TNF-α, IL-1β, and IL-6 mRNA expression in the SN; n = 6 per group. Data are presented as the mean ± SEM. **p < 0.01 vs. the Ctrl + CD group. ##p < 0.01, #p < 0.05 vs. the MPTP + CD group. Statistical significance was determined by one-way ANOVA and Tukey’s tests for post hoc comparisons. (H) Graphical abstract of the role of the ketogenic diet in Parkinson’s disease.

Similar articles

Cited by

References

    1. Poewe W, Seppi K, Tanner CM, Halliday GM, Brundin P, Volkmann J, et al. Parkinson disease. Nat Rev Dis Primers. 2017;3:17013. doi: 10.1038/nrdp.2017.13. - DOI - PubMed
    1. Burch D, Sheerin F. Parkinson’s disease. Lancet. 2005;365:622–7. doi: 10.1016/S0140-6736(05)70807-2. - DOI - PubMed
    1. Michel PP, Hirsch EC, Hunot S. Understanding dopaminergic cell death pathways in Parkinson disease. Neuron. 2016;90:675–91. doi: 10.1016/j.neuron.2016.03.038. - DOI - PubMed
    1. González-Rodríguez P, Zampese E, Stout KA, Guzman JN, Ilijic E, Yang B, et al. Disruption of mitochondrial complex I induces progressive parkinsonism. Nature. 2021;599:650–6. doi: 10.1038/s41586-021-04059-0. - DOI - PMC - PubMed
    1. Wright R. Mitochondrial dysfunction and Parkinson’s disease. Nat Neurosci. 2022;25:2. doi: 10.1038/s41593-021-00989-0. - DOI - PubMed