

Backscattering amplitude in ultrasound localization microscopy
- PMID: 37455266
- PMCID: PMC10350458
- DOI: 10.1038/s41598-023-38531-w
Backscattering amplitude in ultrasound localization microscopy
Abstract
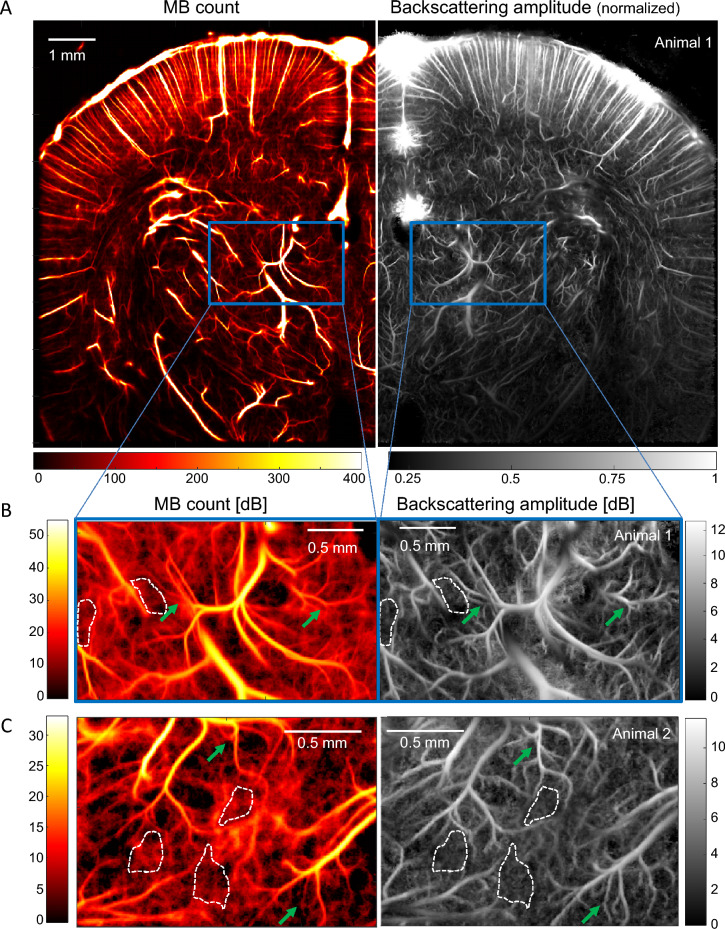
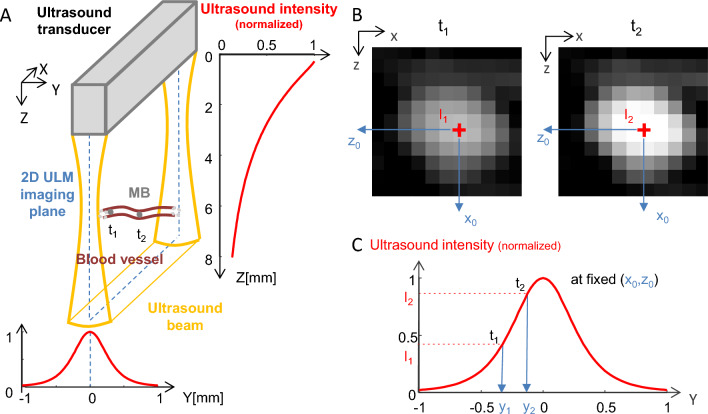
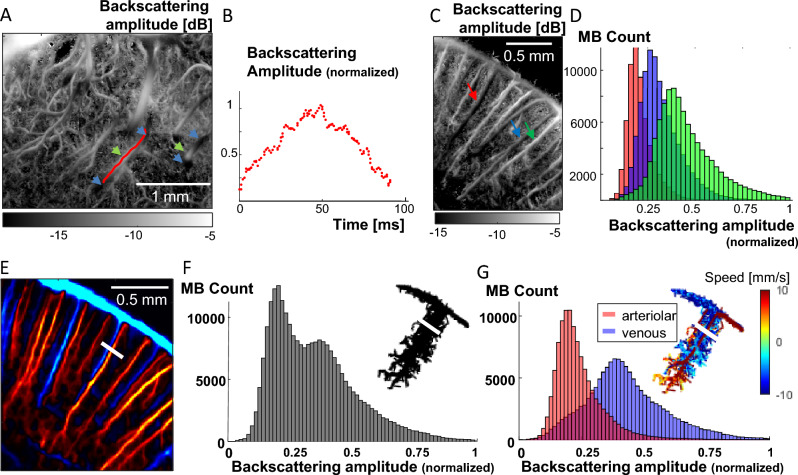
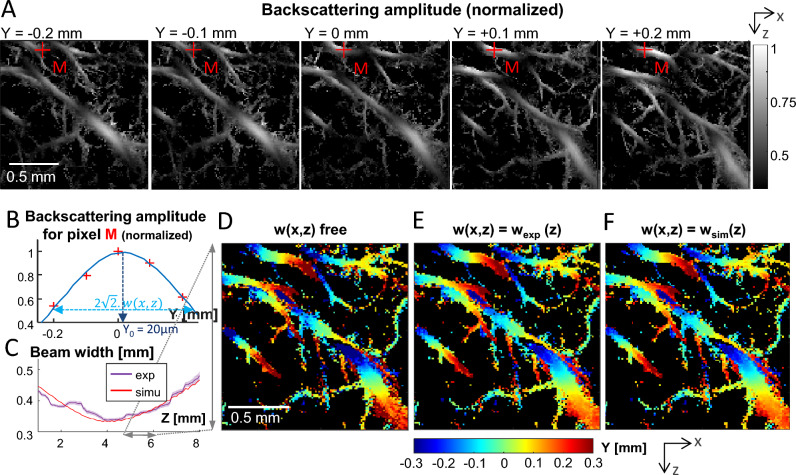
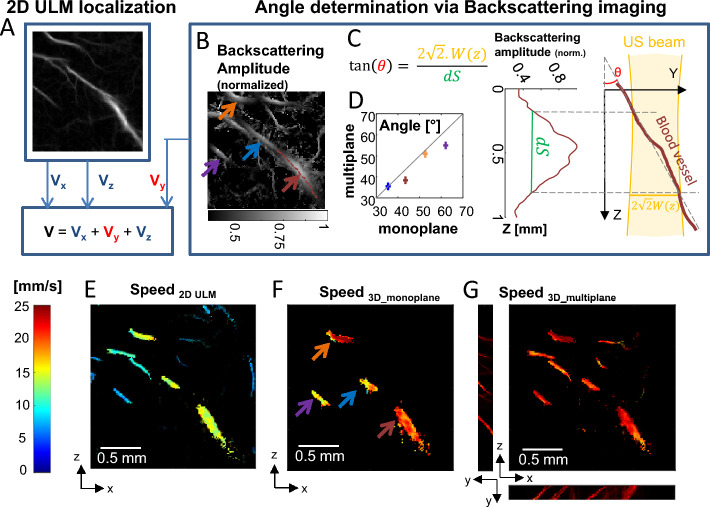
In the last decade, Ultrafast ultrasound localisation microscopy has taken non-invasive deep vascular imaging down to the microscopic level. By imaging diluted suspensions of circulating microbubbles in the blood stream at kHz frame rate and localizing the center of their individual point spread function with a sub-resolution precision, it enabled to break the unvanquished trade-off between depth of imaging and resolution by microscopically mapping the microbubbles flux and velocities deep into tissue. However, ULM also suffers limitations. Many small vessels are not visible in the ULM images due to the noise level in areas dimly explored by the microbubbles. Moreover, as the vast majority of studies are performed using 2D imaging, quantification is limited to in-plane velocity or flux measurements which hinders the accurate velocity determination and quantification. Here we show that the backscattering amplitude of each individual microbubble can also be exploited to produce backscattering images of the vascularization with a higher sensitivity compared to conventional ULM images. By providing valuable information about the relative distance of the microbubble to the 2D imaging plane in the out-of-plane direction, backscattering ULM images introduces a physically relevant 3D rendering perception in the vascular maps. It also retrieves the missing information about the out-of-plane motion of microbubbles and provides a way to improve 3D flow and velocity quantification using 2D ULM. These results pave the way to improved visualization and quantification for 2D and 3D ULM.
© 2023. The Author(s).
Conflict of interest statement
M.T. is a co-founder and shareholder of the Iconeus company, which commercializes ultrasound neuroimaging scanners. M.T. is a co-inventor of the patent WO2012080614A1 filed on 2010-12-16 and licenced to Iconeus company. All other authors declare no competing interests.
Figures
Similar articles
-
Frame rate effects and their compensation on super-resolution microvessel imaging using ultrasound localization microscopy.Ultrasonics. 2023 Jul;132:107009. doi: 10.1016/j.ultras.2023.107009. Epub 2023 Apr 10. Ultrasonics. 2023. PMID: 37060620
-
Ultrasound localization microscopy.Z Med Phys. 2023 Aug;33(3):292-308. doi: 10.1016/j.zemedi.2023.02.004. Epub 2023 Jun 15. Z Med Phys. 2023. PMID: 37328329 Free PMC article. Review.
-
Ultrafast ultrasound localization microscopy for deep super-resolution vascular imaging.Nature. 2015 Nov 26;527(7579):499-502. doi: 10.1038/nature16066. Nature. 2015. PMID: 26607546
-
Context-aware deep learning enables high-efficacy localization of high concentration microbubbles for super-resolution ultrasound localization microscopy.Nat Commun. 2024 Apr 4;15(1):2932. doi: 10.1038/s41467-024-47154-2. Nat Commun. 2024. PMID: 38575577 Free PMC article.
-
A Review of Clinical Applications for Super-resolution Ultrasound Localization Microscopy.Curr Med Sci. 2022 Feb;42(1):1-16. doi: 10.1007/s11596-021-2459-2. Epub 2022 Feb 15. Curr Med Sci. 2022. PMID: 35167000 Review.
Cited by
-
Functional Assessment of Cerebral Capillaries using Single Capillary Reporters in Ultrasound Localization Microscopy.ArXiv [Preprint]. 2024 Jul 11:arXiv:2407.07857v2. ArXiv. 2024. PMID: 39040644 Free PMC article. Preprint.
References
-
- Couture, O., Besson, B., Montaldo, G., Fink, M. & Tanter, M. Microbubble ultrasound super-localization imaging (MUSLI). In 2011 IEEE International Ultrasonics Symposium, 1285–1287 (2011). 10.1109/ULTSYM.2011.6293576.
-
- Siepmann, M., Schmitz, G., Bzyl, J., Palmowski, M. & Kiessling, F. Imaging tumor vascularity by tracing single microbubbles. In 2011 IEEE International Ultrasonics Symposium, 1906–1909 (2011). 10.1109/ULTSYM.2011.0476.
-
- Desailly Y, Couture O, Fink M, Tanter M. Sono-activated ultrasound localization microscopy. Appl. Phys. Lett. 2013;103:174107. doi: 10.1063/1.4826597. - DOI
Publication types
MeSH terms
Substances
LinkOut - more resources
Full Text Sources
